Project 2 Thermal modeling of battery pack
Thermal modeling of battery pack:
A 10-cell series lithium-ion battery model is made in MATLAB and simulated at different temperatures of 298K, 310K, and 323K. The area of contact is also varied for each cell. The pack is modeled in such a way that each cell's temperature could be measured.
Model:
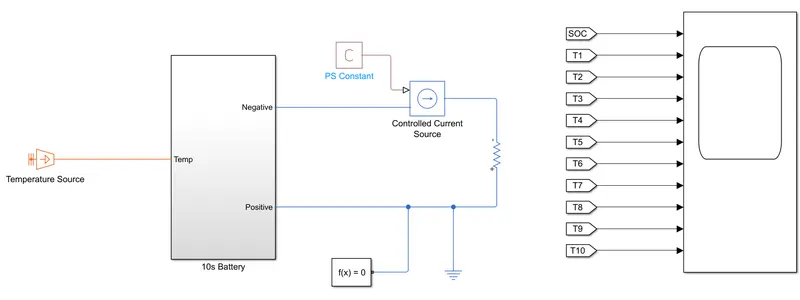
10s battery subsystem:
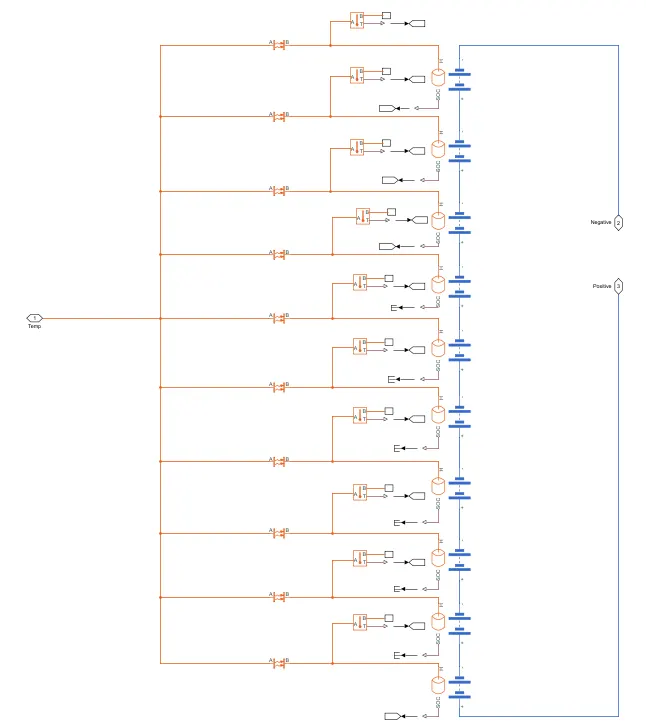
Important Blocks used:
Temperature source

This block represents an ideal energy source in a thermal network that can maintain a constant absolute temperature at the port regardless of the heat flow rate. It is used to give the temperature source for the battery for simulation.
Convective heat transfer

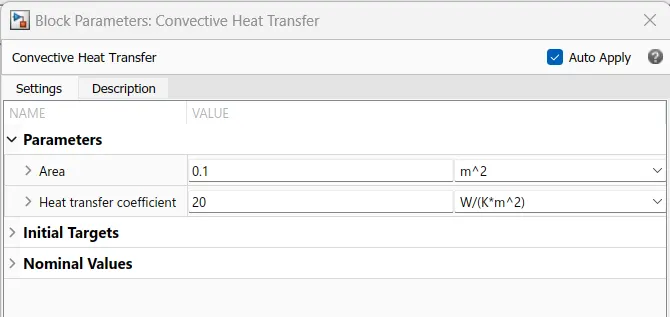
This block models heat transfer in a thermal network by convection due to fluid motion. The rate of heat transfer is proportional to the temperature difference, heat transfer coefficient, and surface area in contact with the fluid. Here, we can specify the area of contact and heat transfer coefficient.
Temperature sensor
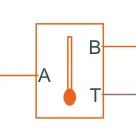
This block measures temperature in a thermal network. There is no heat flow through the sensor. The physical signal port T reports the temperature difference across the sensor. The measurement is positive when the temperature at port A is greater than the temperature at port B. Here we have to connect the A- port to the source and the B- port to the sink or thermal reference.
Battery (Table-based)
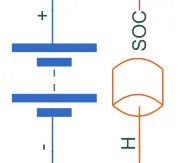
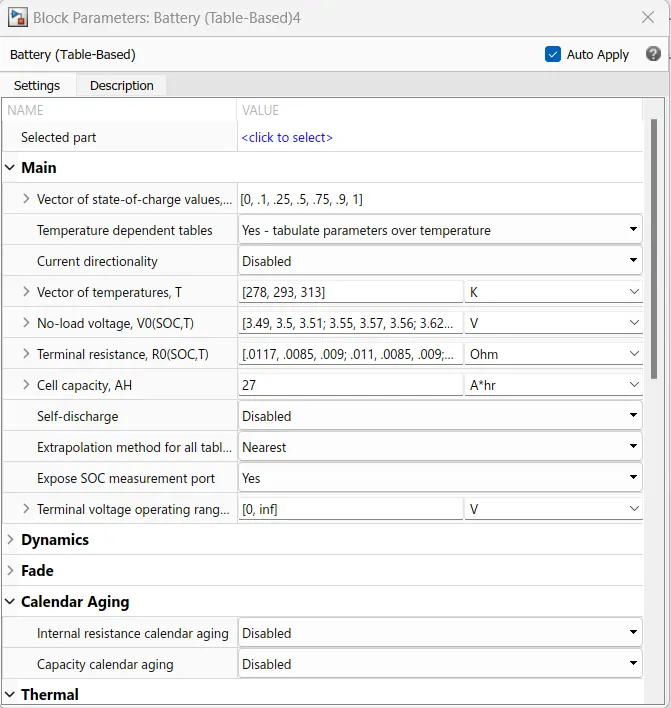
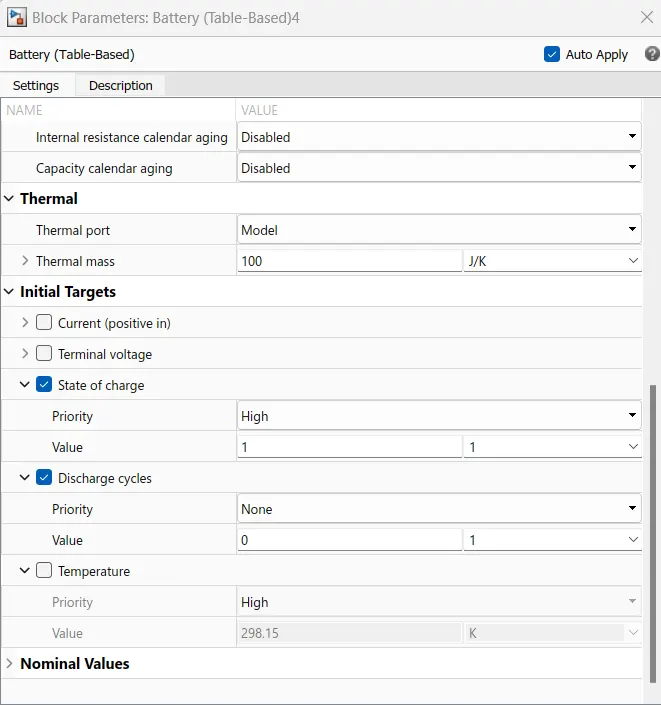
This block models a battery based on tabulated characteristics as functions of the state of charge (SOC) and optional temperature (T). The heat input and the SOC output port are enabled manually in the block parameters.
Block parameters:
Temperature source
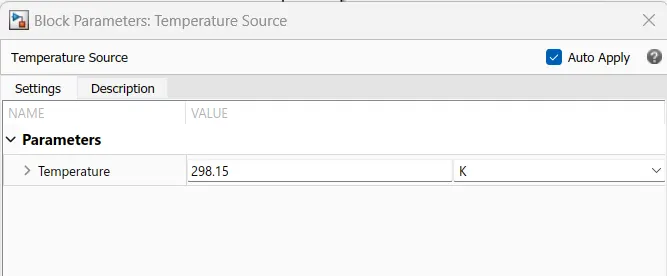
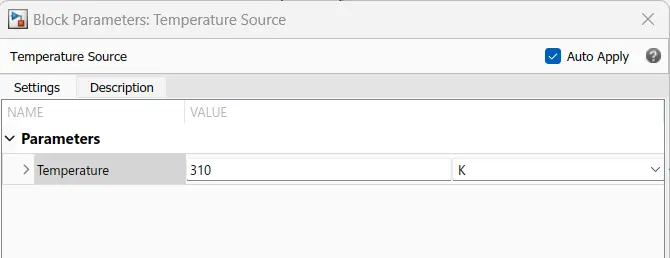
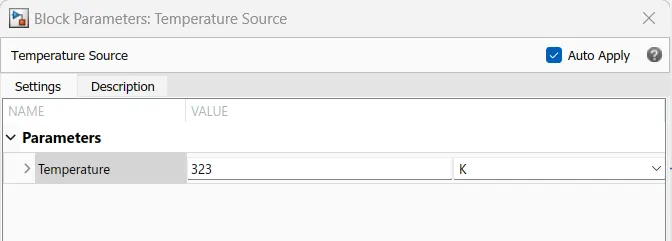
In the temperature source block, the temperature is varied from 298.15 to 323K and is shown below.
Convective heat transfer
Similar to the temperature source block, here the area is varied between each cell. The areas are,
A1 = 0.1 m2
A2 = 0.06 m2
A3 = 0.04 m2
A4 = 0.02 m2
A5 = 0.001 m2
A6 = 0.02 m2
A7 = 0.04 m2
A8 = 0.06 m2
A9 = 0.08 m2
A10 = 0.1 m2
Battery (table-based)
Resistor
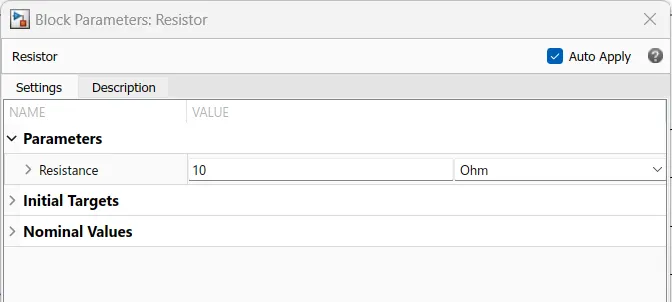
The resistor value is given as 10 ohms.
Results:
SOC and Temperature of each cell
1. Temperature = 298.15 K
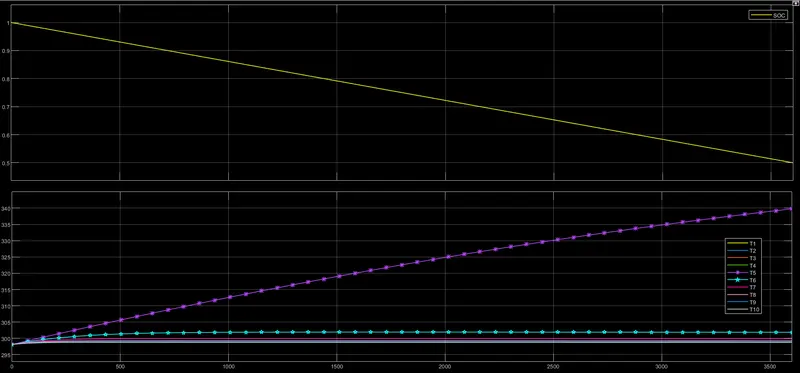
Observation - The cell with the low heat transfer area has more temperature compared to the other cells. Also the inner cells which are T4, T5, and T6 have comparatively more temperatures.
2. T = 310 K
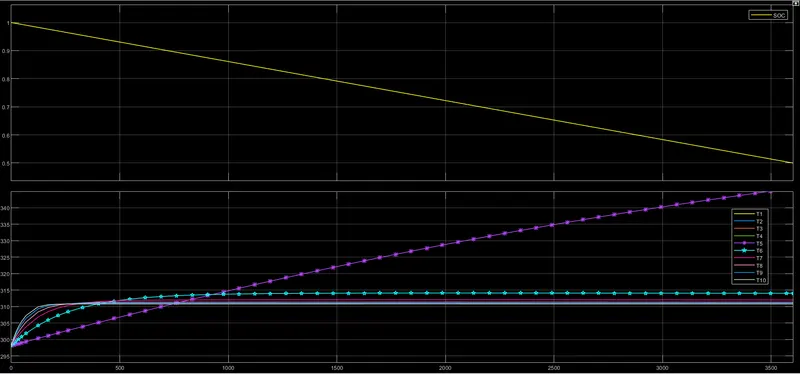
Observation - After increasing the temperature source, the cells' temperatures are also increasing, and also we could see that the temperature of cell T5 is increasing linearly while the other cell temperatures increased initially and then became constant.
3. T = 323 K
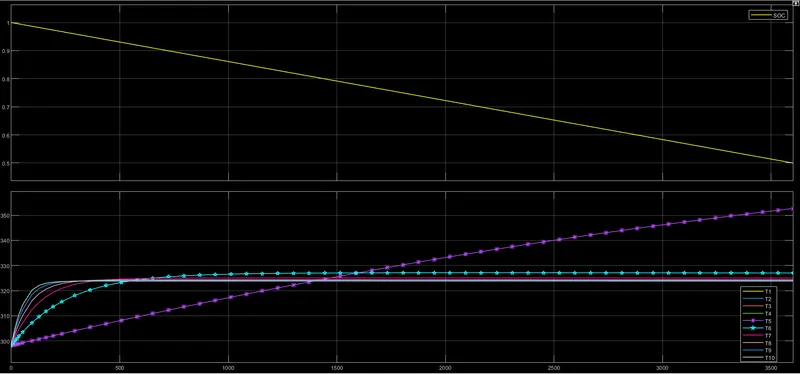
Observation - Again after increasing the temperature, we could see the same pattern in the temperature of the cells.
For the above plots, the input source signal is given as a constant current signal of 0.5C rate.
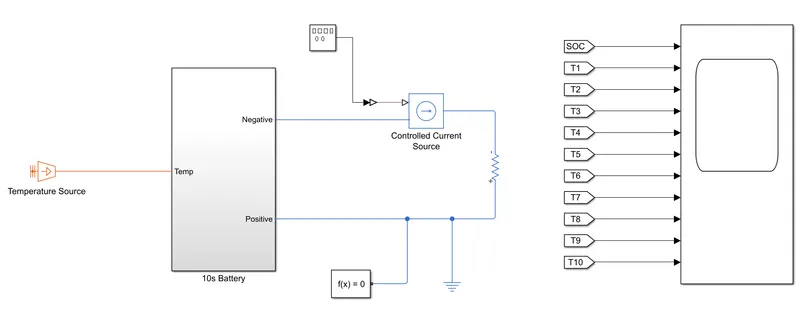
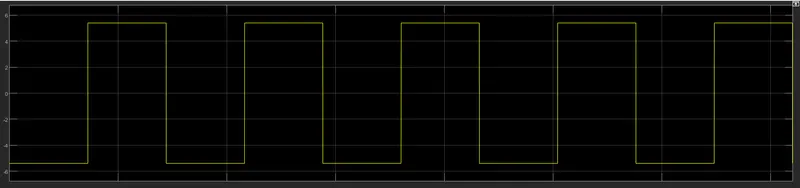
Now, the input signal is given using a square wave generator block and the results are shown below,
Model,
Input signal,
Results,
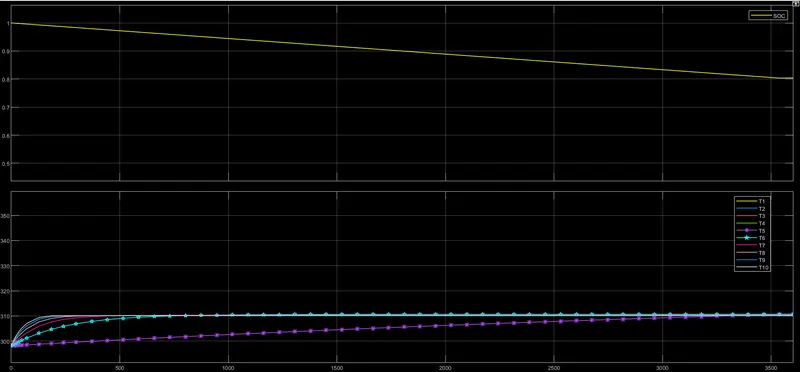
1. T = 310 K
2. T = 323 K
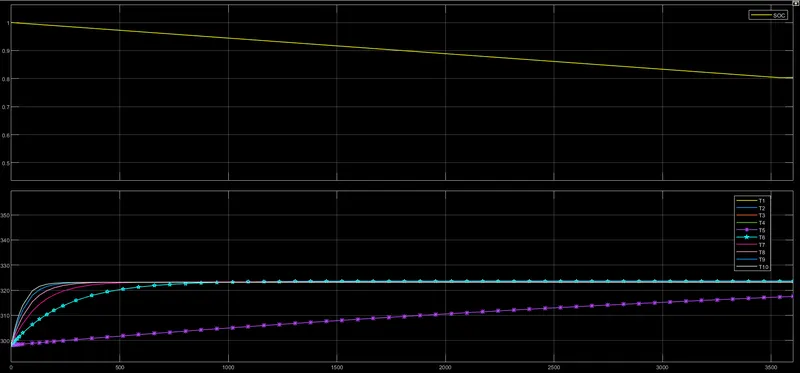
Observation - In both results, due to the increase and decrease of input signal current, the temperature increases slowly and then maintains a constant temperature. As we can see, the innermost cell T5's temperature was slowly increasing and as the cycle proceeds further the temperature increased.
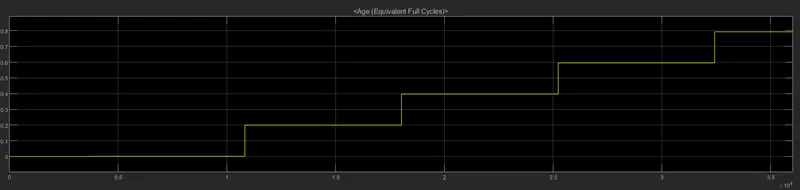
Lifecycle:
The lifecycle is simulated for the square wave input signal,
Conclusion:
The thermal effect was simulated for different temperatures and different areas of contact for each cell and the results were analyzed. Lithium-ion performs well at elevated temperatures but prolonged exposure to heat reduces longevity. Charging and discharging at elevated temperatures cause swelling. There is a limit to the temperature range of the battery and these factors are considered while designing a battery pack enclosure to provide the necessary cooling.