Project 2 Thermal modeling of battery pack
ans-
need of an battery modeling-
An accurate forecast of the remaining driving range of an electric vehicle (EV) is crucial to avoid range anxiety. Drivers need to know how much further they would travel before their vehicle batteries require a recharge. In addition, the battery management system should predict when batteries need replacement. The remaining charge calculation must be precise to utilize the battery’s full capability. The state of charge (SOC) of a battery or pack of batteries is analogous to a fuel gauge of a conventional vehicle.
now a days lithium ion battery are mostly used in electric vehicles we must know its charge and discharge rates to operate this batterys in efficient manner and with out damage when this batterys in operation this temperature of it must be kept in limit we simulate the thermal effect of this cell , by knowing the how much temp rise take place we can provide efficient cooling to the batterys so that the life cycle of the battery increases
cells connected in series and one of the cell is faulty so what will be thermal effect . This example shows how to simulate a battery pack consisting of multiple series-connected cells in an efficient manner. It also shows how a fault can be introduced into one of the cells to see the impact on battery performance and cell temperatures. For efficiency, identical series-connected cells are not just simply modeled by connecting cell models in series. Instead a single cell is used, and the terminal voltage scaled up by the number of cells. The fault is represented by changing the parameters for the Cell 10 Fault subsystem, reducing both capacity and open-circuit voltage, and increasing the resistance values.
constructions-
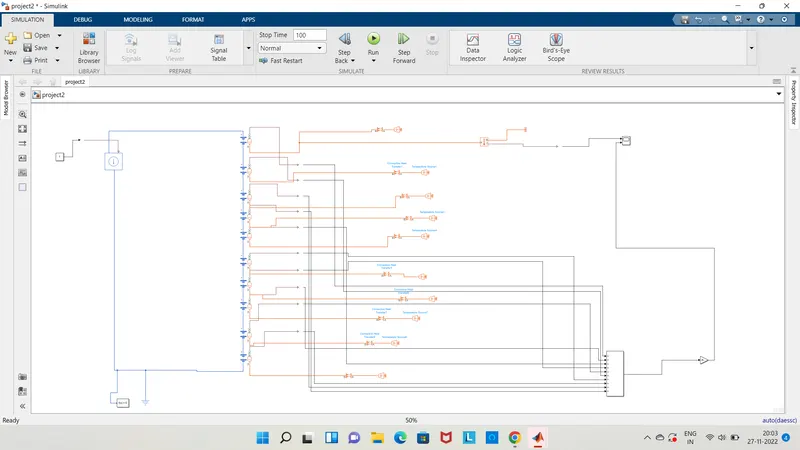
for this we use,1) table based battery
2)controlled current source
3)temperature source
4)temperature sensor
5)convective heat transfer
6)adder.solver,constant,gain,scope,ps simulink converter,etc.
1) table baseed battery-
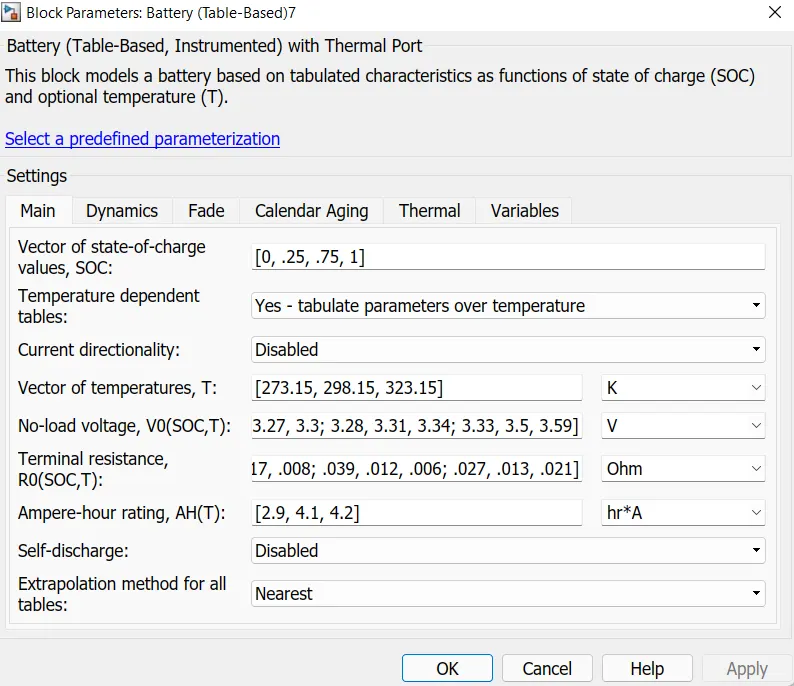
This block models a battery based on tabulated characteristics as functions of state of charge (SOC) and optional temperature (T).
The Battery (Table-Based) block has four modeling variants, accessible by right-clicking the block in your block diagram and then selecting the appropriate option from the context menu, under Simscape > Block choices:
Instrumented | Show thermal port — Model that lets you output internal charge level of the battery. Both the thermal port and the charge output port are exposed.

2) Temperature Sensors:
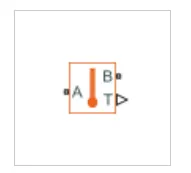
The Temperature Sensor block represents an ideal temperature sensor, that is, a device that determines the temperature differential measured between two points without drawing any heat.
Connections A and B are thermal conserving ports that connect to the two points where temperature is being monitored. Port T is a physical signal port that outputs the temperature differential value.
The block positive direction is from port A to port B. The measured temperature is determined as T = TA – TB.
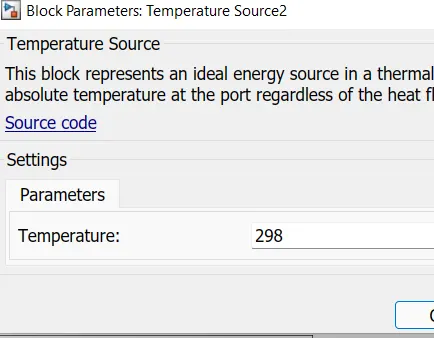
This block represents an ideal energy source in a thermal network that can maintain a constant absolute temperature at the port regardless of the heat flow rate.
This block is used for ambient temperature which we can set and check results .
3) Convective Heat Transfer:
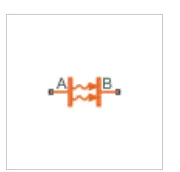
This block models heat transfer in a thermal network by convection due to fluid motion. The rate of heat transfer is proportional to the temperature difference, heat transfer coefficient, and surface area in contact with the fluid.
4) temperature sources-
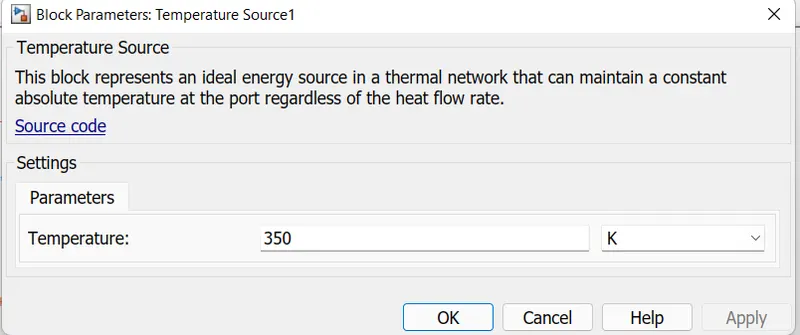
This block represents an ideal energy source in a thermal network that can maintain a constant absolute temperature at the port regardless of the heat flow rate

output-
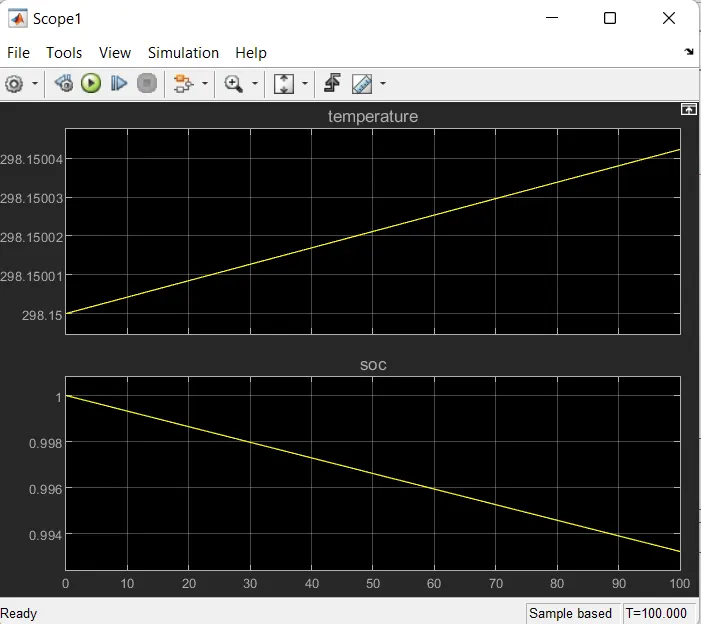
1) result at 298 k-
2) result at 350 k-
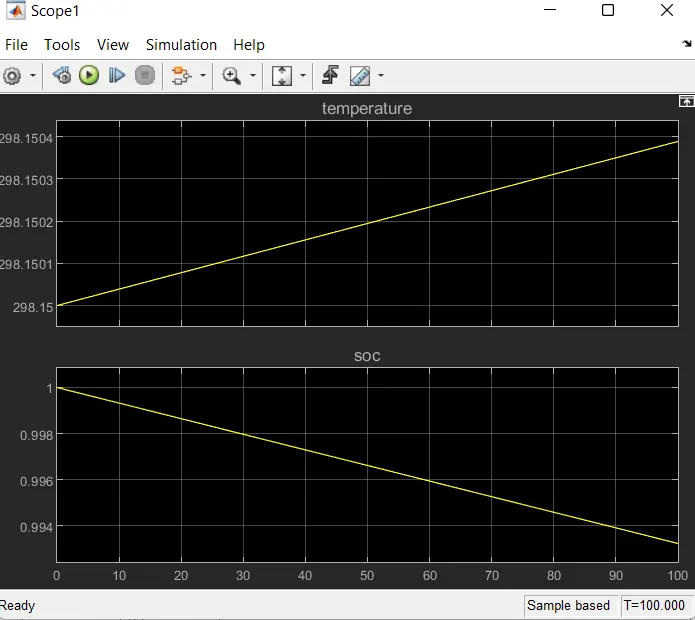
For a 10 cell series lithium ion battery model we simulate the thermal effects and compare life cycle performance at various temperatures, charge & discharge rates using MATLAB.
The thermal effects of battery pack at different ambient temperatures for cycling charging/discharging has been analysed and plotted. The life cycle performance also evaluated for individual cells and overall battery pack.
as we show that at 298 k temperature rises and soc is discharges downword side.
at same time if we increase 350 k temperature remain constant and soc quitely goes down.
In this model, individual cells were connected in series to make the battery pack. The thermal and life cycle performance of individual cells are different from battery pack.