Project 2 Thermal modeling of battery pack
ANSWER:
Thermal modeling of the battery pack
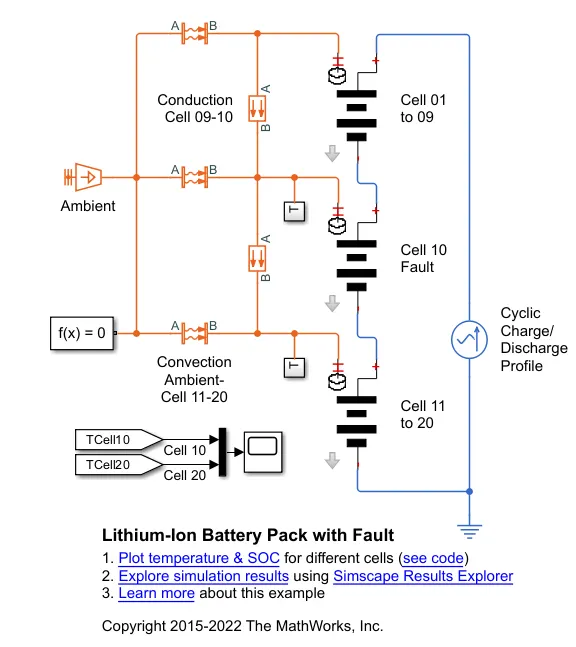
The temperature of a Lithium battery cell is important for its performance, efficiency, safety, and capacity and is influenced by the environmental temperature and by the charging and discharging process itself. Therefore, a thermal model of the battery is used in order to calculate and estimate the cell temperature. So, for the 10-cell series lithium-ion battery here I used MATLAB Simulink for finding a thermal effect and life cycle performance related to temperature, charge, and discharge.
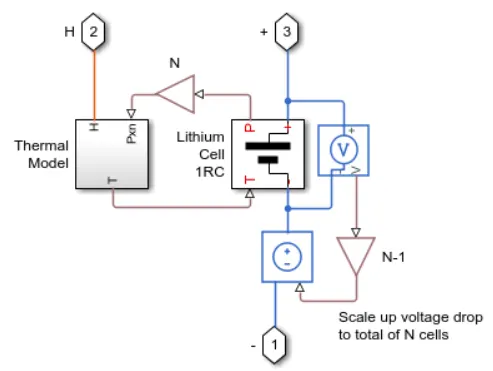
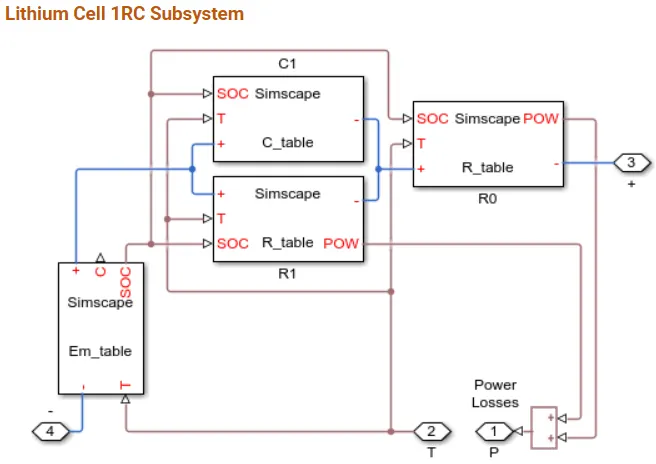
Resistance value (R) table which depends on an external physical signal inputs SOC and T.
Voltage value (EM) which implements the cell's main branch voltage source, and determines values for capacity (C) and state of charge (SOC). The defining equations depend on cell temperature, T.
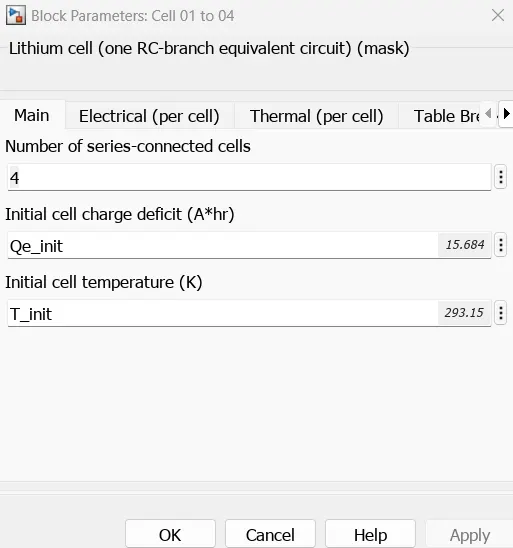
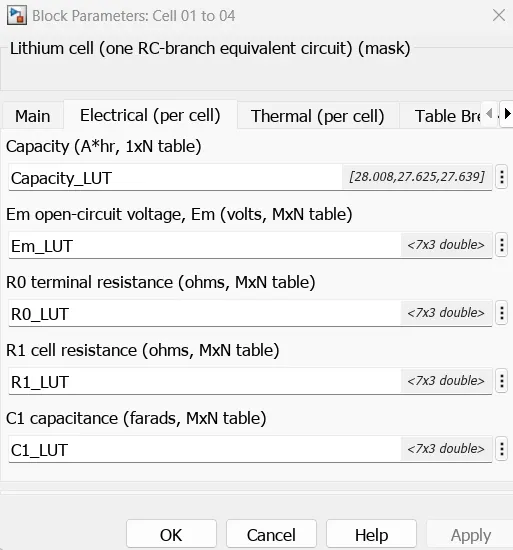
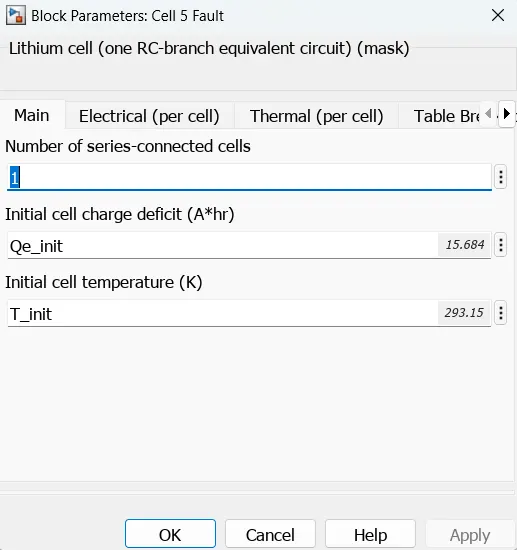
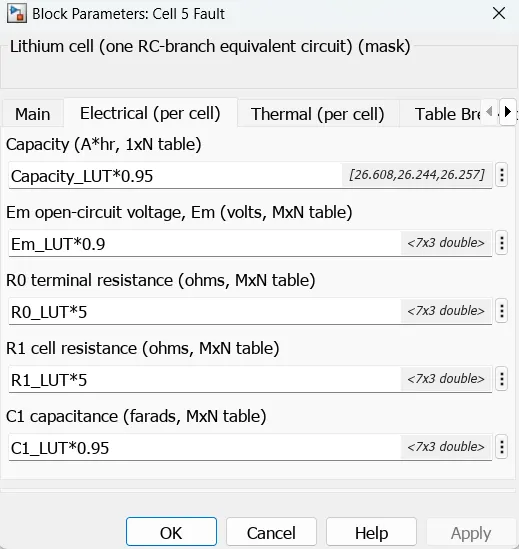
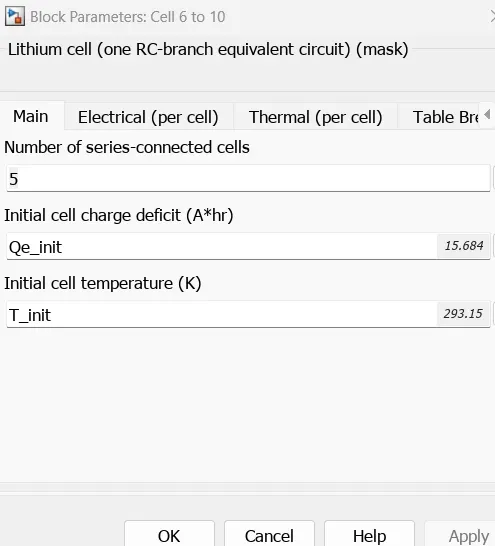
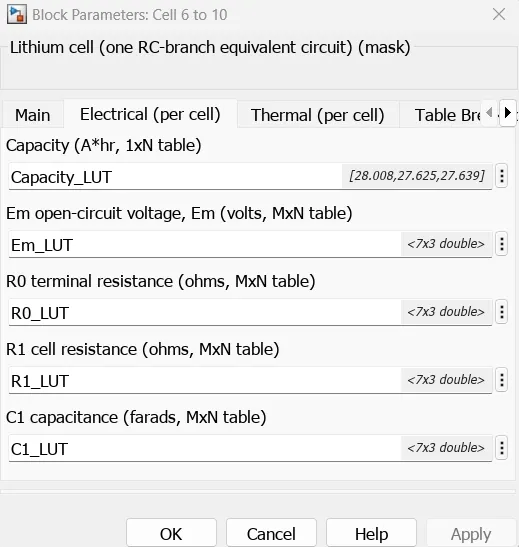
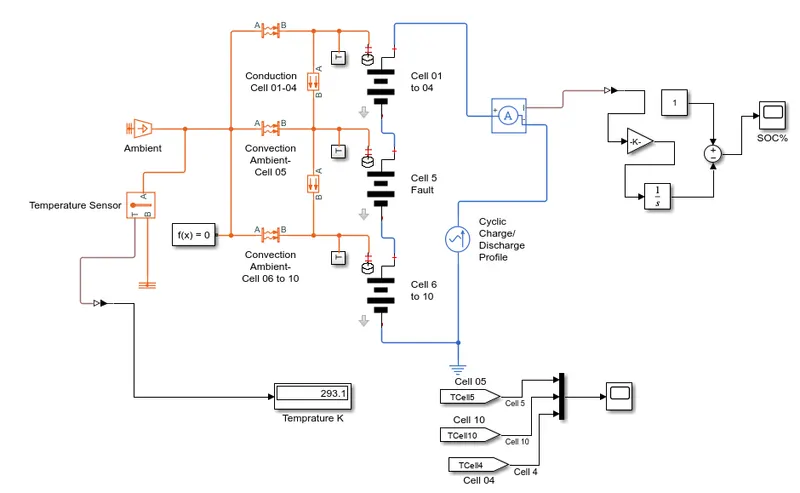
Output of one cell is connected with the SOC estimation whereas other output is connected with AC current source for cyclic charge/discharge profile.
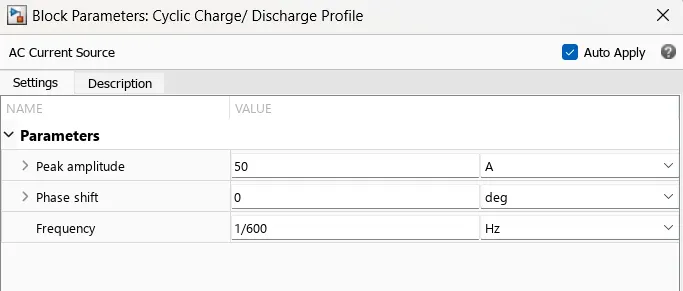
The peak amplitudes set to 50 A for cyclic charge and discharge. A basic parameter of AC current source is as
Temperature Source:

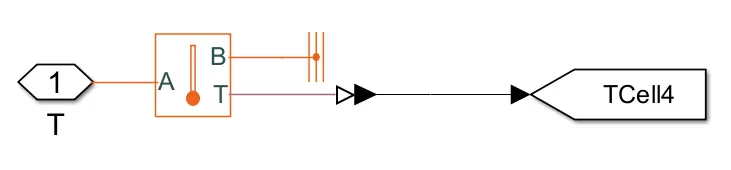
- The Temperature Sensor block represents an ideal temperature sensor, that is, a device that determines the temperature differential measured between two points without drawing any heat.
- Connections A and B are thermal conserving ports that connect to the two points where temperature is being monitored. Port T is a physical signal port that outputs the temperature differential value.
- The block positive direction is from port A to port B. The measured temperature is determined as T = TA – TB.
- This block represents an ideal energy source in a thermal network that can maintain a constant absolute temperature at the port regardless of the heat flow rate. This block is used for ambient temperature which we can set and check results.
Convective Heat Transfer:
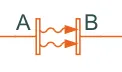
This block models heat transfer in a thermal network by convection due to fluid motion. The rate of heat transfer is proportional to the temperature difference, heat transfer coefficient, and surface area in contact with the fluid.
This used for 1-4 cells and 6-10 cell
From and goto blocks:
- The Goto block passes its input to its corresponding From blocks. The input can be a real- or complex-valued signal or vector of any data type. From and Goto blocks allow you to pass a signal from one block to another without actually connecting them.
- The From block accepts a signal from a corresponding Goto block, then passes it as output. The data type of the output is the same as that of the input from the Goto block. From and Goto blocks allow you to pass a signal from one block to another without actually connecting them.
State of Charge estimation:
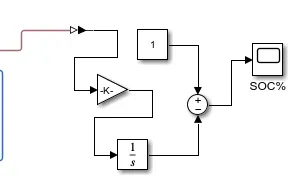
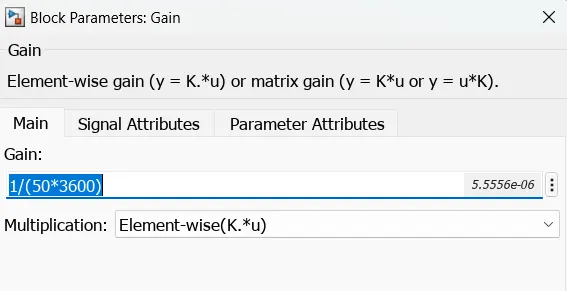
- The Coulomb counting method measures the discharging current of a battery and integrates the discharging current over time in order to estimate SOC
- This subsystem takes current as input and gives the battery SOC % as output. A current sensor block is used and connected for soc estimation
- This ckt estimates the battery SOC % using coulomb counting method. It takes current as the input and gives SOC% as output. Initial SOC of the battery is assumed to be 100% (1)
- example shows how to simulate a battery pack consisting of multiple series-connected cells in an efficient manner. It also shows how a fault can be introduced into one of the cells to see the impact on battery performance and cell temperatures
Result:
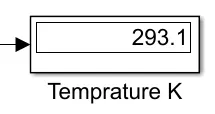
At 293.1k
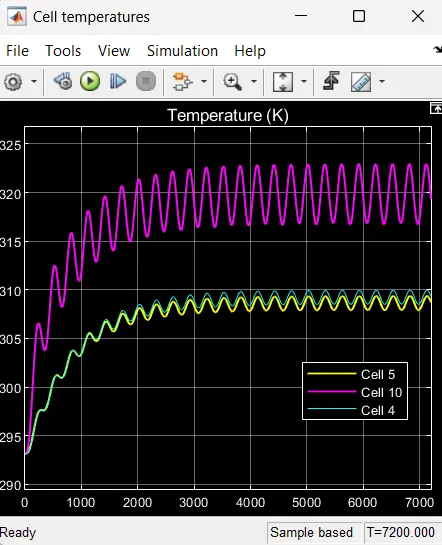
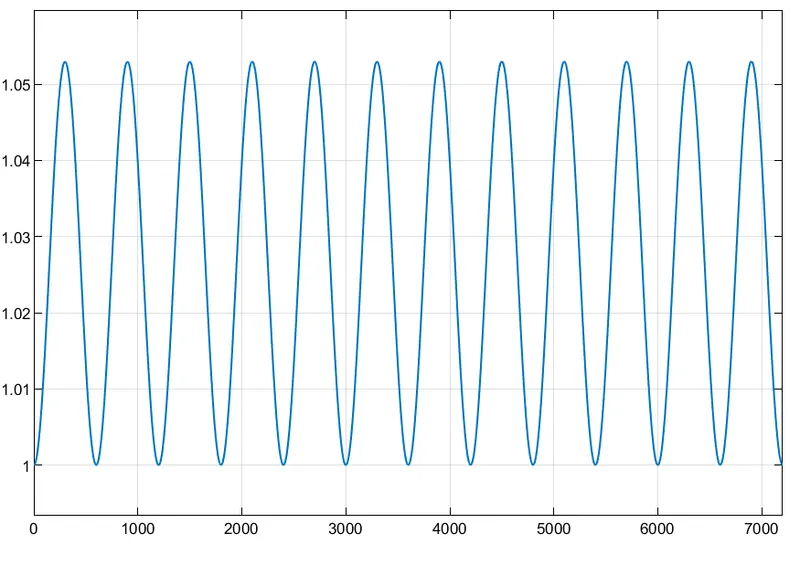
At 300k
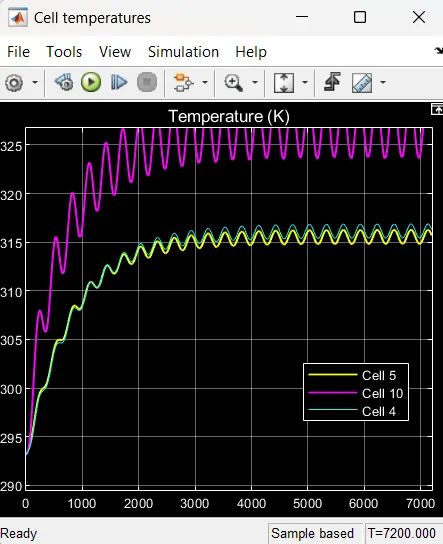
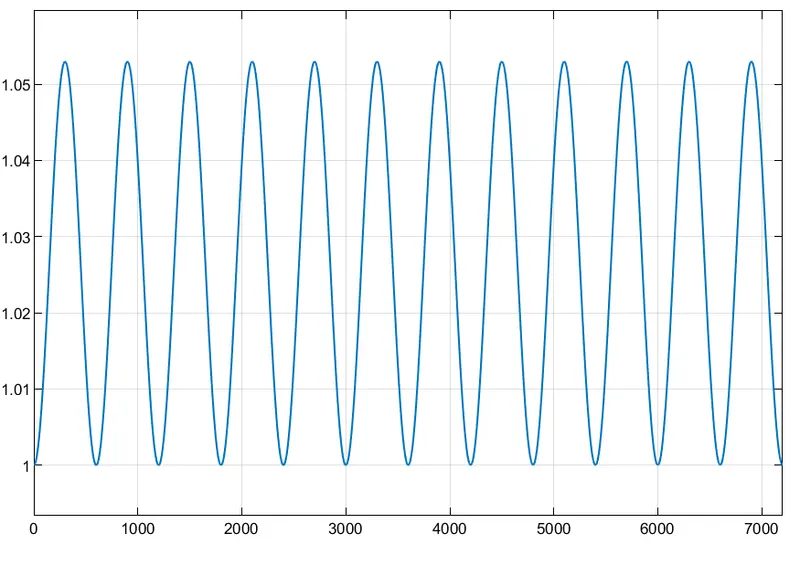
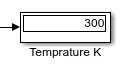
- we applied different temperatures of 293.1K and 300K.
- we found the variation in temperature of faulty cell with the remaining cells, and the charging and discharging curve of the battery pack.
- There is not much difference in the no. of cycles at each temperature.
- There is a 7.5K temperature difference is there between healthy and faulty cell temperatures.
- As charging and discharging go on the temperature of the overall battery pack is increasing over time.
- if we increase the temperature source value the rate of increase of temperature is also raised.
Conclusion:
We simulated the thermal effect and compared at various temperature ,faulty cell temp rise more than normal cell charge and discharge cycle given and due to temp rise it can damage the cell and reduce the performance of the battery.