Project 2 Thermal modeling of battery pack
For a 10 cell series lithium ion battery model, simulate the thermal effects and compare life cycle performance at various temperatures, charge & discharge rates using MATLAB.
Ans:
A)Using Table based battery:
Simulink model:
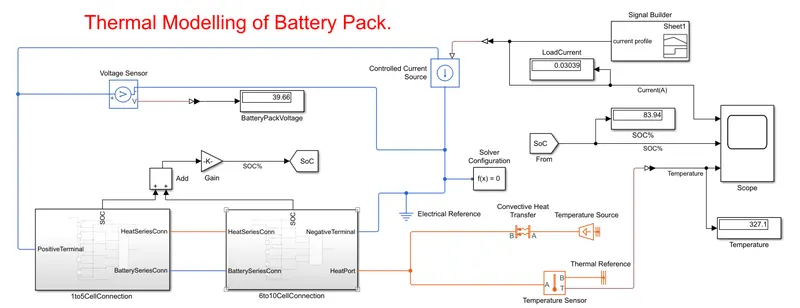
The above fig shows the 10 cell series lithium ion battery model.These are all battery cells connected in series.This battery pack charges and discharges by using the controlled current source and UDDS current profile from Signal builder block. For this cell enables the temperature effect option for observing and estimating the temperature effect signal effects. So in this model we estimate the SOC of the battery pack,battery pack temperature i.e. ambient temperature, battery pack current by using Scope connected to the battery pack. So, ambient temperature & SOC of the cell is similar to other cells.The battery pack voltage is calculated by using a voltage sensor block is connected across the battery pack terminals, first cell positive terminal connected to the positive terminal of voltage measurement block and last cell negative terminal connected to negative terminal of voltage sensor block.The temperature source is connected across the battery pack through convective Heat Transfer to change it's ambient temperature for observing behaviour of battery pack at different temperature.
Main blocks:
- Signal builder
- Controlled Current Source
- Battery
- Conductive Heat transfer
- Convective Heat Transfer
- Temaparature sensor
- Temparature source
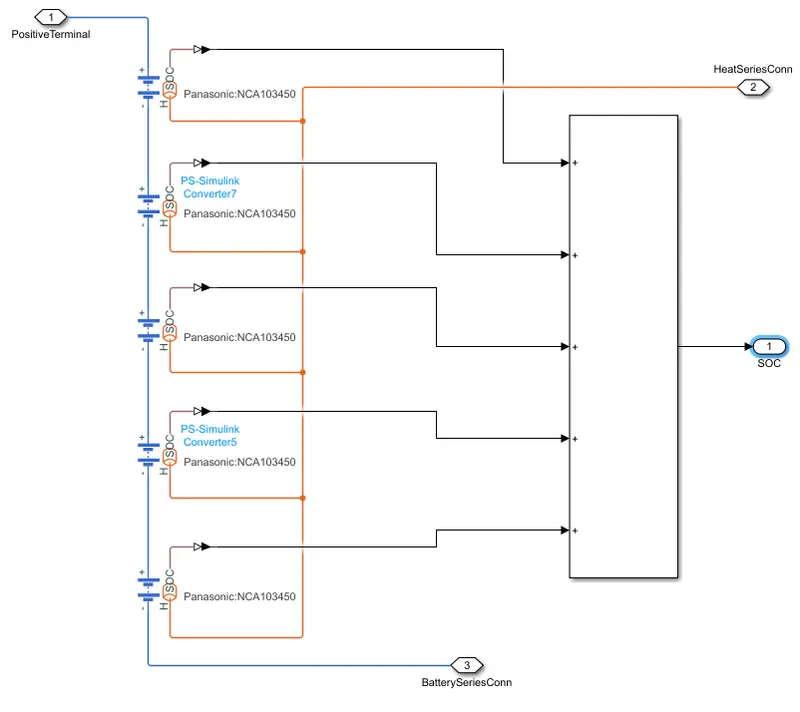
In this model to reduce the complexsity we have divided the 10cells in to two modules, each module contain the five cells as connected in the series. One module as the one subsystem.
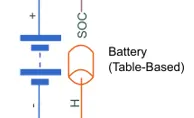
Battery(Table based):The Battery (Table-Based) block represents a high-fidelity battery model. The block calculates no-load voltage as a function of charge level and optional temperature using lookup tables and includes several modeling options:
- Self-discharge
- Battery fade
- Charge dynamics
- Calendar aging
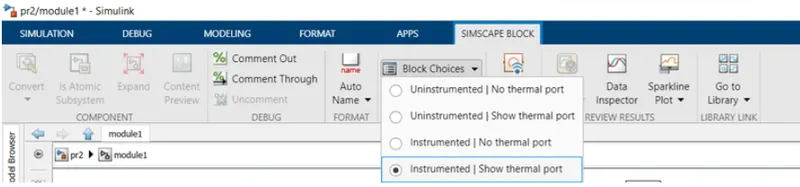
The Battery (Table-Based) block has four modeling variants, accessible by right-clicking the block in your block diagram and then selecting the appropriate option from the context menu, under Simscape > Block choices:
Uninstrumented | No thermal port: Basic model that does not output battery charge level and simulates at a fixed temperature. This modeling variant is the default.
Uninstrumented | Show thermal port: Model with exposed thermal port. This model does not output internal charge level of the battery.
Instrumented | No thermal port: Model with exposed charge output port. This model uses a fixed temperature throughout the simulation.
Instrumented | Show thermal port: Model that lets you output internal charge level of the battery. Both the thermal port and the charge output port are exposed.
The instrumented variants have an extra physical signal port that outputs the internal state of charge. Use this functionality to change load behavior as a function of state of charge, without the complexity of building a charge state estimator.
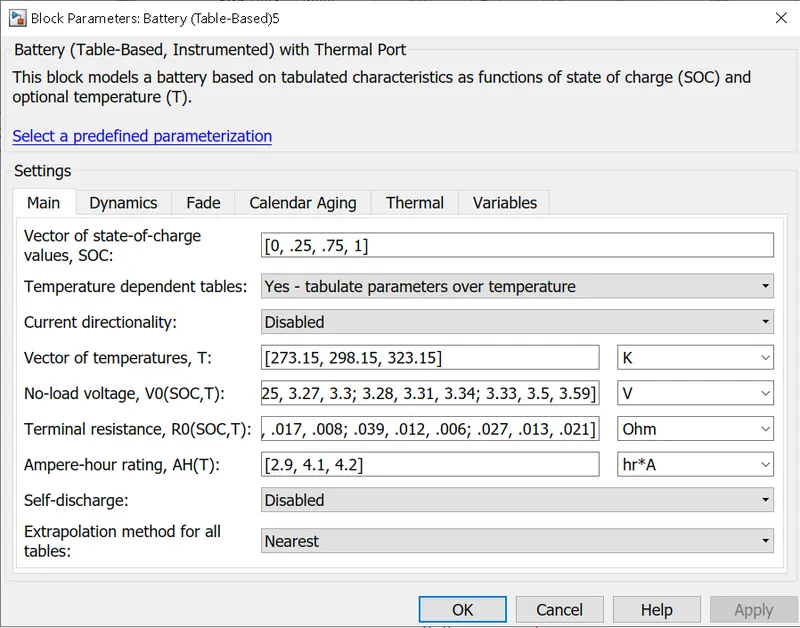
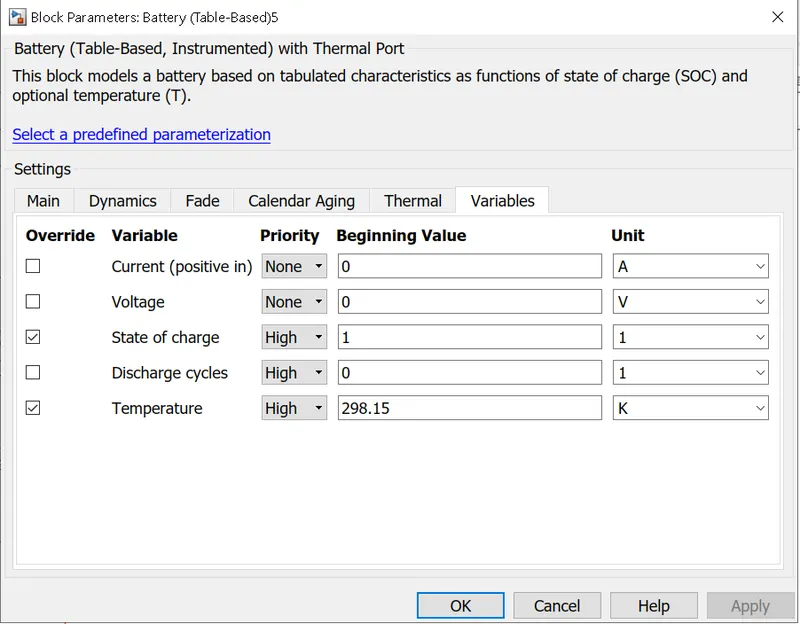
This block represented the charaterisiocs of the SOC and Optimal temparature. In this SOC port is enabled using the Simscape block window. as shown as the below:
SOC port enabled,
Block parameter:
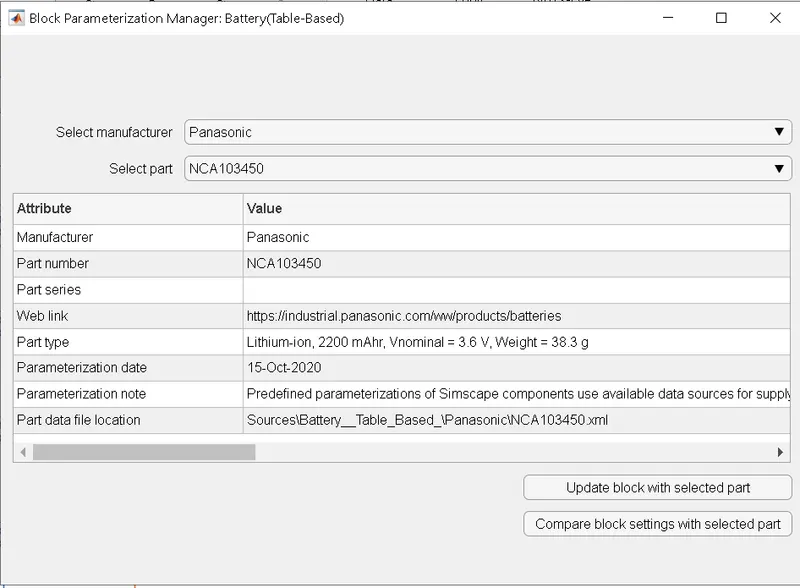
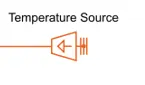
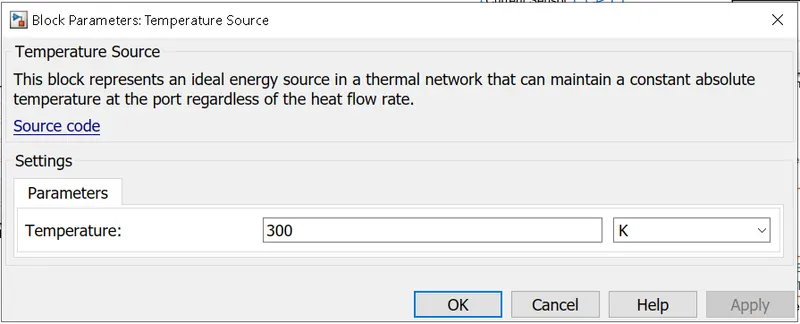
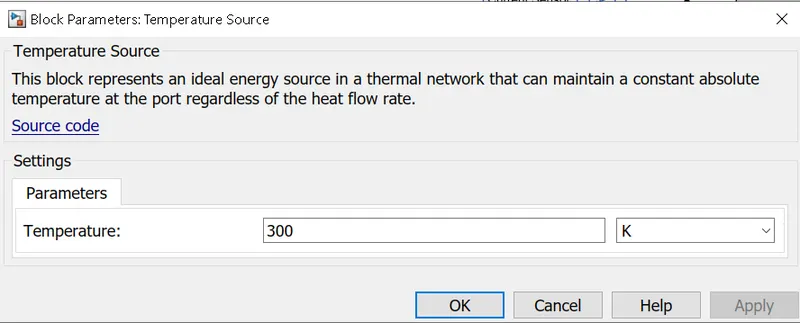
Temperature Source: The Temperature Source block represents an ideal source of thermal energy that is powerful enough to maintain specified temperature at its outlet regardless of the heat flow consumed by the system.
Block parameter: The source generates constant absolute temperature, defined by the Temperature parameter value.
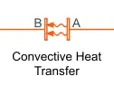
Convective Heat Transfer: The Convective Heat Transfer block represents a heat transfer by convection between two bodies by means of fluid motion.
The transfer is governed by the Newton law of cooling and is described with the following equation:
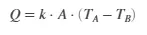
where,
Q Heat flow,
k Convection heat transfer coefficient,
A Surface area,
TA,TB Temperatures of the bodies,
Connections A and B are thermal conserving ports associated with the points between which the heat transfer by convection takes place. The block positive direction is from port A to port B. This means that the heat flow is positive if it flows from A to B.
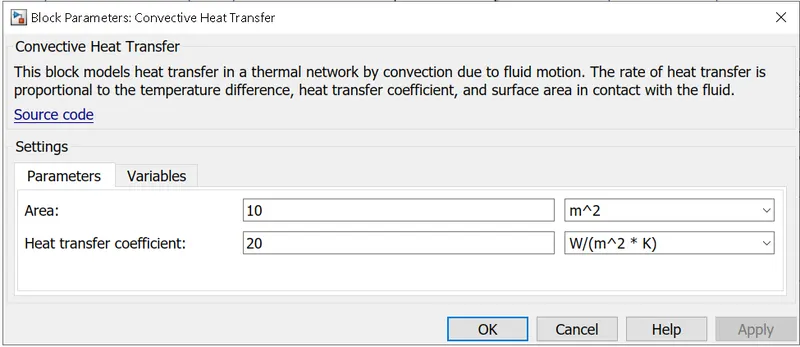
Block parameter:
Temperature Sensor:The Temperature Sensor block represents an ideal temperature sensor, that is, a device that determines the temperature differential measured between two points without drawing any heat.
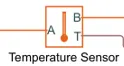
Connections A and B are thermal conserving ports that connect to the two points where temperature is being monitored. Port T is a physical signal port that outputs the temperature differential value.
The block positive direction is from port A to port B. The measured temperature is determined as T = TA – TB.
The block has the following ports:
- A: Thermal conserving port associated with the sensor positive probe.
- B: Thermal conserving port associated with the sensor negative probe.
- T: Physical signal output port for temperature.
Controlled Current Source: The block represents an ideal current source that is powerful enough to maintain the specified current through it regardless of the voltage across it. The output current is I = Is, where Is is the numerical value presented at the physical signal port.
Signal Builder:The Signal Builder block allows you to create interchangeable groups of piecewise linear signal sources and use them in a model. You can quickly switch the signal groups into and out of a model to facilitate testing. In the Signal Builder window, create signals and define the output waveforms.
Block parameter:
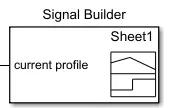
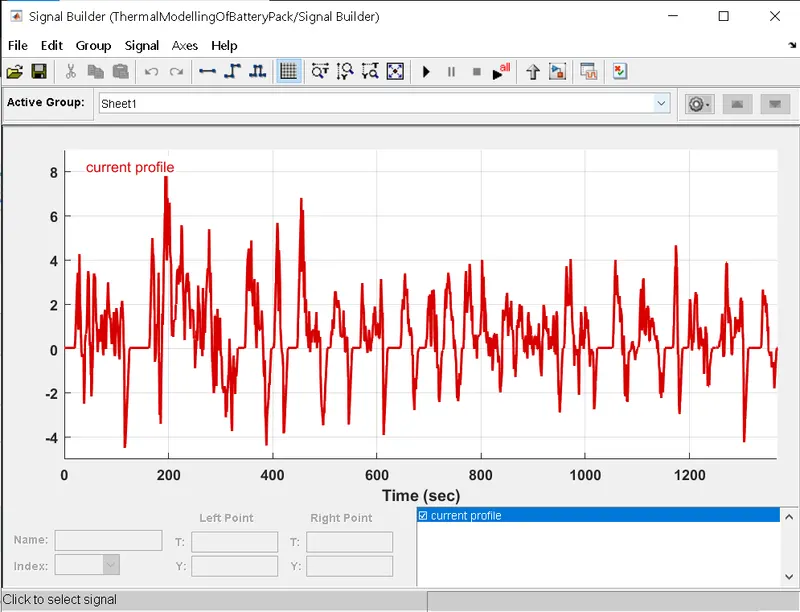
In vehicle current requirement subsystem block,the signal builder block used to apply UDDS current profile and simulink-ps converter block used to convert the simulink signal to physical signal.connectin port block used to output the signal.
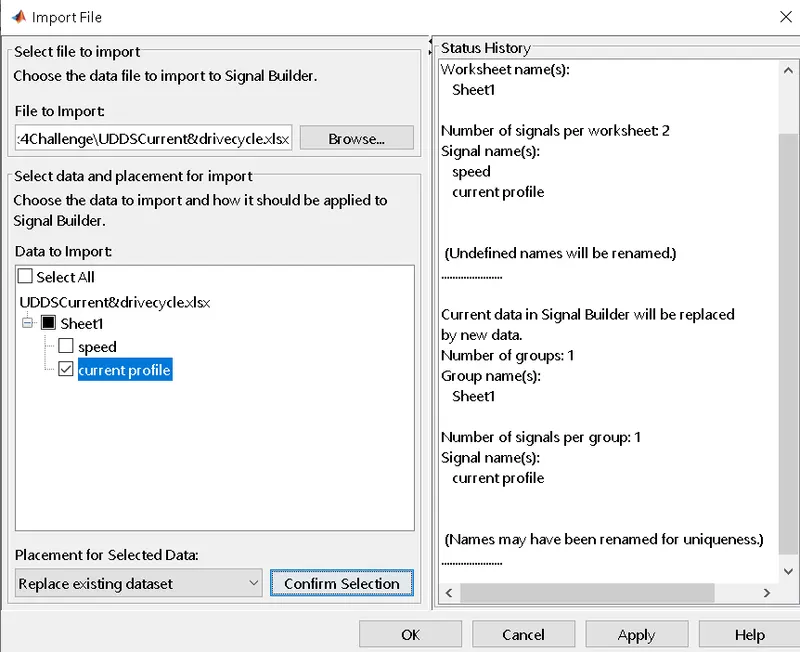
File imported to signal builder:
Thermal Reference: This block represents a reference point in a thermal network where the temperature is equal to absolute zero.
Electrical Reference: Electrical reference port. A model must contain at least one electrical reference port (electrical ground).

Solver configuration: Defines solver settings to use for simulation.
Observation/Results:
In this model we are testing the series batteries with the constant discharge current on different operating temperatures & Constant Convective heat transfer area i.e. 10m^2.
Case 1: Ambient temperature :300K and Charge-Discharge rate: Constant.
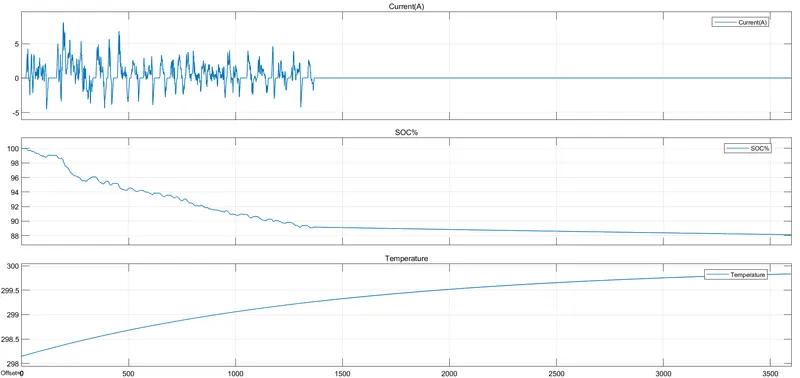
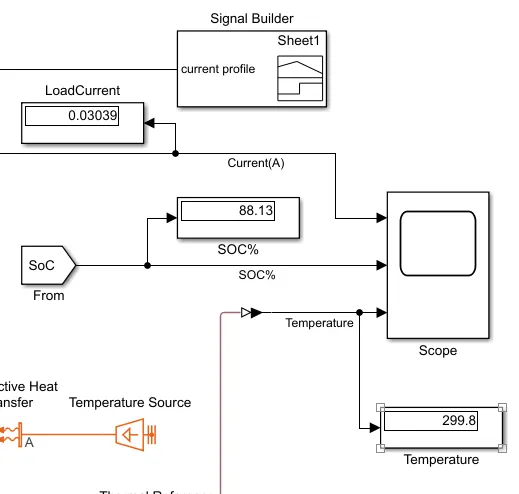
The above figure shows the results, in this case ambient temperature is similar to the battery pack ambient temperature and similarly the charge-discharge current is also similar to cell maximum current capacity i.e, cell's charge-discharge at constant rate. From figure it is observed that as temperature increases the SOC of the battery decreases.At the end of Simulation the SOC is to be found out 88.13% & ambient temperaure of a battery pack 299.8 K.
Case 2: Ambient temperature :330K and Charge-Discharge rate: Constant.
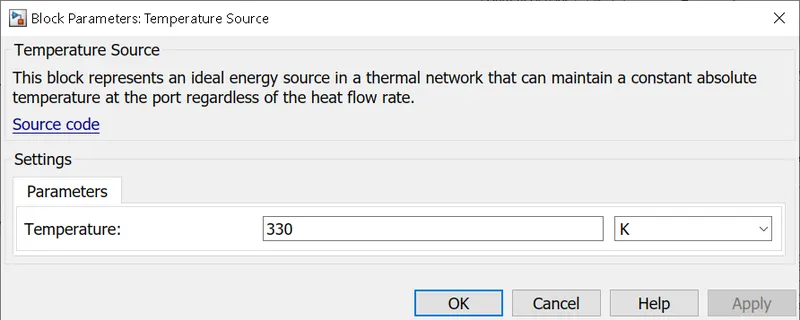
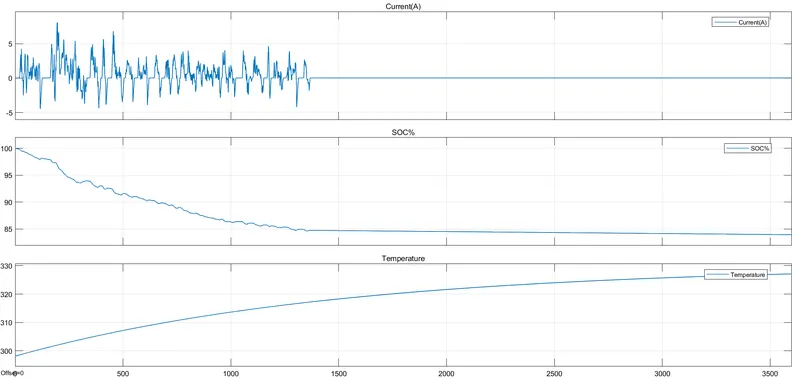
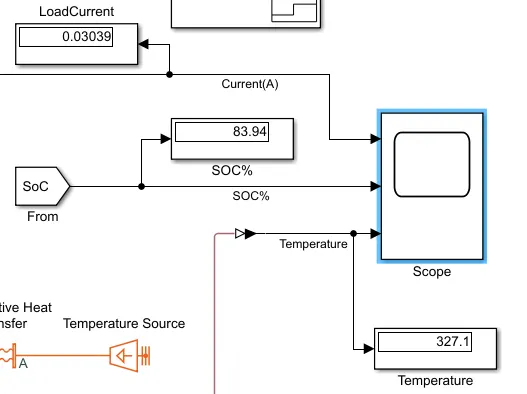
The above figure shows the results, in this case ambient temperature is similar to the battery pack ambient temperature and similarly the charge-discharge current is also similar to cell maximum current capacity i.e, cell's charge-discharge at constant rate. From figure it is observed that as temperature increases the SOC of the battery decreases.At the end of Simulation the SOC is to be found out 83.94% & ambient temperaure of a battery pack 327.1 K.
Conclusion:As we can see that with the rise in temperature the SOC decreases which means that if we operate the battery at a high temperature than the rated temperature then the battery will discharge fast and the life of the battery will decrease accordingly.By comparing both the case result we can conclude that the SOC of the system decreases when increase in the temperature of battery & to avoid the decrease in an effeciencyof battery, Battery thermal management system(BTMS) is implemented in order to maintain good state of charge.
Limitations: In this Table based battery model, we would not get age or lifecycle of battery pack, So, for finding age & lifecycle of battery pack we need "Generic battery model".This model is best suited for studying thermal effect on SOC of a battery pack.
B)Using Generic Battery Model:
Simulink Model:
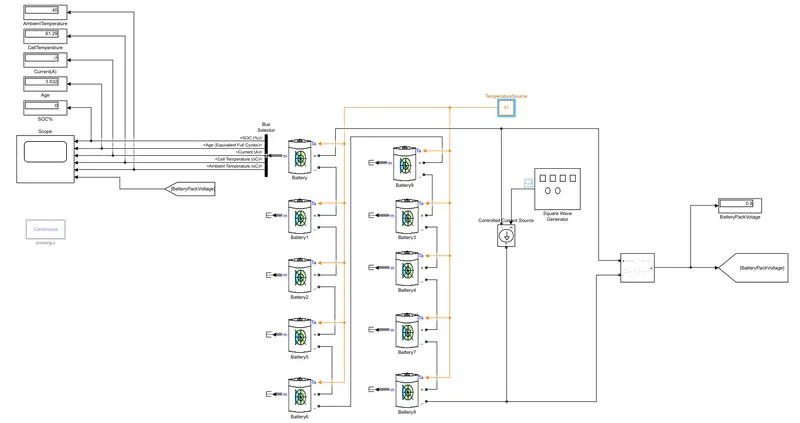
1P10SConfiguration.
The above fig shows the 1P10S configuration of the lithium-ion battery pack.These are all battery cells connected in series.This battery pack charges and discharges by using the controlled current source and square wave generator. For this cell enables the temperature effect and aging effect option for observing and estimating the temperature effect signal effects.So in this model, we estimate the age of the cell,SOC of the battery pack,battery pack temperature,ambient temperature,battery pack current by using a bus selector from any one cell of the battery pack,because this battery pack is made from connecting from the cells in series. So, current, temperature, SOC & age of the cell is similar to other cells.The battery pack voltage is calculated by using a voltage measurement block is connected across the battery pack terminals, first cell positive terminal connected to the positive terminal of voltage measurement block and last cell negative terminal connected to negative terminal of voltage measurement block.Also by using constant blocks named as temperature source,it provides ambient temperature to the cells connected.
Block used in the models & their parameter:
Signal generator: The Signal Generator block can produce one of four different waveforms:
-
Sine
-
Square
-
Sawtooth
-
random
.We can express signal parameters in hertz or radian/sec.

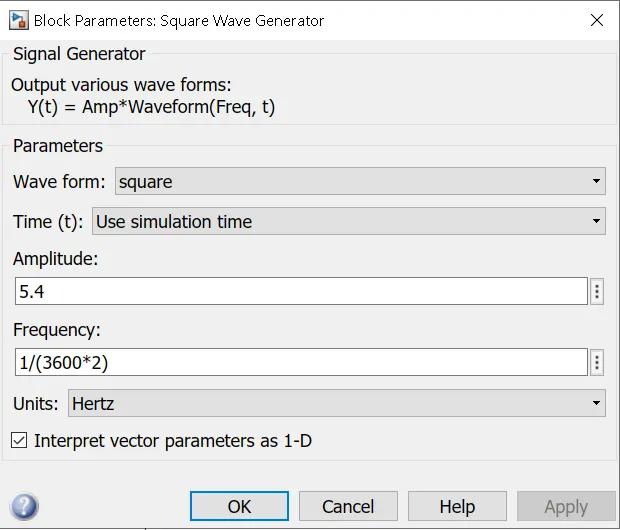
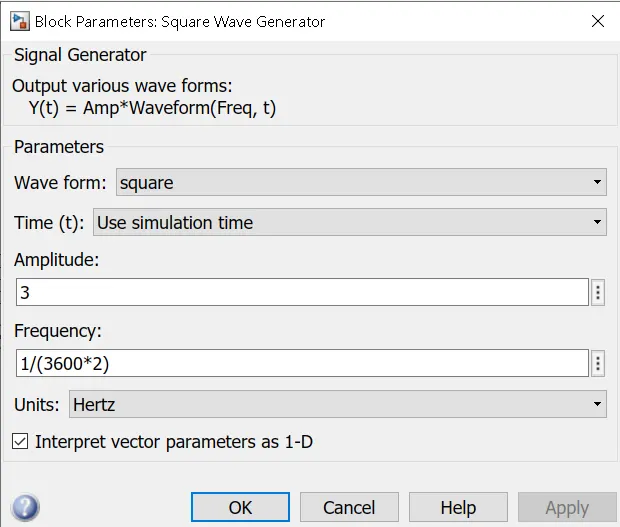
For this model I used square waveform with -Ia variable as amplitude and 1/(2*3600) Hz frequency.This signal is provided to the current controlled source.
Block parameter:
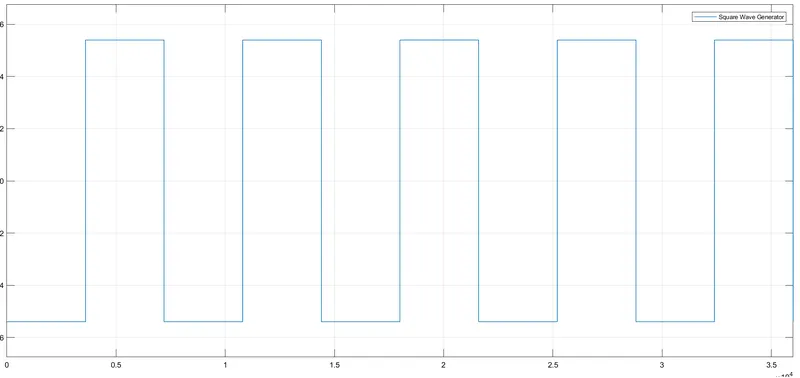
Controlled Current Source:The Controlled Current Source block converts the Simulink input signal into an equivalent current source. The generated current is driven by the input signal of the block. The positive current direction is as shown by the arrow in the block icon.
We can initialize the Controlled Current Source block with a specific AC or DC current. If you want to start the simulation in steady state, the block input must be connected to a signal starting as a sinusoidal or DC waveform corresponding to the initial values
Generic Battery: Implements a generic battery model for most popular battery types. Temperature and aging (due to cycling) effects can be specified for Lithium-Ion battery type.
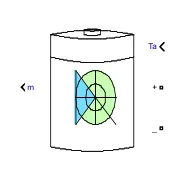
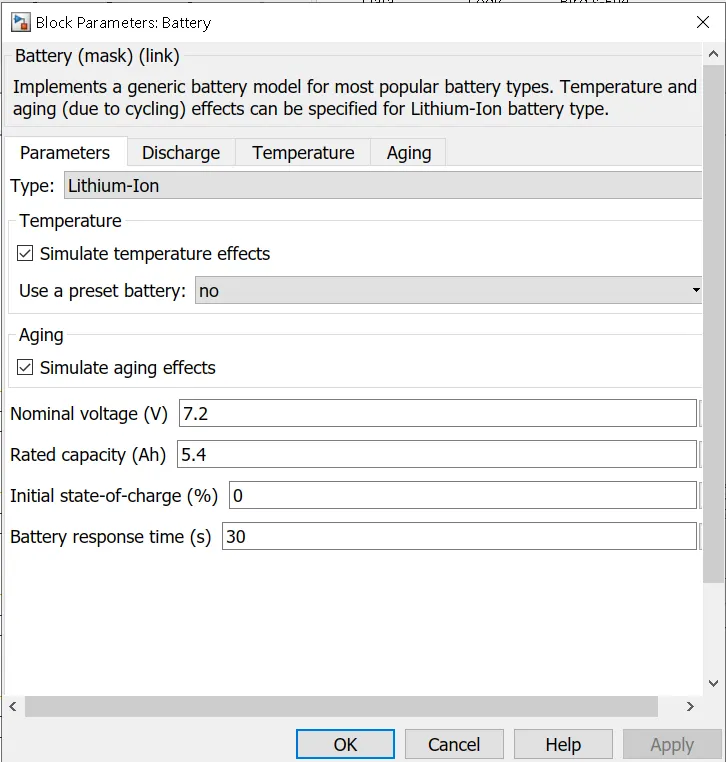
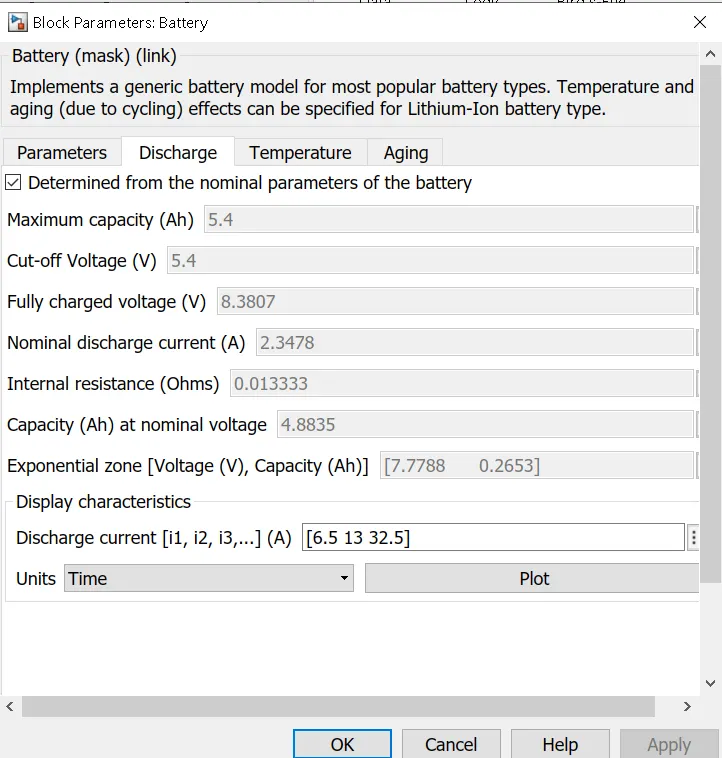
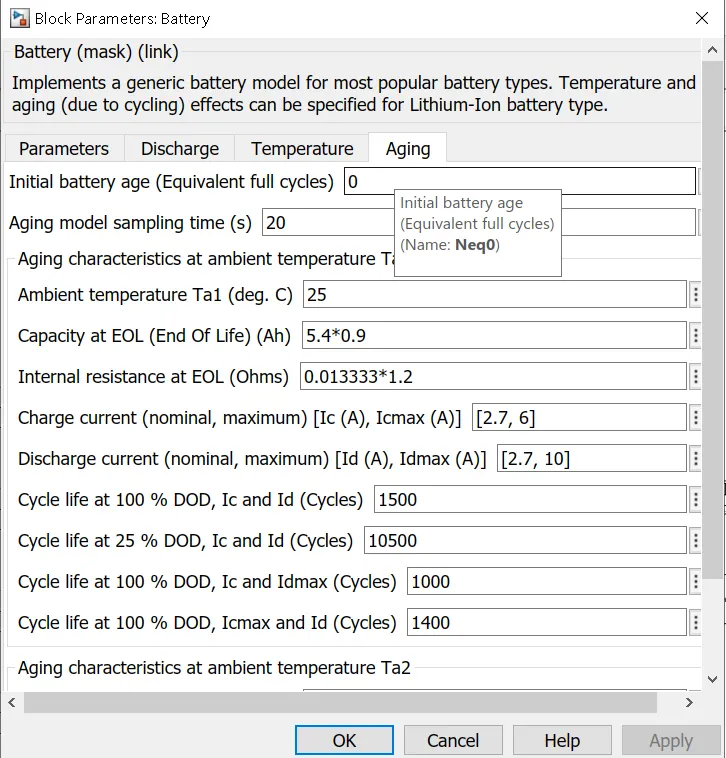
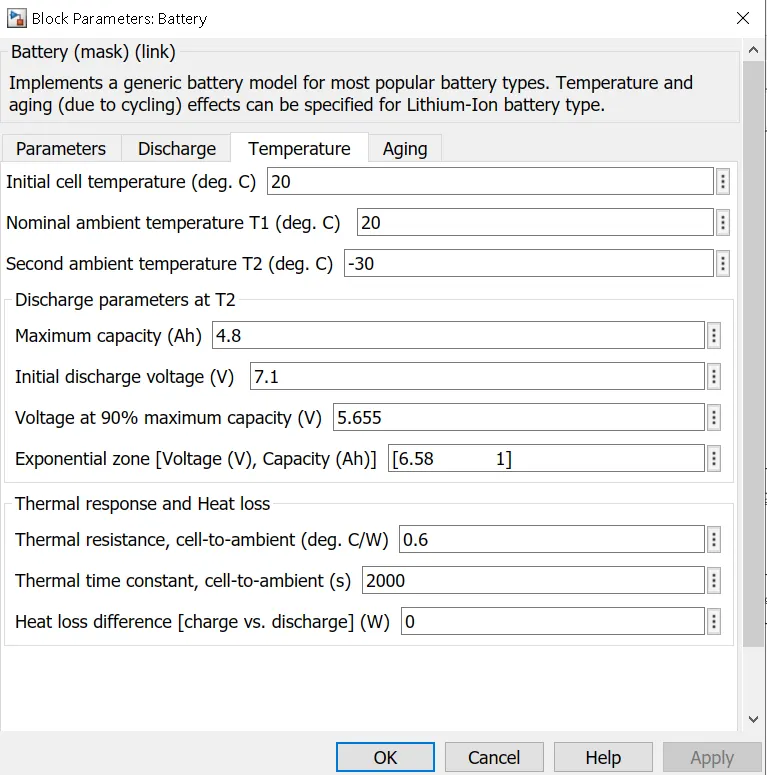
Block parameter:
Powergui:The powergui block allows you to choose one of these methods to solve your circuit:
-
Continuous, which uses a variable-step solver from Simulink®
-
Discretization of the electrical system for a solution at fixed time steps
-
Continuous or discrete phasor solution
The powergui block also opens tools for steady-state and simulation results analysis and for advanced parameter design.
Voltage Measurement: This block represents voltage measurement used to measure the voltage across the connected terminals.

Bus selector: Bus selector block is used to split vector signals into scalars or smaller vectors. Check 'Bus Selection Mode' to split bus signals.

Scope: It is used to plot the obtained results with respect to the simulation time.

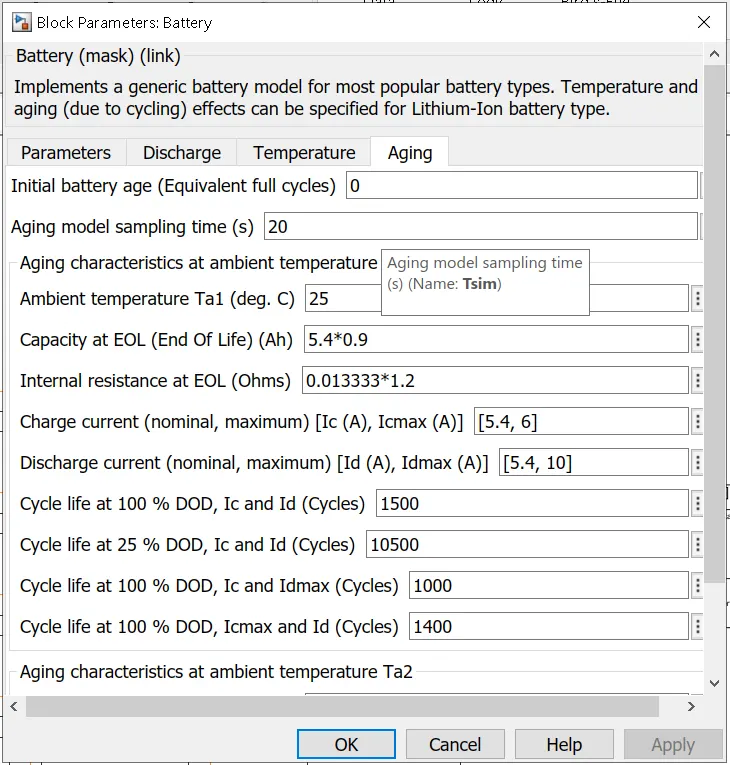
Model Details: The battery block implements a generic dynamic model that represents most popular types of rechargable batteries.For this model enables the temperature effects and aging effects options.So cell nominal voltage 3.6 V,Capacity 5.4 Ah,initial SOC 0%,in aging section aging model aging sample time is 20 sec,aging characteristics at cell ambient temperature of the cell 27℃ and nominal charge and discharge currents take as Ia variable(we take variable because every simulating time with different current value,it tedious process to change the all cell charge-discharge) which is similar to the input current signal.And all other parameters are default values.So,now our battery pack voltage is 93.75V and capacity is 5.4 Ah.
So, all these blocks are connected as per shown in the above model figure.And this model runs for 10 hours,so we can charge and discharge the battery pack multiple times.
Observations/Result: So,this simulation model simulates multiple times at various different ambient temperatures and different charge-discharge current rate.The ambient temperature varies by changing the ambient temperature constant block (named as 'Temperature source') & charge-discharge current value.
Case 1:- Ambient temperature :27℃ and Charge-Discharge rate: 5.4 Ah.
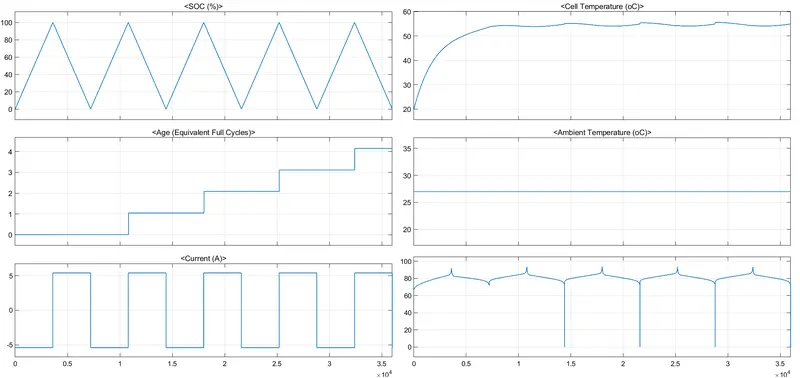
The above figure shows the results, in this case ambient temperature is similar to the battery pack ambient temperature and similarly the charge-discharge current is also similar to cell maximum current capacity i.e, cell's charge-discharge at 1C rate.Therefore the battery pack SOC completely reduces or packs full charge within 1 hour. Thus in 2 hours the battery pack completed 1 life cycle and if we see in the age plot, the age of the battery pack increases exactely by 1 age,it is because the ambient temperature and aging characteristics at cell the ambient temperature is same.So,in the 10 hours,the battery pack uses approx.4 (i.e. 4.15) life cycles and the age of the battery pack increases upto 4. If we observe the cell tempearture at starting it gradually increases and get it peak value of 55.55℃ and fluctuates within the 52.19 - 55.55℃. When the battery starts charging, temperature starts increasing upto 55.55℃ and when battery starts discharging,temperature starts reducing upto 54.21℃.
Case 2:- Ambient temperature: 45℃ and Charge-Discharge Current: 5.4 Ah.
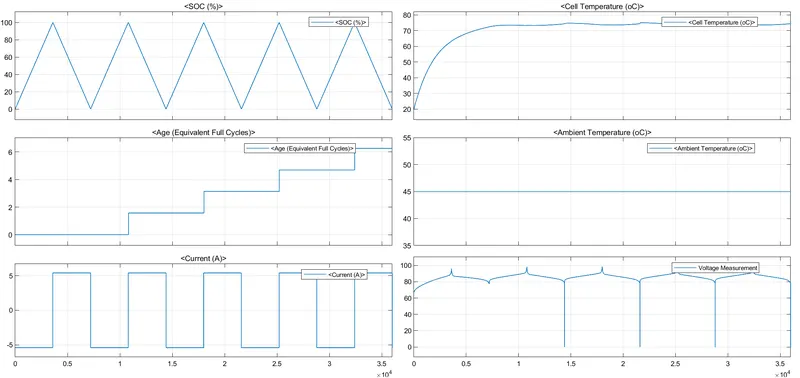
In this case, we change the ambient temperature to 45℃ and charge-discharge C rate keeps the same i.e, 1C. Due to this reason battery pack SOC and voltage is same but this ambient tempearture adverse effect replicates in the age of cycle and ofcourcde cell temperature also increases. In 2 hours the battery uses 1 life cycle but at the same time the age of the battery increases approximately 1.56 instead of 1.After completing the 6 life cycle,the battery age is approximately 6.25 and the cell temperature reaches 75.27℃ at peak.
Case 3:- Ambient temperature :27℃ and Charge-Discharge rate: 3Ah.
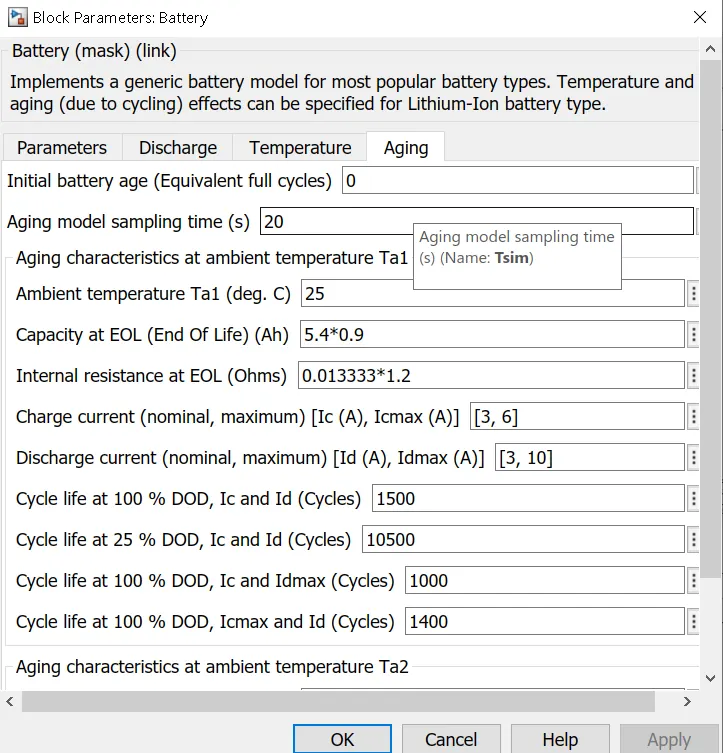
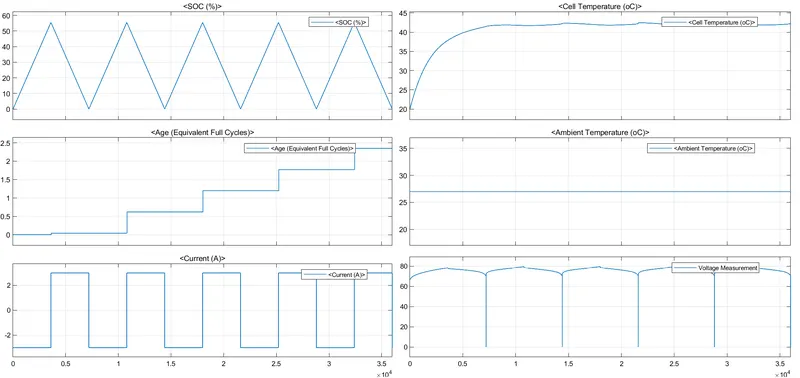
In this model the ambient temperature is kept the same as like in case 1 and charge-discharge current is reduced to 3A i.e,0.56C rate.Due to the reduction in the C rate,now our battery does not discharge beyond 55.55%. Because of this reason,the voltage of the battery pack plots also changes after completing the two hours in simulation, the age of the battery is 2.35 i.e 0.5 times the case 1.In this case charge-discharge rate decreases,therefore cell temperature is also less i.e, 42.54℃ as compared to case 1.
Case 4:- Ambient temperature :45℃ and Charge-Discharge rate: 3Ah.
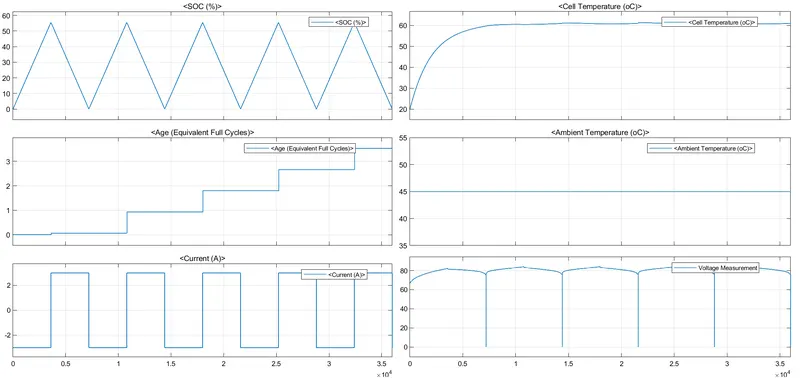
This case is different from other cases because in this case we changed both the parameters.The ambient temperature is 45℃ and charge-discharge current is 3 Ah i.e, 0.56 C rate.Because our C-rate is lower than the 1C, So, our battery pack does not charge beyond 55.55%.Therefore age of a battery becomes 3.532 i.e. it completes approx.3 life cycle & 0.5 times case 2, & cell temperature attains peak of 61.42℃.
Conclusion: From above case studies we conclude that,
- When we increase the ambient temperature then obviously cell temprerature increased also this ambient temperature adverse effect reflects on the age of the battery pack and vice versa.
- Similarly when we decrease C rate then shows the favourable and unfavourable effects on the age, SOC, temperature and voltage of the battery pack.