Project 2 Thermal modeling of battery pack
Introduction :-
The Lithium-ion batteries are widely used as energy sources in different hybrid systems, however, the operation characteristics of the battery in such systems are strongly dependent on the operation temperature and therefore, with purpose to improve these characteristics a good thermal control system should be utilized. The modelling thermal management system for the battery pack in Hybrid Electric Vehicles (HEVs), which gives opportunity to control the operation temperature of the pack for different load cycles and ambient temperatures.
Simulink model for battery pack thermal effect :-
In this project, the requirement that we need to simulate the thermal effect and life cycle performance of lithium ion battery pack at various temperature , charge , discharge rate. Following are the model of lithium ion battery pack with fault :-
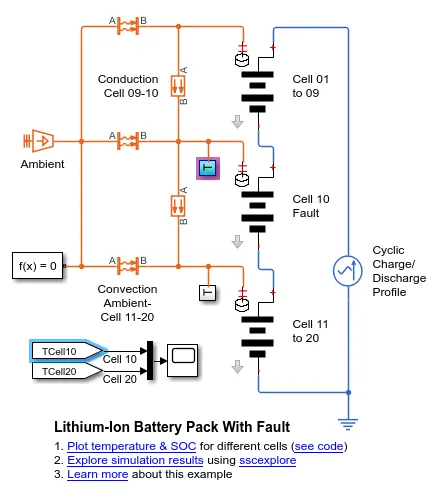
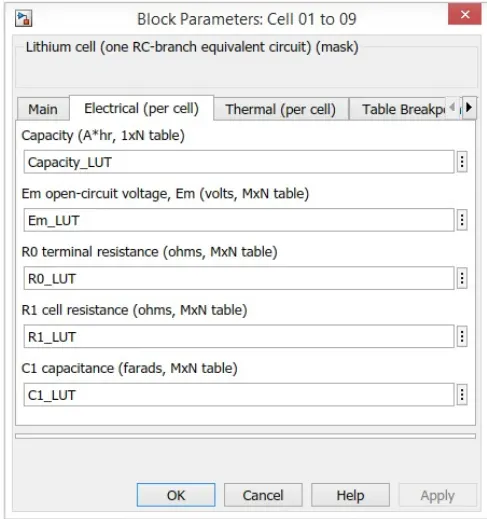
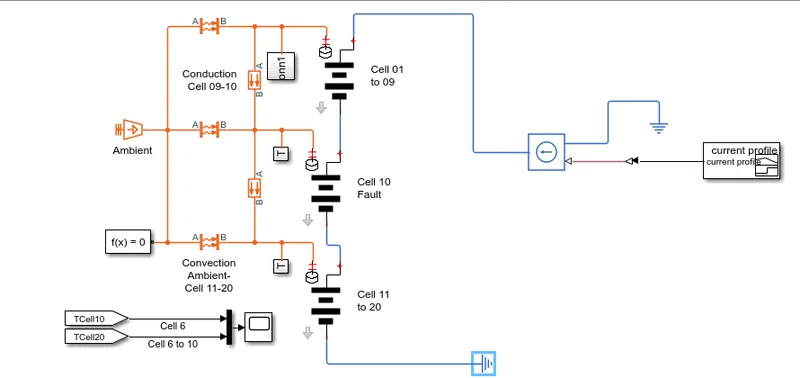
In these model, the 3 battery pack connect in series. The first pack of battery contain cell 01 to cell 09 it means pack having 9 cell connect in series and third pack contain cell 11 to cell 20 it means it having 10 cell connect in series.The second pack contain cell 10 which is at fault condition bacause of thermal effect from system. the electrical parameter of first and third battery pack are set such as its capacity,open ckt voltage, cell resistance, capacitance shown in below :-
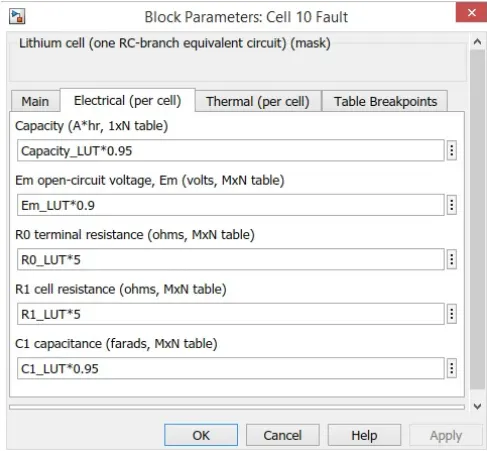
The second pack having at fault so it having reduce electrical parameter such as capacity ,open ckt voltage and capacitance and increases the terminal resistance and cell resistence which shown in following:-
In these model , the different block are used suh as ( temperature source , convection heat transfer , conduaction heat transfer ,temperature sensor , thermal referance , scope , bus selector , heat sensing subsystem ) :-
Temperature source:- These temperature source block are use to set the ambient temperature and it also allow to change the temperature. it provide the source of tempertaure to battery through convection and coduction process.

Convection heat transfer:- These is convection heat transfer plate which work on the convection process and transfer the ambient temperature to battery pack.

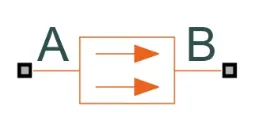
Conduction heat transfer:- It also the heat transfer plate by the conducting process. it conduct heat from temperature source to the battery packs.
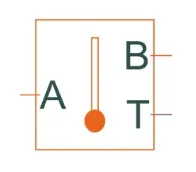
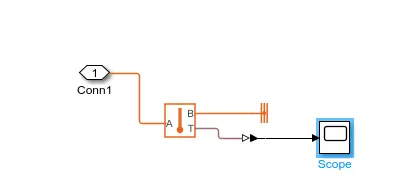
Temperature sensor:- In these simulation the second and third pack provide the their own subsystem to measure temperature. These subsystem include the temperature sensor block and thermal reference. Temperature sensor sense the temperature of pack with respect to thermal reference

Scope :- scope are use to display the graph of temperature across battery pack.

Mux Block :-

Temperature sensing subsystem:-

The cyclic charge and discharge current applies to battery pack at peak amplitude 50 and having frequency 1/100 act as a load to all battery pack system.
Modification in simulink model as per requirement :-
1) The simulink model modify as per requirement. In above model the first battery pack having 9 cell connect in series and second pack having 1 cell and thired pack having 10 cell but now we require the 10 cell in series so we need to modify that first pack having 5 cell in series from 1 to 5 and second pack having 6 cell and third pack having 4 cell in series from 6 to 10 . The naming of pack remain same becuse it affect the temperature and SOC graph
2) The second modification is build the temperature sensing model for first battery pack. the second and third pack temperature can be measure but i must want to check the cell temperature for first pack of battery. The model are build by the component such as temperature sensor , themal reference ,scope , simulink ps converter ) . These model is sensing temperature of first battery pack.
Cycle configuration:-
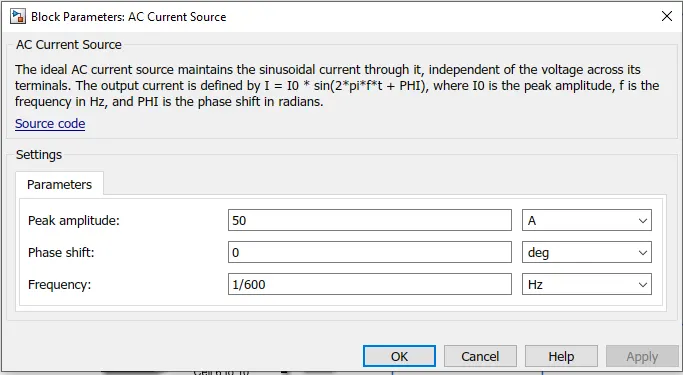
The battery pack with fault model but now with some modification. Now in these model having a load is in the form of an alternating current which is provided by the AC current source block.These load connect the positive terminal to battery pack and negative terminal to electrical referance. this load is cyclic charge and discharge the battery pack with particular frequency and charging discharging current .

This cyclic charge discharge current block parameter are set such as the frequency value is 1/600 Hz and the peak current is taken as 50 A and simulation time is taken as 7200 s.
Result:- The result of the cyclic charge and discharge load on the battery pack are shown below:-
Temperature at 300K:-
From above temperature vs time graph, We can see that there is gradual increase in the temperature of three packs. Initially the three pack start with same temperature at 300K. As we see the graph the second pack temperature after some seconds increases as compare to other first and third pack.The temperature of three pack increase in the fluctuating manner because of charging and discharging load. At 300 seconds :- The Third pack temperature is at 340 K and seconds pack at 392.5K. It means the temperature increase while the working battery pack. At 2000s :- The temperature of third pack about 365K and second pack is 435K. At 5000s:- the temperature of third pack is 365Kand temperature of second pack is 435K. In general increase in temperature of all three pack can be attribute to the continuous charging and discharging load. The second pak contain a fault cell,its temperature shoots up and remain at much higher level compare to other pack.
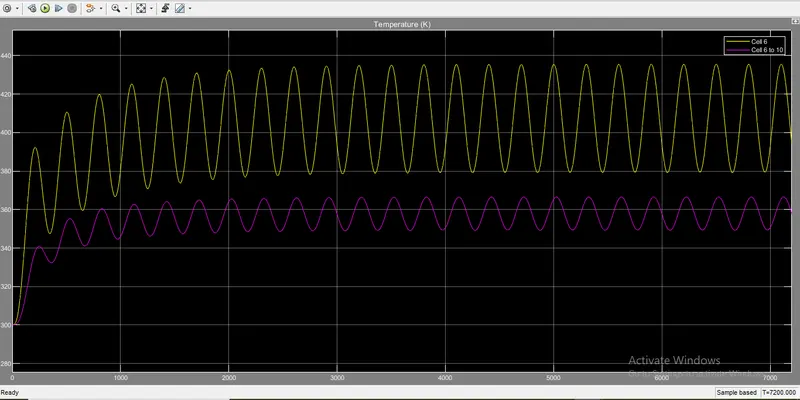 Temperature of first battery pack cell at 300 K:-
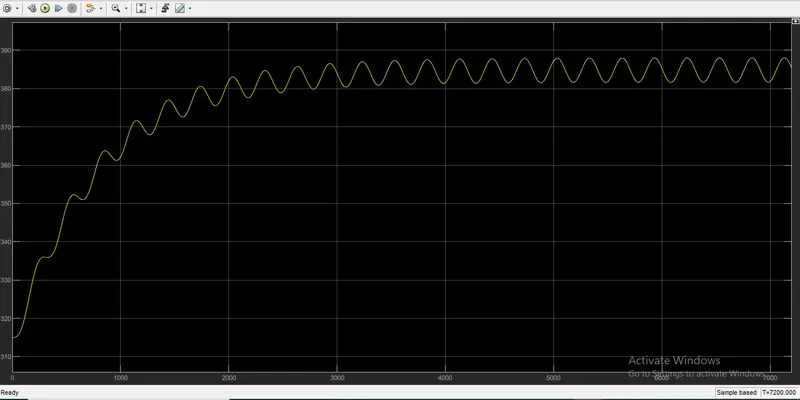
The temperature of first pack is start with 300 K. At 2000s:- the temperature of first pack is 369K these temperature is higher than that of third pack because the first pack having more cell than the third pack. 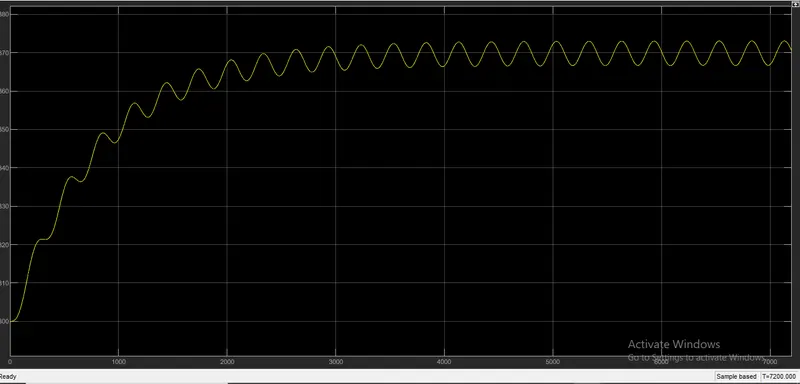 Temperature at 310 K:-
From above temperature vs time graph, We can see that same as the above case there is gradual increase in the temperature of three packs. Initially the three pack start with same temperature at 310K. As we see the graph the second pack temperature after some seconds increases as compare to other first and third pack.The temperature of three pack increase in the fluctuating manner because of charging and discharging load. At 300 seconds :- The Third pack temperature is at 350 K and seconds pack at 401.5K. It means the temperature increase while the working battery pack. At 2000s :- The temperature of third pack about 376.5K and second pack is 441K. At 5000s:- the temperature of third pack is 378Kand temperature of second pack is 443.6K. In general increase in temperature of all three pack can be attribute to the continuous charging and discharging load. The second pak contain a fault cell,its temperature shoots up and remain at much higher level compare to other pack. As compare to the above 300K , there is slight increase in temperature of each battery pack because while increase in ambient temperature then more heat transfer to cell in battery pack through conduction and convention plate. 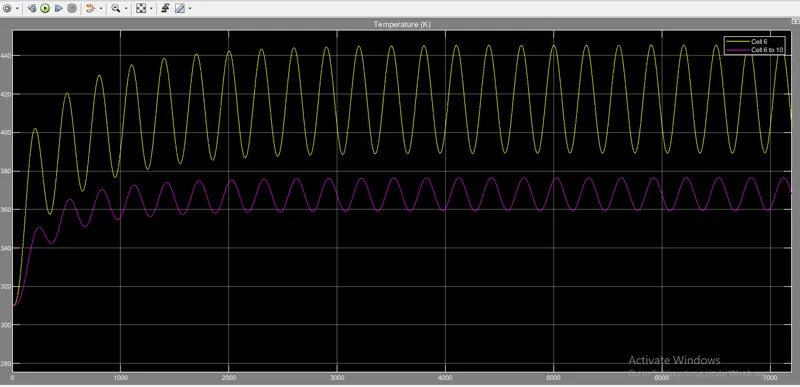
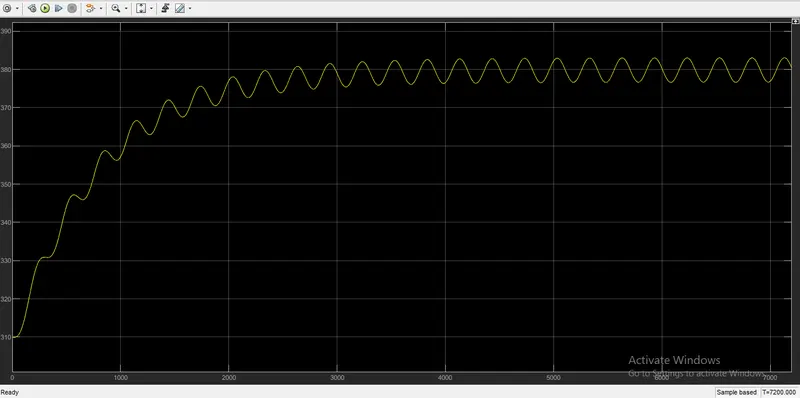
Temperature of first battery pack cell at 310K:-
The temperature of first pack is start with 310 K. At 2000s:- the temperature of first pack is 377.8K these temperature is higher than that of third pack because the first pack having more cell than the third pack. At 5000s:- the temperature is 382K.
Temperature at 315K:-
From above temperature vs time graph, We can see that same as the above case there is gradual increase in the temperature of three packs. Initially the three pack start with same temperature at 315K. As we see the graph the second pack temperature after some seconds increases as compare to other first and third pack.The temperature of three pack increase in the fluctuating manner because of charging and discharging load. At 300 seconds :- The Third pack temperature is at 357 K and seconds pack at 410.5K. It means the temperature increase while the working battery pack. At 2000s :- The temperature of third pack about 380K and second pack is 441K. At 5000s:- the temperature of third pack is 378Kand temperature of second pack is 445.6K. In general increase in temperature of all three pack can be attribute to the continuous charging and discharging load. The second pak contain a fault cell,its temperature shoots up and remain at much higher level compare to other pack. As compare to the above 310K , there is slight increase in temperature of each battery pack because while increase in ambient temperature then more heat transfer to cell in battery pack through conduction and convention plate.
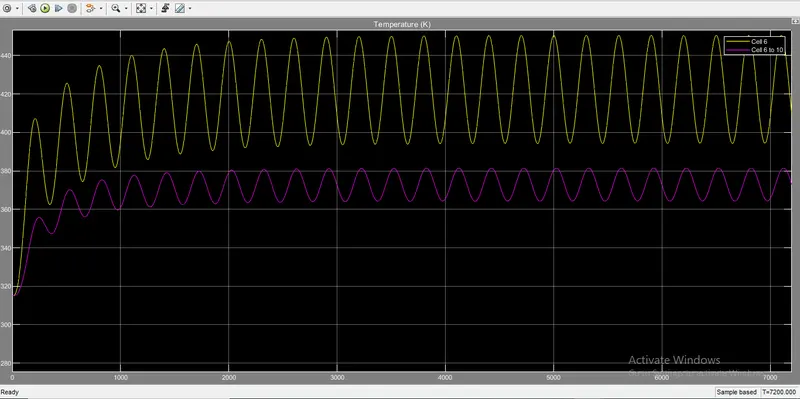
Temperature of first battery pack at 315K:-
The temperature of first pack is start with 315 K. At 2000s:- the temperature of first pack is 382K these temperature is higher than that of third pack because the first pack having more cell than the third pack. At 5000s:- the temperature is 388K.
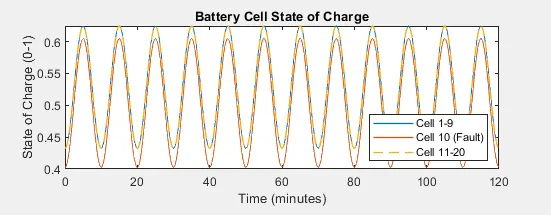
 State of charge :-
From th SOC result graph, we can see that the SOC can be accelerate from 40% to 65% through out the whole simulation period . The continuous decrease and increase in the SOC correspond to charge and discharge load provide by AC current source block. From SOC graph observation the cell 10 which is design to fault cell due to its reduce capacity , capacitance and open circuit voltage and increase in terminal and cell resistance. This causes the SOC of the second pack fall slightly greater than the other two pack.
Drive cycle configuration:-
In this configuration, i remove the AC current block which provide cyclic charge /discharge load to battery pack .Now instead of these i place the set of block for drie cycle load to applied battery pack.these block are as follows:- 1) Signal builder block
2) Controlled current source block
3) Simulink Ps converter block
4) Electrical reference block
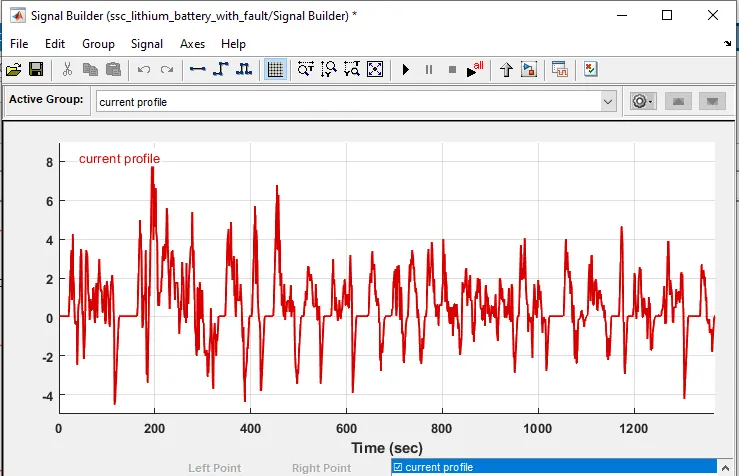
In signal builder block contain the drive cycle with the current profile. These signal builder block connected to the controlled current source through the simulink ps converter. The current signal is provide to the controlled current source and these source is connect to battery pack terminal and another terminal of battery connect to the electrical reference. From these manner apply the load to battery pack. The drive cycle plot image as shown below :-
The drive cycle configuration is shown in the image below:-
Result:-
Temperature at 300K:-From the temperature result, we can see that the three battery pack all start out with same initial temperature at 300. At 1125 s :- the temperature of second pack rises noticeably as compare to third pack. The temperature of third pack is below the range of temperature 300.02K and then rises to 300.08K and the second pack temperature is between 300.25K and then shoot up 300.40K. At 1215s :- The temperature of battery pack decrease. the second pack temperature 300.043K and then decrase upto 300.033K.Similarly the third pack temperature decrease 300.02 and decrase to 300.0018K. In general the vehicle accelerate rapidly and current having high value this reflect th temperature of second pack increases sharply and other two battery pack temperature increase but not more than second pack. 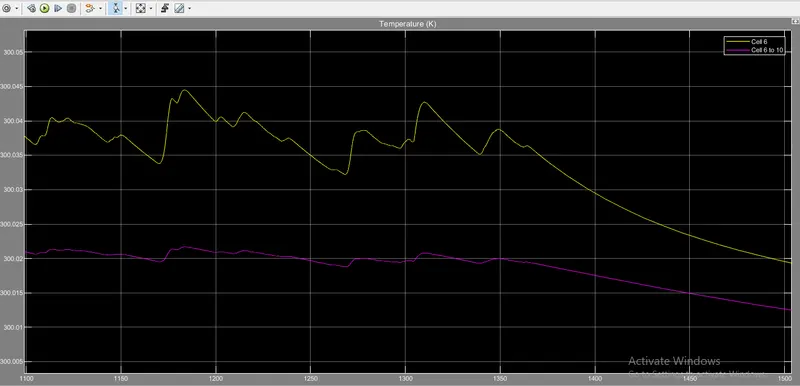
Temperature at 315K:-
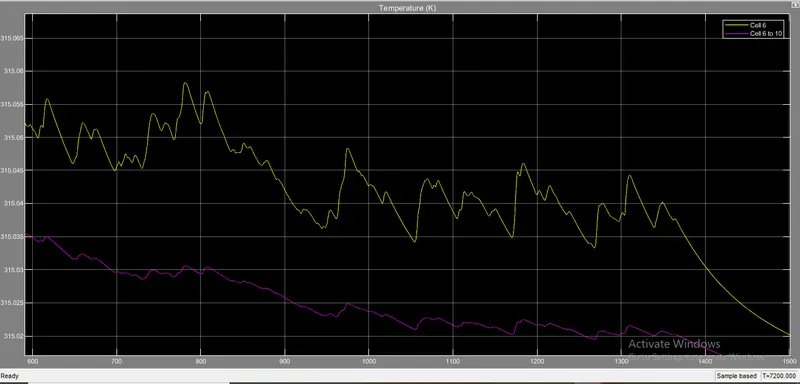
Temperature at 315K:-From the temperature result, we can see that the three battery pack all start out with same initial temperature at 315K. At 601 s :- the temperature of second pack rises noticeably as compare to third pack. The temperature of third pack is 315.030K and then rises to 315.035K and the second pack temperature is 315.05K and then shoot up 315.055K. After that the temperature start to decrease. the second pack temperature decrase from 315.055 to 315.0455K.and thirdpack temperature decrease 315.035 to 315.0325. At 802s :- The temperature of battery pack decrease. the second pack temperature at 315.0520K and then decrase upto 315.045K.Similarly the third pack temperature at 315.03K and decrase to 315.025K. In general the vehicle accelerate rapidly and current having high value this reflect th temperature of second pack increases sharply and other two battery pack temperature increase but not more than second pack. compare to ambient temperature 300K, the overall temperature of pack are higher at an ambient temperature 315K causing more heat transfer through conduction and convection plate to battery pack.
Temperature of first battery pack at 315 K:- The first battery pack temperature is higher because of it contain more cell that's why it generte more heat.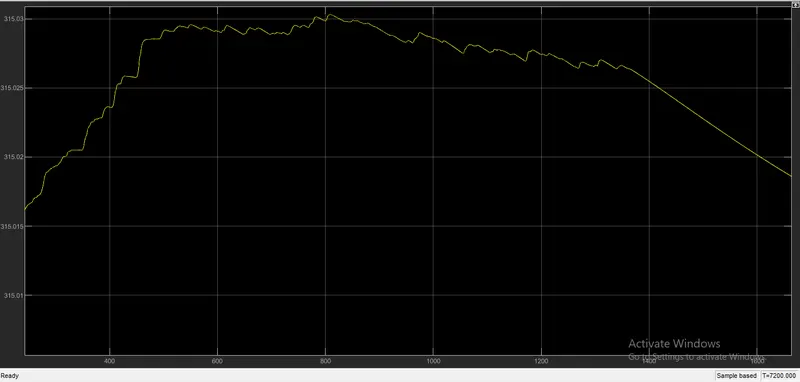 State of charge :-
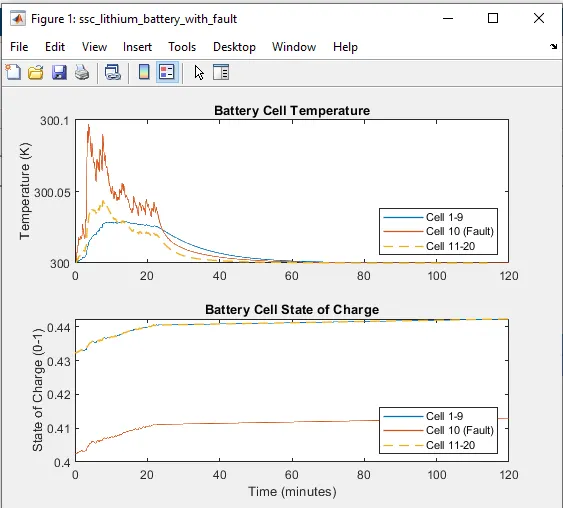
From the SOC graph, We can see that there is an increase the SOC. Initially , the second pack SOC start with 40.2% which is very low value as compare to other two pack. First and third pack start with 43.5%. At 20 min :-The SOC is start to increase upto the 20 min and after 20 min the SOC has constant level. The reduce capacitance and capacity and increase resistance causes the second pack get charged more quickly than the other two pack.
 Conculsion:-
In conculsion, the thermal modelling of a 10 cell series arrangement has been perform at different temperature level such as 300K , 310K ,315K for three charging and discharging condition. For each configuration , the load can be change AC current source and drive cycle load applied to battery pack. the temperature and state of charge of each pack at each ambient temperature level for each load application was plotted ,analyzed and explained.
- Liteyagami LiteyagamiCan you mail me the model details., mail id- [email protected]. Thank You