Project 2 Thermal modeling of battery pack
Objective:
For a 10 cell series lithium ion battery model, simulate the thermal effects and compare life cycle performance at various temperatures, charge & discharge rates using MATLAB.
Lithium-ion battery :Li-ion battery is a type of rechargeable battery composed of cells in which lithium ions move from the negative electrode through an electrolyte to the positive electrode during discharge and back when charging. Li-ion cells use an intercalted lithium compund as the material at the positive electrode and typically graphite at the negative electrode. Li-ion batteries have a high energy density, no memory effect and low self discharge. Cells can be manufactured to prioritize either energy or power density. They can however be a safety hazard since they contain flammable electrolytes and if damaged or incorrectly charged can lead to explosions and fires.
Lithium -ion battery pack with fault:
This example shows how to simulate a battery pack consisting of multiple series-connected cells in an efficient manner. It also shows how a fault can be introduced into one of the cells to see the impact on battery performance and cell temperatures. For efficiency, identical series-connected cells are not just simply modeled by connecting cell models in series. Instead a single cell is used, and the terminal voltage scaled up by the number of cells. The fault is represented by changing the parameters for the Cell 10 Fault subsystem, reducing both capacity and open-circuit voltage, and increasing the resistance values.
>Here it is an simulink model and now have modified some external factors to this system.
Modified Simulink Model:
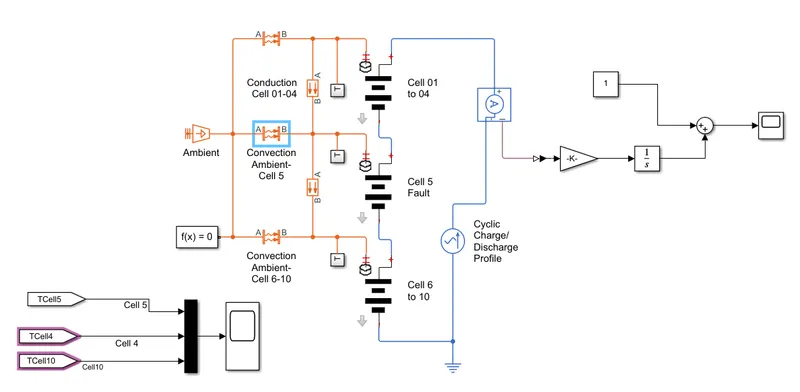
>Here we added the cell configuration from cell 1 to 4,cell 5,cell 6 to 10 fault.Soc simulation added with gain,integration blocks.
Descripition:
1.Temperature source:This block represents an ideal energy source in a thermal network that can maintain a constant absolute temperature at the port regardless of the heat flow rate
2.Covection Heat Transfer: This block models heat transfer in a thermal network by convection due to fluid motion. The rate of heat transfer is proportional to the temperature difference, heat transfer coefficient, and surface area in contact with the fluid.
>The Convective Heat Transfer block represents a heat transfer by convection between two bodies by means of fluid motion. The transfer is governed by the Newton law of cooling:
Q=k⋅A⋅(TA−TB),
where:
-
Q is heat flow.
-
k is convection heat transfer coefficient.
-
A is surface area.
-
D is distance between layers (that is, thickness of material).
-
TA and TB are temperatures of the two bodies.
Connections A and B are thermal conserving ports associated with the points between which the heat transfer by convection takes place. The block positive direction is from port A to port B. This means that the heat flow is positive if it flows from A to B.
3.Conductive Heat Transfer: This block models heat transfer in a thermal network by conduction through a layer of material. The rate of heat transfer is governed by Fourier's law and is proportional to the temperature difference, material thermal conductivity, area normal to the heat flow direction, and inversely proportional to the layer thickness.
>The Conductive Heat Transfer block represents a heat transfer by conduction between two layers of the same material. The transfer is governed by the Fourier law:
Q=k⋅AD(TA−TB),
where:
-
Q is heat flow.
-
k is thermal conductivity of the material.
-
A is area normal to the heat flow direction.
-
D is distance between layers (that is, thickness of material).
-
TA is temperature of layer A.
-
TB is temperature of layer B.
Connections A and B are thermal conserving ports associated with material layers. The block positive direction is from port A to port B. This means that the heat flow is positive if it flows from A to B.
4.Subsystem: Here it consists of PMC port,temperature sensor and goto block.
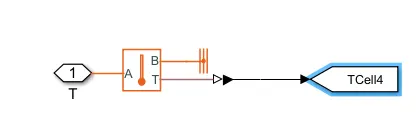
>Physical Modeling Connection Port block for subsystems,
>Temperature Sensor:This block measures temperature in a thermal network. There is no heat flow through the sensor. The physical signal port T reports the temperature difference across the sensor. The measurement is positive when the temperature at port A is greater than the temperature at port B.
>Thermal Reference: This block represents a reference point in a thermal network where the temperature is equal to absolute zero
>Like this we have 3 different subsystems for 3 different battery cells.
5.Lithium cell one RC equivalent circuit:A simple thermal model is used to model battery temperature. It is assumed that cooling is primarily via convection, and that heating is primarily from internal resistance. A battery pack can be modeled by connecting multiple copies of the battery cell block in series.
Cell 01 to 04 Subsystem;
>cell susystem basically consists of a Thermal model and lithium cell 1RC block which calculate the temperature and thermal effect for cells and over calculate for the battey pack.
Lithium Cell 1RC Subsystem
>This block basically consists of capacitance value table which depeds on external signal inputs as SOC an T.It is assumed that the capacitance value is slowly varying with time, hence i= C* dv/dt.
>Resistnace table (R) value which depends on external physical signal input SOC and T.
>Voltage value (EM) is implements the cell's main branch voltage source,and determines the value of capacity (C),SOC.
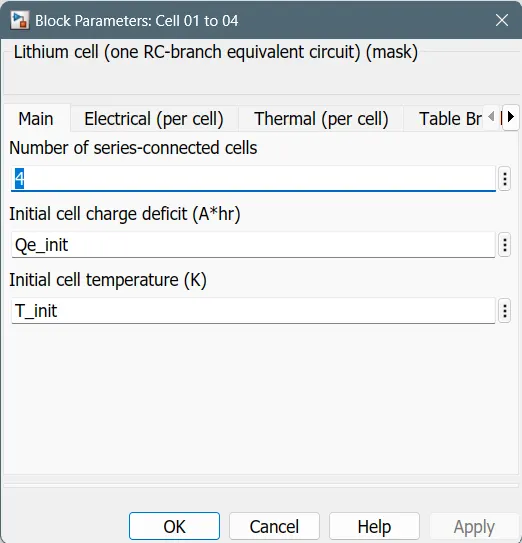
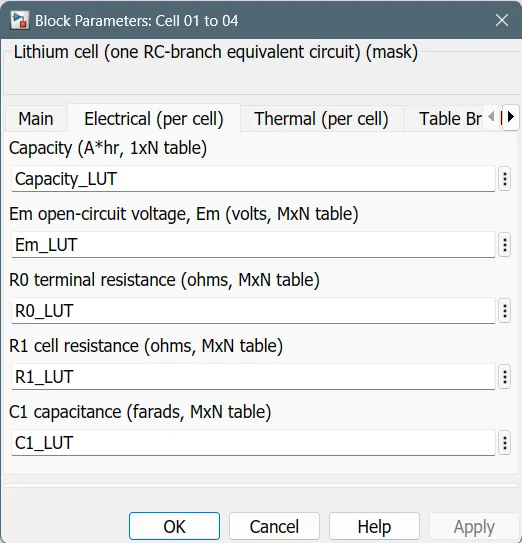
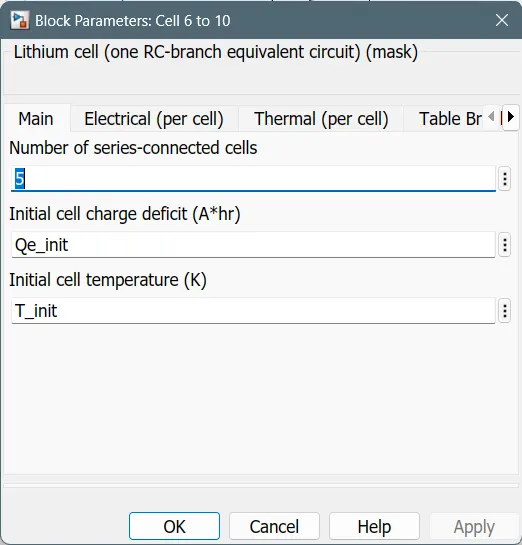
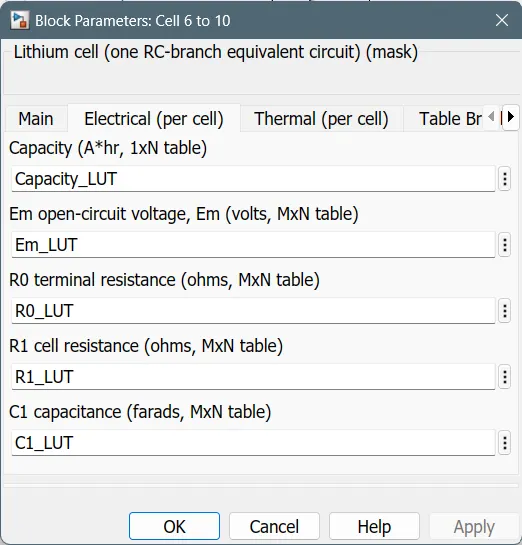
>Here the cell in series is connected to 4 electrical units are defined in simulink model itself .
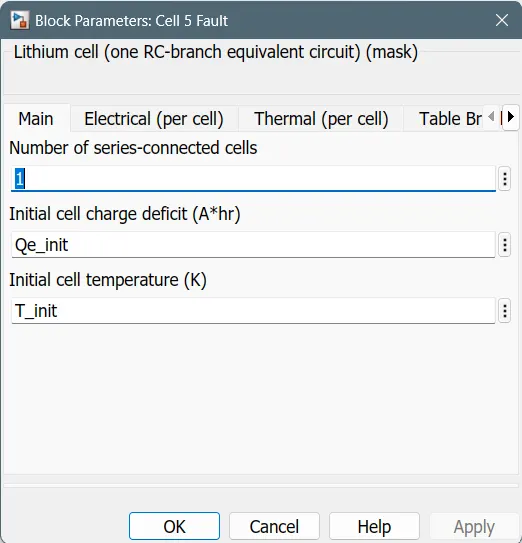
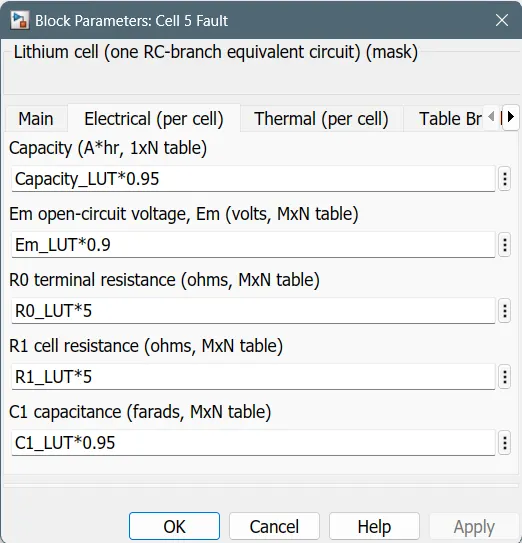
>Here series connected cell is 1 the electrical signals are changed as shown above.
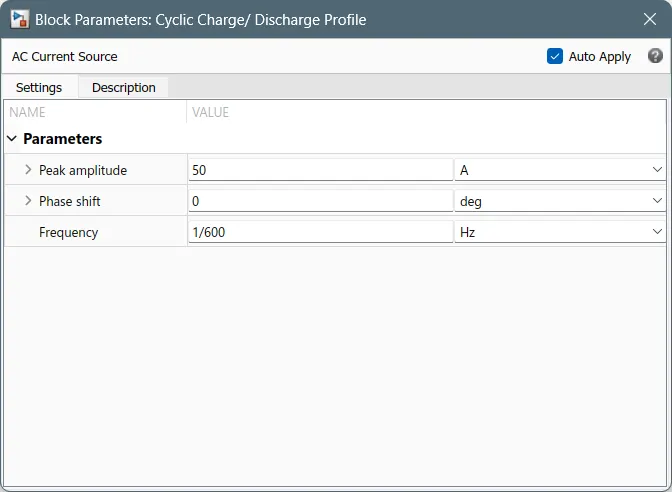
6.AC Current Source: The ideal AC current source maintains the sinusoidal current through it, independent of the voltage across its terminals. The output current is defined by I = I0 * sin(2*pi*f*t + PHI), where I0 is the peak amplitude, f is the frequency in Hz, and PHI is the phase shift in radians.
>The AC Current Source block represents an ideal current source that maintains sinusoidal current through it, independent of the voltage across its terminals.
The output current is defined by the following equation:
I=I0⋅sin(2π⋅f⋅t+φ)
where
| I | Current |
| I0 | Peak amplitude |
| f | Frequency |
| φ | Phase shift |
| t | Time |
>The Ac source the peak amplitude as 50A ,frequency as 1/6000 Hz
7.Current Sensor: The block represents an ideal current sensor, that is, a device that converts current measured in any electrical branch into a physical signal proportional to the current.
>Connections + and - are conserving electrical ports through which the sensor is inserted into the circuit. Connection I is a physical signal port that outputs current value.
8.State of charge estimation:
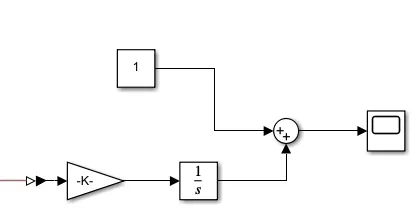
>The coulomb counting method measures the discharging current of a battery integrates the discharging current over time in order to the estimation of SOC
>This subsytem takes current as input and gives the battery SOC % as output, A cuurent sensor block is used and it is connected for SOC estimation.
>This circuit estimates the SOC % using coulomb counting method,the intial SOC of the battery is taken 100%
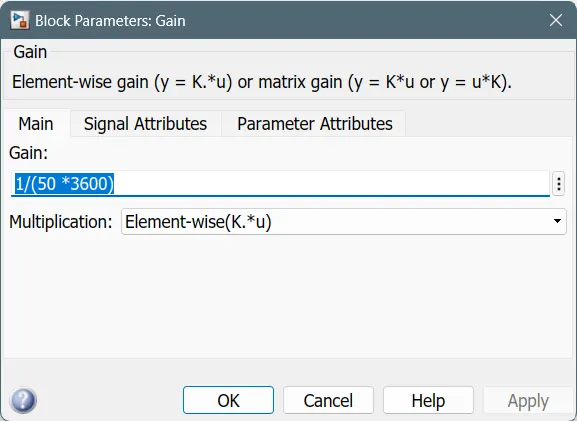
>The PS Gain block performs element-wise multiplication of the input physical signal by a constant value (gain). You specify the gain as the Gain parameter value and unit.The input signal value is multiplied by the value of the Gain parameter.
>The signal unit at the output port is determined by unit propagation rules. For example, if the input signal is in N and the Gain parameter unit is m, then the output physical signal has the unit of N*m.
>The gainblock implements the value as 1/50*3600
>After the completion of model run the model at 7200 sec,by running we get desired outputs shows below
Output plots:
1.Temp 300 k plot
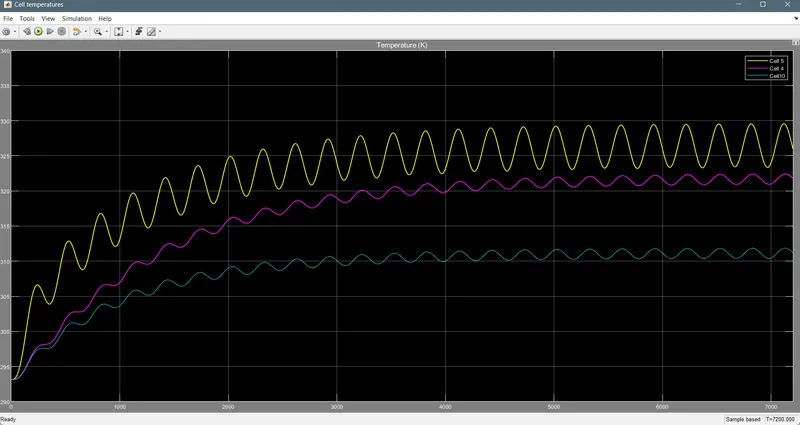
>Here it shows that at 300k temp the battery cell increases its performance which shows in above garph,where Cell 5 increases at 316 k which is an faulty cell,Cell 4 start at 304 ,cell 10 is at 300 which are normal cells.
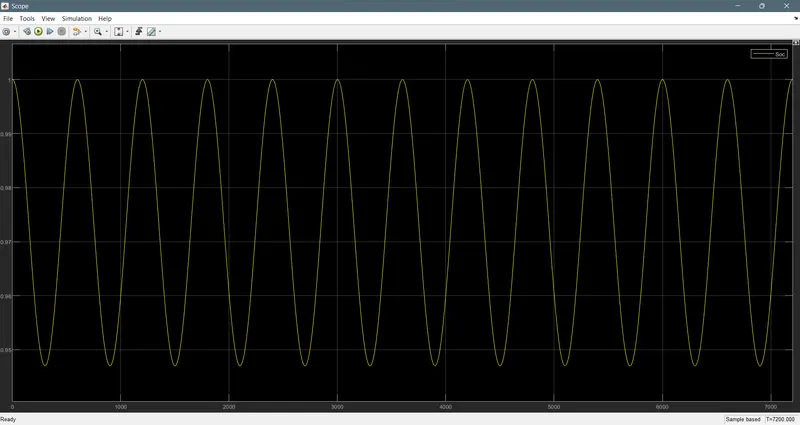
>The estimation of Soc shows in the above garph where as at 1 the Soc gets full charged condition and at 0.95 the Soc fall down the cycle repreates at eqqual time through out the 7200 sec.
>For a 10 cell series lithium ion battery model we simulate the thermal effect and comparing the life cycle performance of temperature ,discharge and charging rates using matlab shows above.
>1-4 cells are normal cell 5 is faulty and cell 6-10 are normal cells as we simulating thermal effect on which we are given the cyclic charge/discharge profile to circuit the waveform we can observe in above results ,all conditions are same but when circuit is run on the drive cycle profile as 5th cell was faulty it will shows temp rise is higher than any other cell and the life cycle of cell get reduced and cell even can get damage.