Project 1 - Parsing NASA thermodynamic data
%% NASA THERMO data file prasing ::
>> file prasing:is to 'split' a file into peices of data that can easily stored or manipulated.
>> file prasing is used to read as well as to write data in a file.
>> NASA's thermo data file is to extract the coefficients and polynomials that are used to calculate various thermodynamic properites and chemical species molecular weights.
clear all
close all
clc
>> clc,clear_all,close_all are used to clear the data ,plots,figures,commands in matlab window
>>'fopen' command is used to read the data given
>> data is given as 'THERMO.dat'
>>'fgetl' command is used to read data line by line
>>'f1' is an fuction
% Reading THERMO data file
f1=fopen('THERMO.dat','r')
first_line= fgetl(f1);
>> 'strsplit' command is used to split the string at a specified delimiter,spacing b/w two numbers.
>>'str2num' command is used convert string values into numbers.
%reading global temperatures
Temp=fgetl(f1)
T=strsplit(Temp,' ');
global_low_temp= str2num(T{2});
global_mid_temp= str2num(T{3});
global_high_temp= str2num(T{4});
>>'for loop' is used for to skip the data which is not requried and read the data file which is requried to claculate.
%skipping next three lines in the data
for i=1:3
fgetl(f1);
end
>> 'for loop' is used here for to read the data of 53 species individually by excuting 'fgetl(f1)' command.
>> The name of species stored as 'species_names'
>>'local temp values are extracted by 'str2num' command.
>> string is conerted into array by using 'strsplit' command.
% defining all species individually
for k=1:53
tline=fgetl(f1);
A=strsplit(tline,' ');
species_names=(A{1});
% reading local temp for each individual species
local_low_temp = str2num(A{end-3});
local_mid_temp = str2num(A{end-1});
local_high_temp = str2num(A{end-2});
>>Extracting all 14 coefficients and getting seperately by fgtel(f1) command and getting 'E' value by 'findstr'command.
%% Extracting 14 coefficients
% Reading 1st values
tline=fgetl(f1);
a=findstr(tline,'E');
a1=str2num(tline(1:a(1)+3));
a2=str2num(tline(a(1)+4:a(2)+3));
a3=str2num(tline(a(2)+4:a(3)+3));
a4=str2num(tline(a(3)+4:a(4)+3));
a5=str2num(tline(a(4)+4:a(5)+3));
>> By usig 'fgetl(f1) next 5 coefficients are found
% Reading 2nd line values
tline=fgetl(f1);
a=findstr(tline,'E');
a6=str2num(tline(1:a(1)+3));
a7=str2num(tline(a(1)+4:a(2)+3));
a8=str2num(tline(a(2)+4:a(3)+3));
a9=str2num(tline(a(3)+4:a(4)+3));
a10=str2num(tline(a(4)+4:a(5)+3));
%Reading 3rd line values
tline=fgetl(f1);
a=findstr(tline,'E');
a11=str2num(tline(1:a(1)+3));
a12=str2num(tline(a(1)+4:a(2)+3));
a13=str2num(tline(a(2)+4:a(3)+3));
a14=str2num(tline(a(3)+4:a(4)+3));
>> 'linspace' command is used to range the lower and higher temp values for 1000 values.
% defining Temp ranges
T=linspace(local_low_temp,local_high_temp,1000);
>> R is the universal gas constat
% universal gas constant
R=8.3145; %in j/mol-k
% calculating specific heat,enthalpy,entropy and molecular weight;;
>>To calcuate these we have create an seperate functions for each individually by using below formulas;;
cp=specific_heat(a1,a2,a3,a4,a5,a8,a9,a10,a11,a12,R,T,local_mid_temp);
H=enthalpy(a1,a2,a3,a4,a5,a6,a8,a9,a10,a11,a12,a13,R,T,local_mid_temp);
S=entropy(a1,a2,a3,a4,a5,a7,a8,a9,a10,a11,a12,a14,R,T,local_mid_temp);
M=molecular_weight(species_names);
>>'mkdir' is to create the folder name.
>>'cd' is an current folder and is used to change folder to new folder
>>"file_prasing_NASA '' is an folder name which contains all data
% Creating sepearte directory to store graphs and values of each species
% cd('C:usersshivaprasadDesktopfile_prasing_NASA');
mkdir(species_names);
cd(species_names);
>> M_file is an file containing
>>'fprintf' prints the data which file contains
% writing molecular weight to a text file
M_file=fopen('molecular weight.txt','w');
fprintf(M_file,'molecular weight of %s is %f',species_names,M);
fclose(M_file);
%plotting temp vs cp graphs and saving
figure(1)
plot(T,cp,'lineWidth',2,'color','b');
xlabel('Temp(k)');
ylabel('specific heat(kj)');
title(sprintf('Temp vs specific heat of %s',species_names));
grid on
saveas(figure(1),'specific heat.png');
>> error ;; where ''Linewidth'' 'L' is in captial letter, '2' rectified by 2,'Color' where 'c' should be in small letter
>>'saves' rectified by ''saveas'' in the 'png' format.
% plotting Temp vs enthalpy and saving it
figure(2)
plot(T,H,'lineWidth',2,'color','g');
xlabel('Temp(k)');
ylabel('Enthalpy(kj/mol)');
title(sprintf('Temp vs Enthalpy of %s',species_names));
grid on
saveas(figure(12),'Enthalpy.png');
%plotting Temp vs entropy and saving it
figure(3)
plot(T,S,'linewidth',2,'color','r');
xlabel('Temp(k)');
ylabel('Entropy(kj/mol-k)');
title(sprintf('Temp vs Entropy of %s',species_names));
grid on
saveas(figure(1),'Entropy.png');
cd ..
end
>> changing the current folder to orginal folder.
%changing directory to orginal directory
% cd('C:usersshivaprasadDesktopfile_prasing_NASA')
>>>> creating Functions for specific heat,enthalpy,entropy,molecular weight;;;
>> specific heat function::
% % defining to calculate for specific heat based on values of temperature
function cp=specific_heat(a1,a2,a3,a4,a5,a8,a9,a10,a11,a12,R,T,local_mid_temp);
if T>=local_mid_temp
cp=R*(a1+(a2*T)+(a3*(T).^2+(a4*(T).^3)+(a5*(T).^4)));
else
cp=R*(a8+(a9*T)+(a10*(T).^2)+(a11*(T).^3)+(a12*(T).^4));
end
end
% defining enthalpy function
function H=enthalpy(a1,a2,a3,a4,a5,a6,a8,a9,a10,a11,a12,a13,R,T,local_mid_temp);
if T>=local_mid_temp
H=R*T.*(a1+((a2*T)/2)+((a3*(T)).^2/3)+((a4*(T)).^3/4)+((a5*(T)).^4/5)+(a6./T));
else
H=R*T.*(a8+((a9*T)/2)+((a10*(T).^2)/3)+((a11*(T).^3)/4)+((a12*(T).^4)/5)+(a13./T));
end
end
% defining entropy function
function S=entropy(a1,a2,a3,a4,a5,a7,a8,a9,a10,a11,a12,a14,R,T,local_mid_temp);
if T>=local_mid_temp
S=R*(a1.*log*(T)+a2*T+((a3*(T).^2)/2)+((a4*(T).^3)/3)+((a5*(T).^4)/4)+a7);
else
S=R*(a8.*log*(T)+a9*T+((a10*(T).^2)/2)+((a11*(T).^3)/3)+((a12*(T).^4)/4)+a14);
end
end
>> In the above all three functions the 'if else loop' command is used for whcih ,there are 14 coefficients which has 7 lower and higher temperatures are using for specific heat,entropy,enthalpy calculation..which means if else considered the lower and higher temp respcetively for each species.
% defining molecular weight function;;
>> "M" function output which consists molecular weight of species.intially stored as'0'.
>>'species_names' is an input to the function and also and function name
function M=molecular_weight(species_names)
% defining atoms and their respective atomic weights
>>'Atoms' are considered with their 'Atomic_weight'
Atoms=['O','H','C','N','Ar'];
Atomic_weight=[16,1,12,14,40];
M=0;
>>'if loop' is used for the first'species_names'
>>'strcmp'is used for comparing the atoms.
>> if comparsion is true atomic weight if particular species is added to 'M'
% comparing Atoms to the read data of species name and then calculating
%molecular weight
for i= 1:length(species_names)
for k= 1:length(Atoms)
if strcmp(species_names(i),Atoms(k))
M= M+Atomic_weight(k);
place=k;
end
end
>>'if loop' here is used to multiply the each value to the atomic weight
n= str2num(species_names(i));
if (n>1)
M=M+Atomic_weight(place)*(n-1);
end
end
% displaying molecular weight in command window
>>'fprintf' command will displays 'molecular weight of each stings'
fprintf('molecular weight of %s',species_names);
fprintf('%f',M);
disp(' ')
end
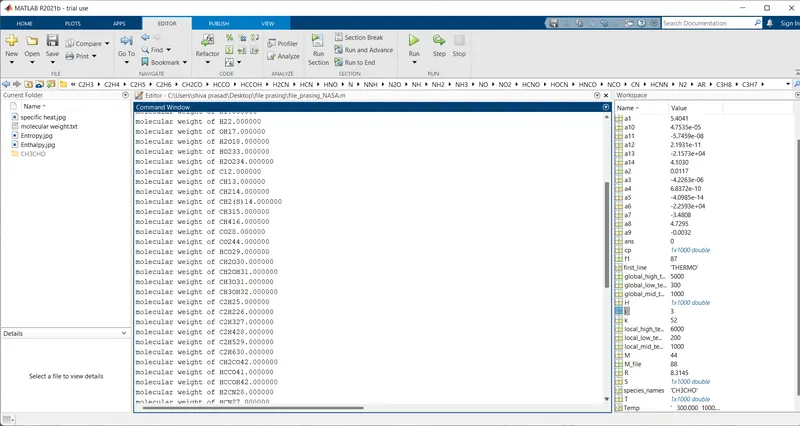
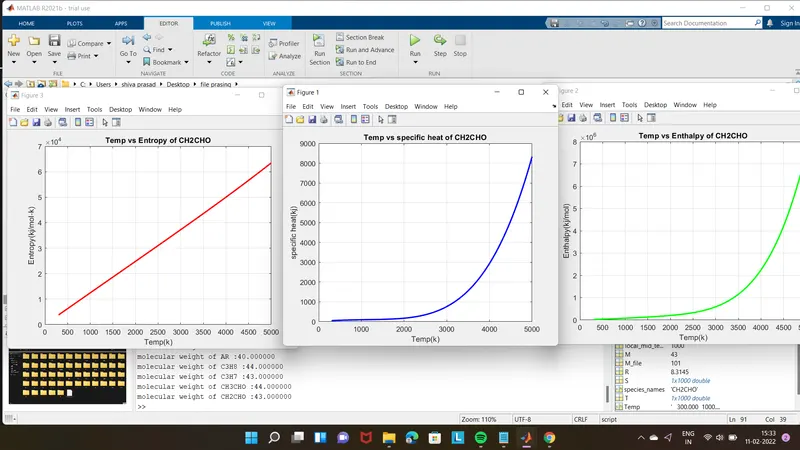
>> Above all the fuctions are executed into the main code after it run the code and all the molecular weights and plots are displayed in the window...
>>> all file screen short

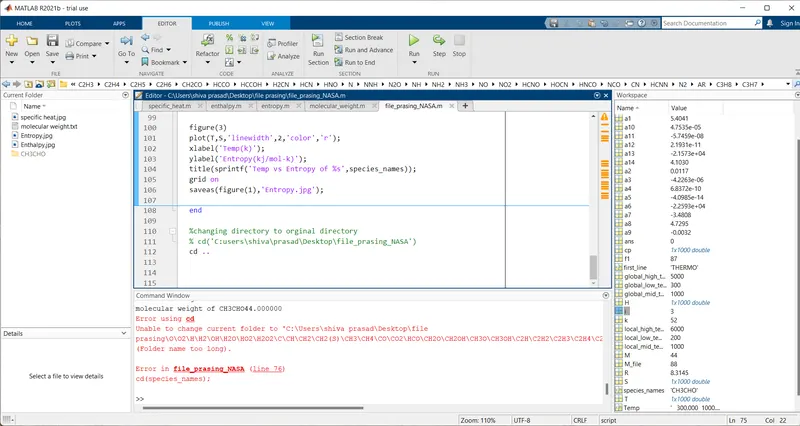
>> command window
>> polts
>> error