Project 2 Thermal modeling of battery pack
Simulink Model:
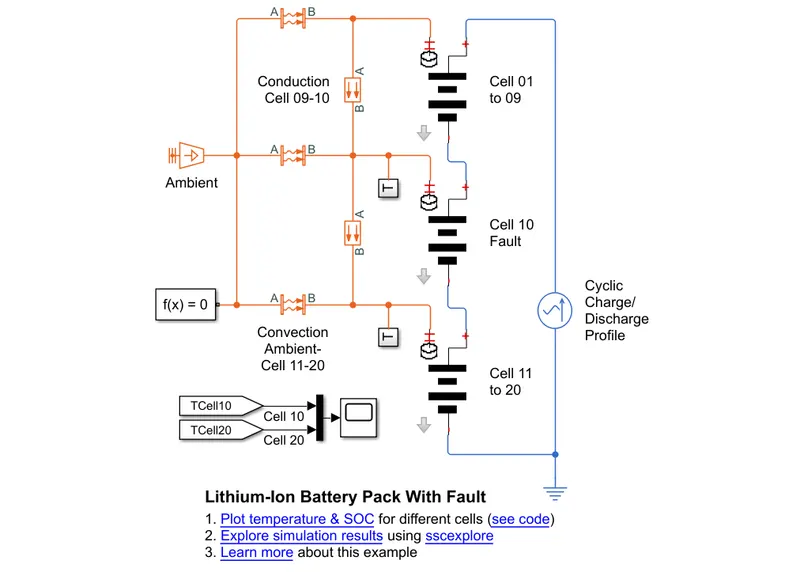
Conditions:
| case |
cyclic charge/discharge Peak Amplitude(A) |
| 1 | 50 |
| 2 | 60 |
| 3 | 70 |
| 4 | 80 |
| 5 | 90 |
Results Comparison:
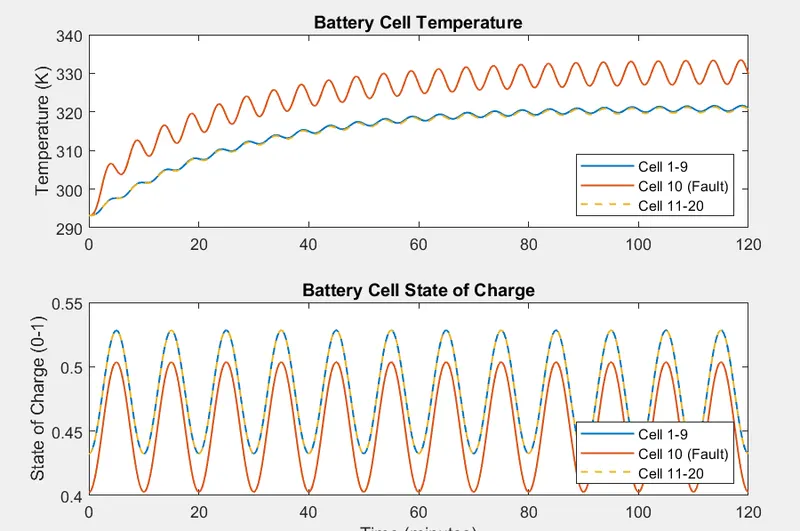
case 1:
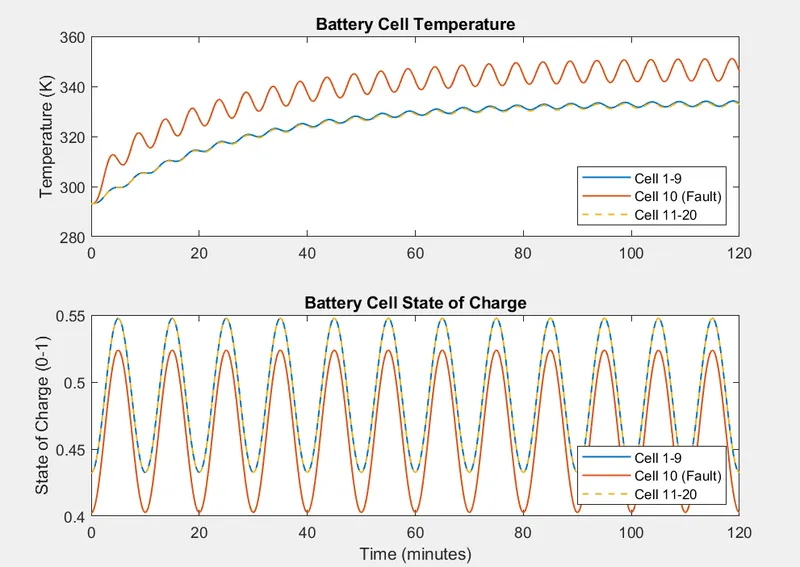
case 2:
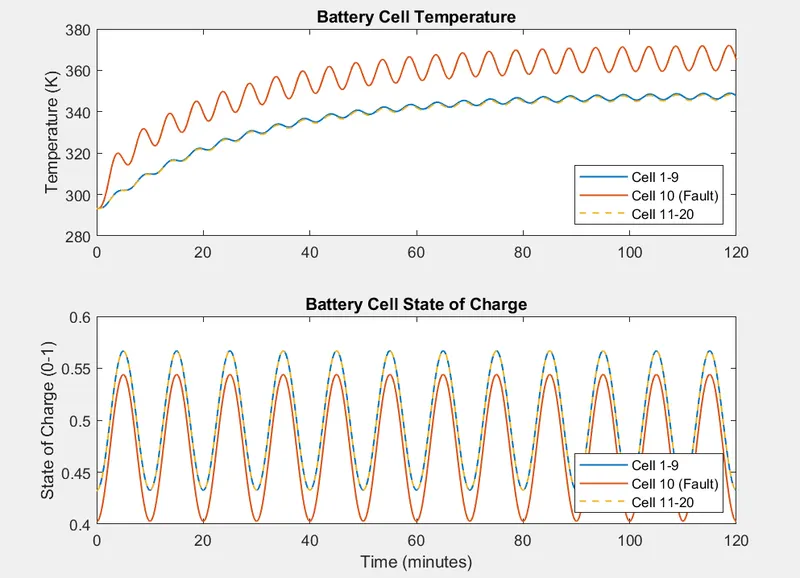
case 3:
case 4:
case 5:
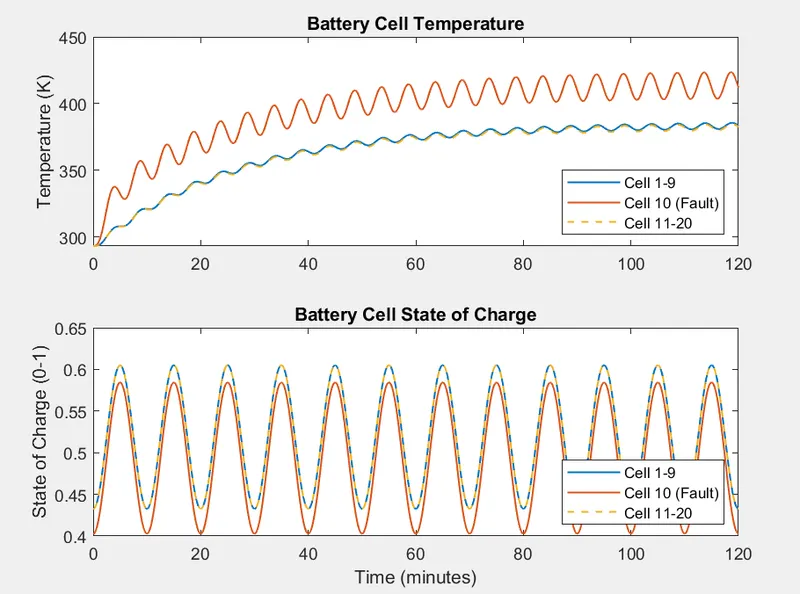
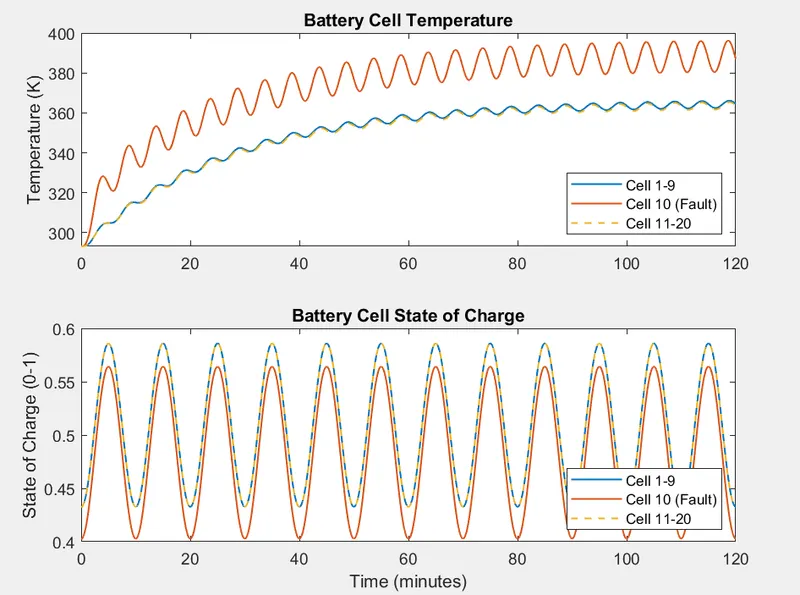
Above plots shows,
cell 1-9 and 11-20 shows same charateristics of temperature and SOC trends.
But, the fault cell in the pack shows quite variable characteristic behaviour for the same test cases.
In all the cases the fault cell show about 10 -20 K temperature differences and which reflects in their SOC range as well.
As the temperature of the fault cell increases the SOC decreases for each cycle.
Effects of atmospheric Temperature
| case |
Ambient Temperature |
| 1 | 293.15 |
| 2 | 300 |
| 3 | 310 |
| 4 | 320 |
| 5 | 330 |
Results Comparison:
case1:
case2:
case3:
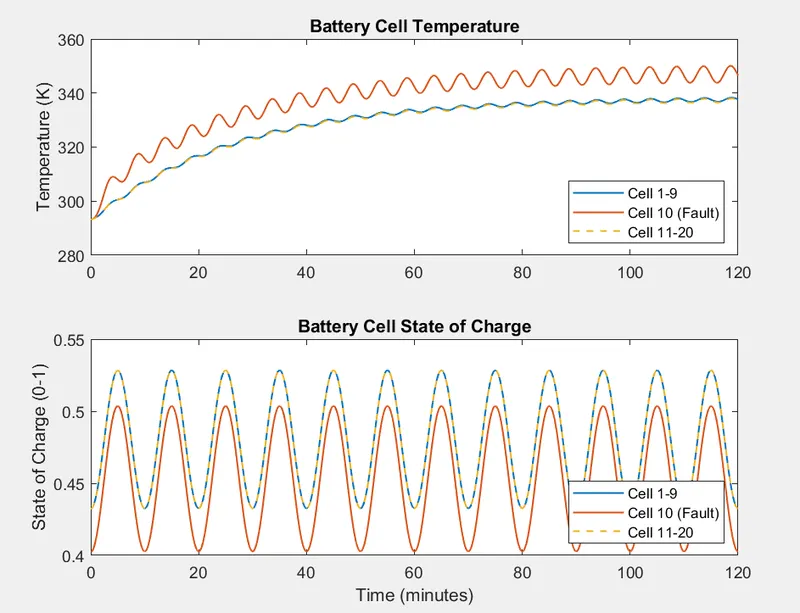
case4:
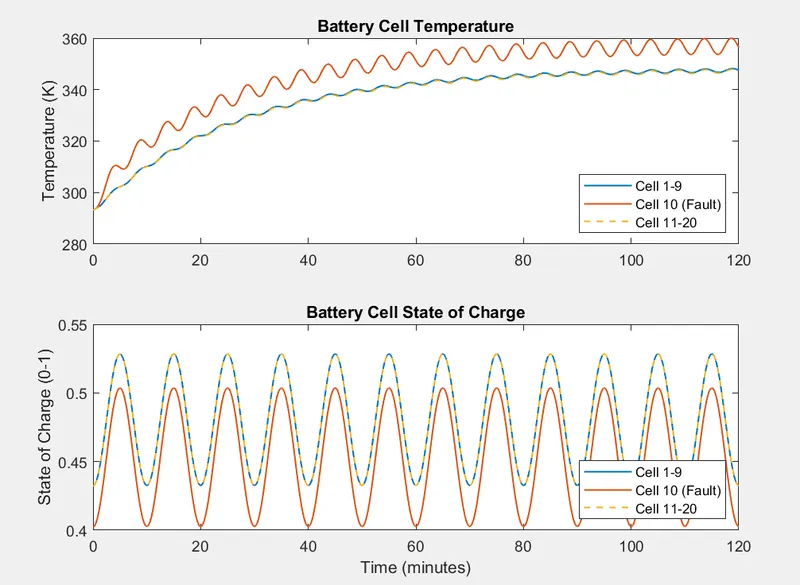
case5:
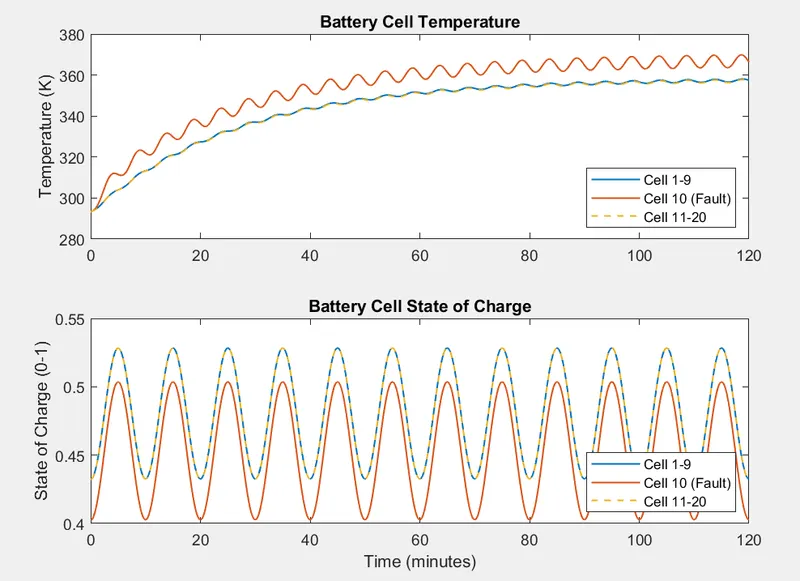
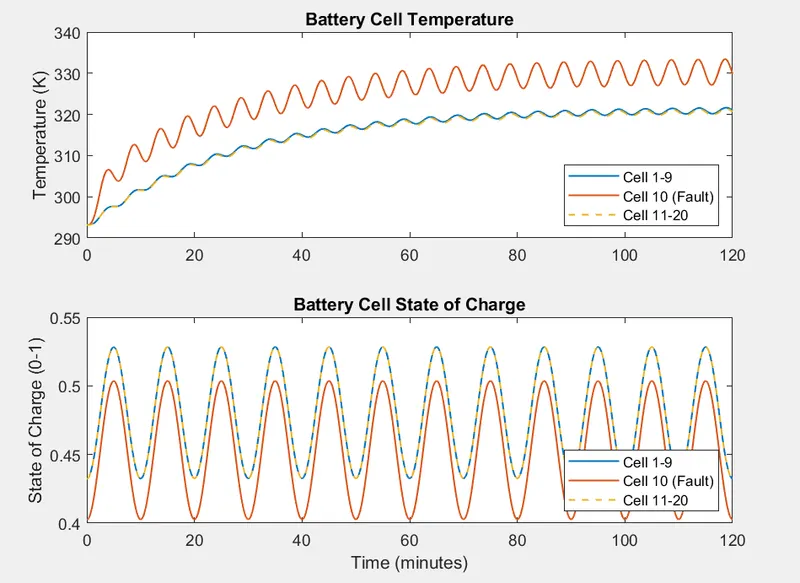
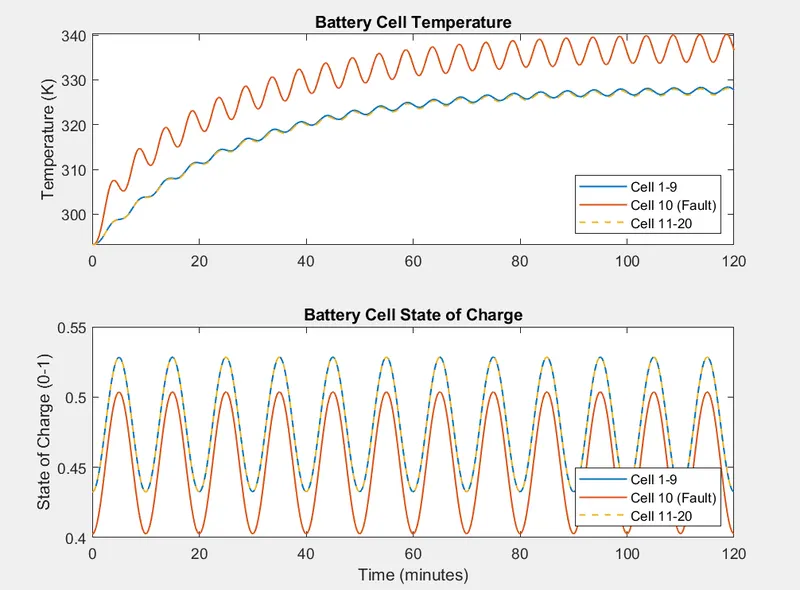
As the temperature changes in each test case on a value of 10 Kelvin increament, the working temperature of the cell increases gradually on each test setup.
But, the temperature of fault cell follows different trend than the normal working cells, which consequently reduces the SOC range.