Thermal Modeling of a Battery Pack
Aim- To simulate thermal effects for a 10 cell series lithium-ion battery at various temperature, charge and discharge rates using MATLAB.
---------------------------------------------------------------------------------------------------------------------------------------------------
Cell Used: Panasonic NCR18650BF
The specifications of the Panasonic NCR18650BF are as follows:
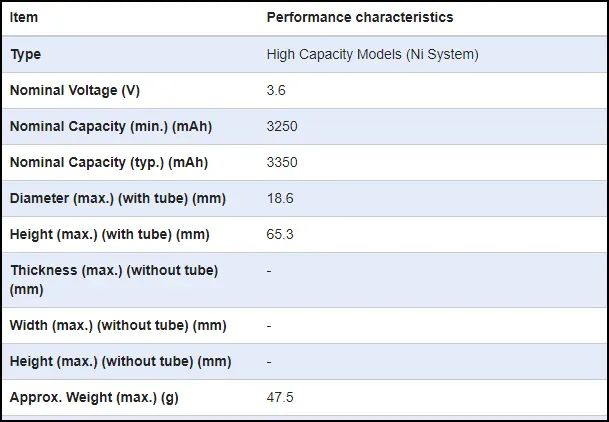
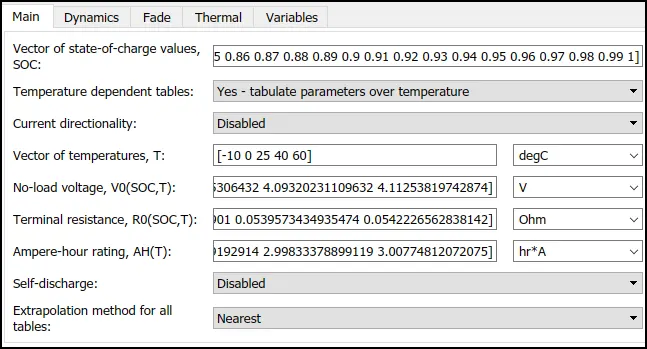
Although for simulation purpose the battery specifications used are predefined table based in MATLAB.
Blocks Used:
| Block | Description | Parameters |
Battery (Table-Based)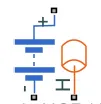 |
This battery block model a battery based on tabulated characteristics as functions of the state of charge (SOC) and optional temperature (T). The thermal is also chosen in the block choices. The battery being used is the Panasonic NCR18650BF. |
 |
Convective Heat Transfer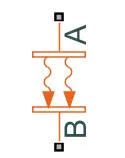 |
This block models heat transfer in a thermal network by convection due to fluid motion. The rate of heat transfer is proportional to the temperature difference, heat transfer coefficient, and surface area in contact with the fluid. |
The area is kept 0.004301 `m^2` considering the surface area of the battery cell. |
Current Sensor  |
The block represents an ideal current sensor, that is, a device that converts current measured in any electrical branch into a physical signal proportional to the current. Connections + and - are conserving electrical ports through which the sensor is inserted into the circuit. Connection I is a physical signal port that outputs current value. |
|
Controlled Current Source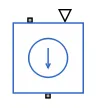 |
The block represents an ideal current source that is powerful enough to maintain the specified current through it regardless of the voltage across it. The output current is I = Is, where Is is the numerical value presented at the physical signal port. |
|
Temperature Sensor 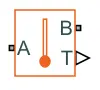 |
This block measures temperature in a thermal network. There is no heat flow through the sensor. The physical signal port T reports the temperature difference across the sensor. The measurement is positive when the temperature at port A is greater than the temperature at port B. |
|
Controlled Temperature Source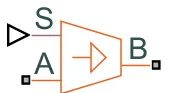 |
This block represents an ideal energy source in a thermal network that can maintain a controlled temperature difference regardless of the heat flow rate. The temperature difference is set by the physical signal port S. A positive temperature difference causes the temperature at port B to be greater than the temperature at port A. |
|
Perfect Insulator |
This block represents a terminus in a thermal network with no heat flow and no energy storage. Use this block as insulation for thermal conserving ports to prevent heat exchange with the environment and to model an adiabatic process. This block can also be used to set an initial value and priority for the temperature at the connected port. |
|

The other blocks used are: From Spreashett, Electrical Reference, Thermal Reference, Display, Gain, Sum, Solver Configuration, PS-Simulink converter and Simulink-PS converter.
Case 1: Simulink Model
Charge/Discharge Current Signal:
The charge and discharge signal is generated in a spreadsheet which is then imported into the Simulink block diagram. The purpose of this signal is to charge and discharge the battery for with different charge and discharge rates and for varying durations.
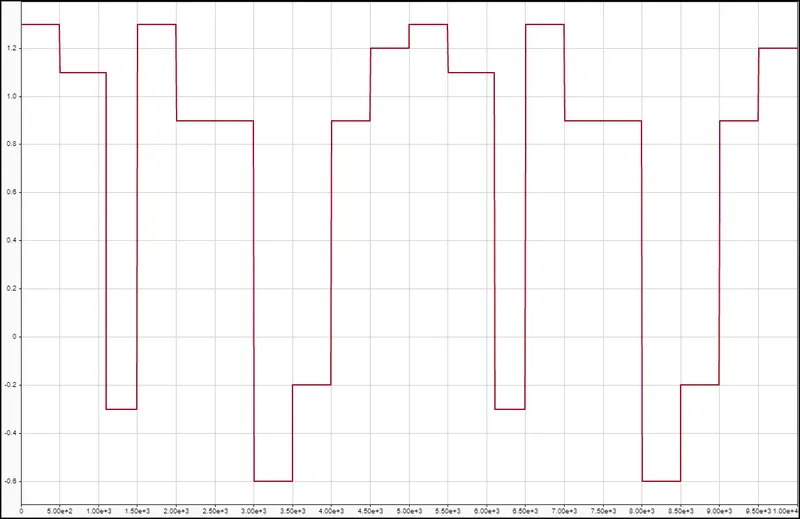
The vertical axis represents the magnitude of current charge/discharge rate. When the rate is positive, then the battery is being discharged and when it is negative, the battery is being charged.
Ambient Temperature:
Instead of using a constant temperature for the ambience, the ambient temperature data is created in a spreadsheet such that the temperature is constant only for a short duration and then it either rises or falls. After generating the ambient temperature data in a spreadsheet, it is imported in the Simulink block diagram.
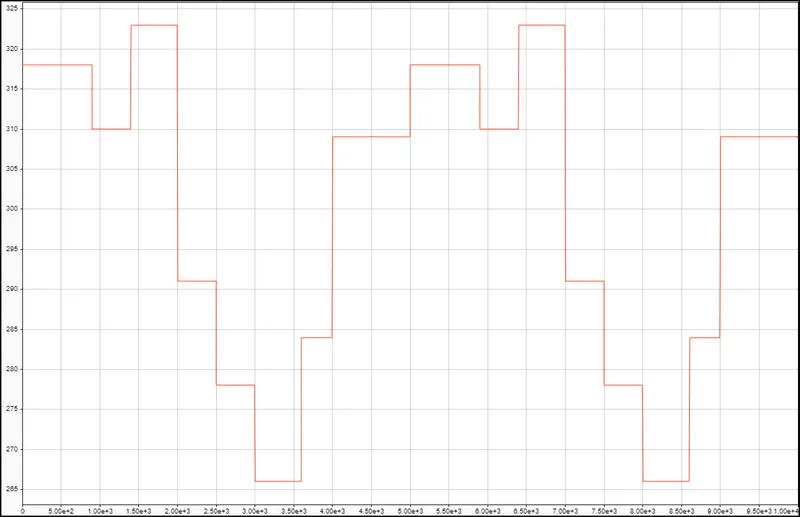
The vertical axis represents the ambient temperature in kelvin.
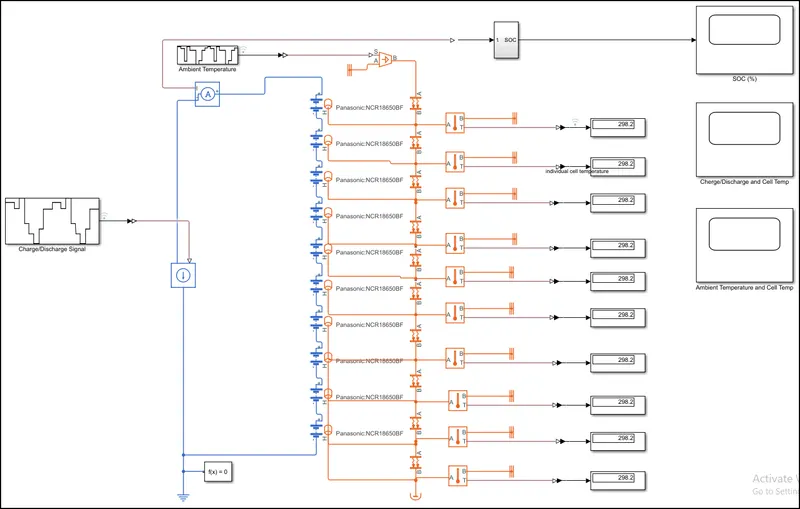
Thermal Connections:
- The temperature port of the batteries are connected to the convective heat transfer blocks and are all connected together. They are further connected to temperature sensors and the display blocks display the individual cell temperatures.
- A perfect insulator block is also connected to the thermal connections depicting the battery pack boundaries which is actually an insulator or heat.
- The convective heat transfer blocks are connected to an ambient temperature block which receives its input from the ambient temperature signal from a spreadsheet.
Electrical Connections:
- Here, the controlled current source block charges and discharges the battery pack according to the charge/discharge input signal from a spreadsheet.
- The batteries are connected in series to form a bigger battery pack. Thus, the battery blocks are acting as battery cells.
- A current sensor is also connected in series to measure the charge/discharge rate o the b battery pack. A separate subsystem receives input from this current sensor block and calculates the battery pack's SOC by performing the coulomb counting:
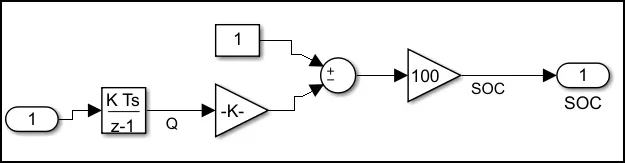
The simulation runs for 1000 seconds and the results are noted.
Case 2: Simulink Model
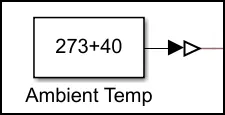
In this case, the battery pack is discharged with a constant current of 0.8A and the ambient temperature is kept constant at 40 degrees C.
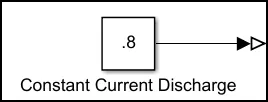
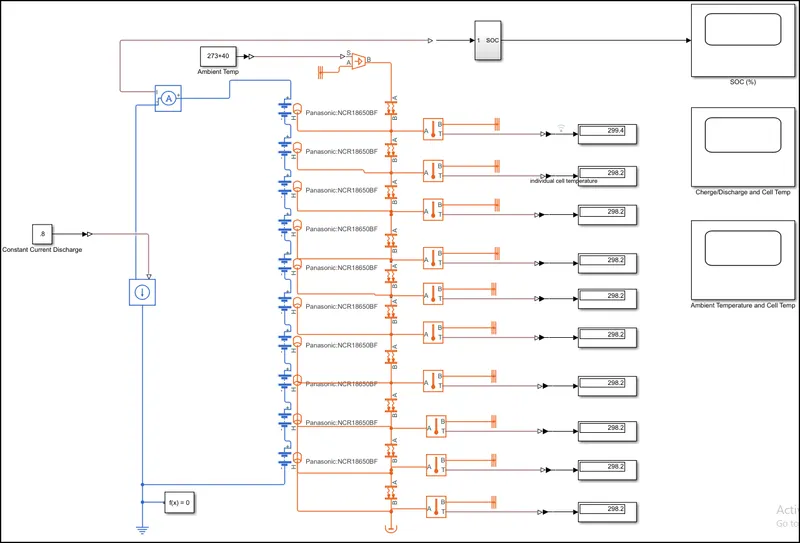
For this case, the simulation is run for 12600 seconds (3.5 hours).
Results:
---------------------------------------------------------------------------------------------------------------------------------------------------
Case 1
SOC (%)
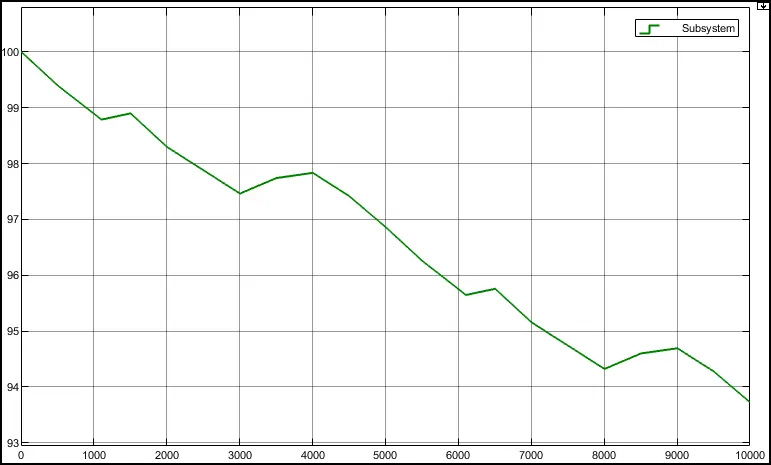
For a simulation of 1000 seconds (roughly 16 minutes), the SOC of the battery, which is 100% initially, falls to 93.7%.
There is a rise in the curve wherever the battery pack is being charged.
Charge/Discharge and Individual Cell Temperature:
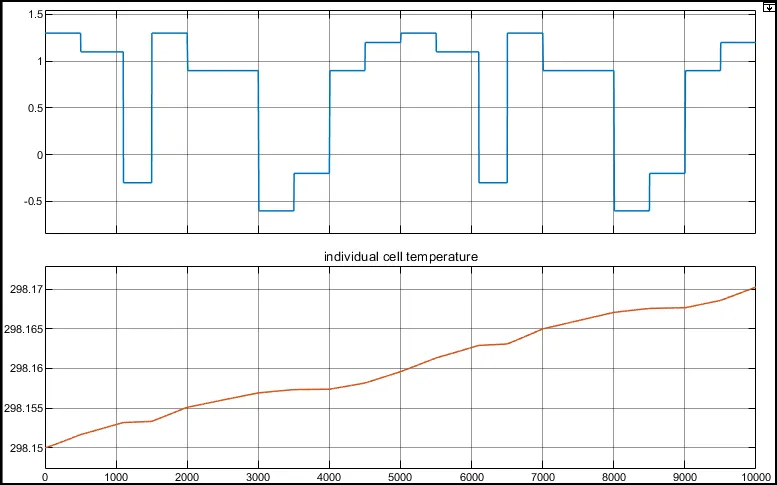
The total temperature rise is 0.02K which is very less but can be vividly seen in the above plot. Here, the upper part of the plot is the charge/discharge signal and the lower part is individual cell temperature (all cells have the same temperature).
Ambient Temperature and Individual Cell Temperature:
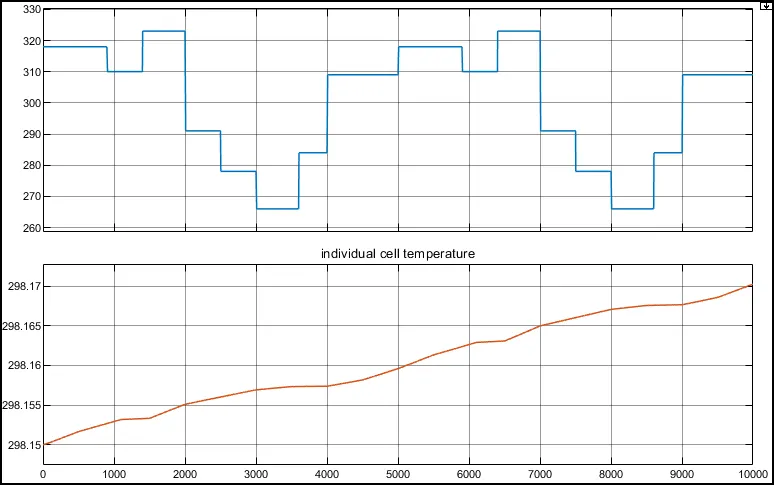
The above plot shows aa comparison between the ambient temperature and how it is affecting the individual cell temperature.
---------------------------------------------------------------------------------------------------------------------------------------------------
Case 2:
SOC (%):
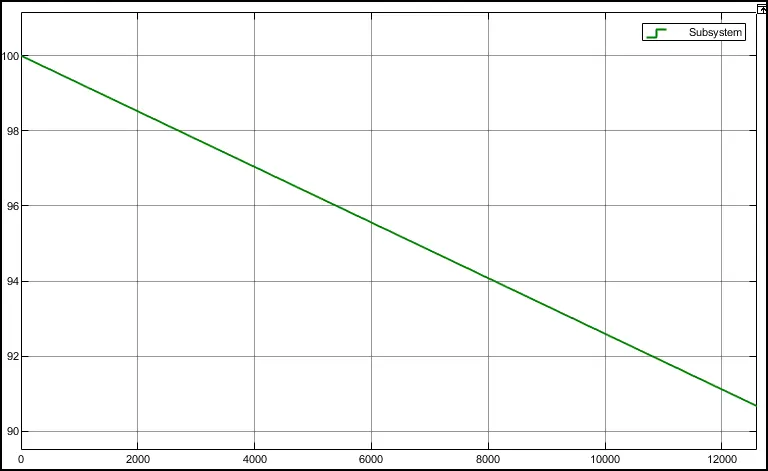
The SOC(%) of the battery pack falls from 100 to less than 91 ie, for a constant current discharge of 0.8A, the battery is discharged almost 10%.
Charge/Discharge and Individual Cell Temperature:
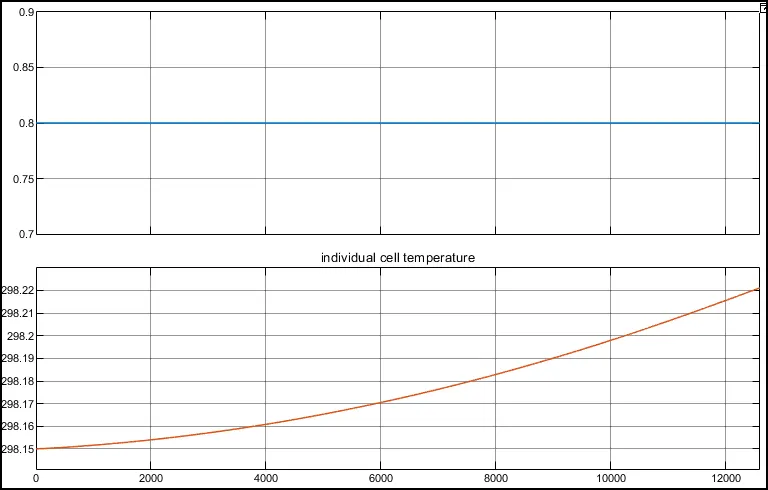

The constant discharge current is shown by a blue straight line and the orange line shows the individual cell temperatures (cell number 2 to 10). Cell number 1 has the highest temperature after rigorous for 3.5 hours with a temperature change of more than 1K, mainly because it is connected directly to the ambient temperature.
Ambient Temperature and Individual Cell Temperature:
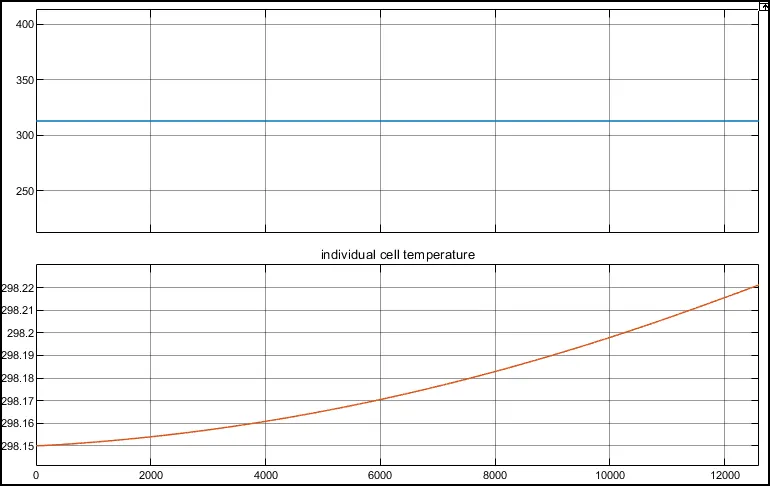
The blue line in the above plot shows the constant ambient temperature and the orange line is the same as in the previous plot.
Note : The model and spreadsheet file links are attached above with bold font.
---------------------------------------------------------------------------------------------------------------------------------------------------
Reference:
1. Design and Test Lithium Ion Battery Management Algorithms
2. Chalmers - Battery Thermal Management Systems of Electric Vehicles