Project 2 Thermal modeling of battery pack
2. Thermal modeling of the battery pack
Introduction:
Lithium-ion batteries are widely used as energy sources in different hybrid and electric vehicles, however, the operation characteristics of the battery in such vehicles are strongly dependent on the operation temperature, and therefore, with the purpose to improve these characteristics a good thermal control system should be utilized.
The temperature of a Lithium battery cell is important for its performance, efficiency, safety, and capacity and is influenced by the environmental temperature and by the charging and discharging process itself. Therefore, a thermal model of the battery is used in order to calculate and estimate the cell temperature.
So, for the 10-cell series lithium-ion battery here I used MATLAB Simulink for finding a thermal effect and life cycle performance related to temperature, charge, and discharge.
Lithium-Ion Battery Pack with Fault is to simulate a battery pack consisting of multiple series-connected cells in an efficient manner. It also shows how a fault can be introduced into one of the cells to see the impact on battery performance and cell temperatures. For efficiency, identical series-connected cells are not just simply modeled by connecting cell models in series.
Instead, a single cell is used, and the terminal voltage is scaled up by the number of cells. The fault is represented by changing the parameters for the Cell 5 Fault subsystem, reducing both capacity and open-circuit voltage, and increasing the resistance values.
A default MATLAB Simulink Model of Battery Pack which I used for 10-cell battery pack thermal modeling.
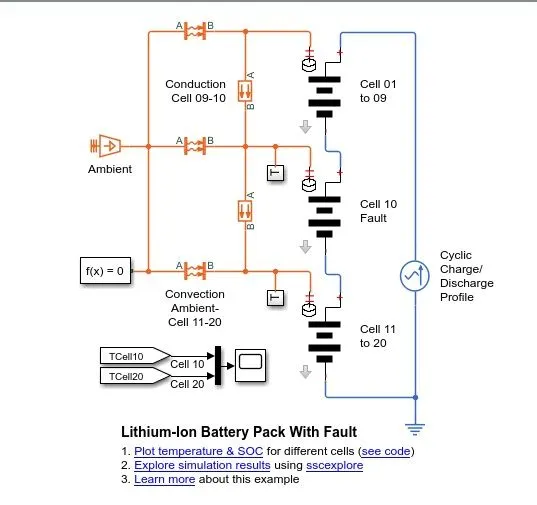
This example shows how to simulate a battery pack consisting of multiple series-connected cells efficiently. It also shows how a fault can be introduced into one of the cells to see the impact on battery performance and cell temperatures. For efficiency, identical series-connected cells are not just simply modeled by connecting cell models in series. Instead, a single cell is used, and the terminal voltage is scaled up by the number of cells. The fault is represented by changing the parameters for the Cell 10 Fault subsystem, reducing both capacity and open-circuit voltage, and increasing the resistance values.
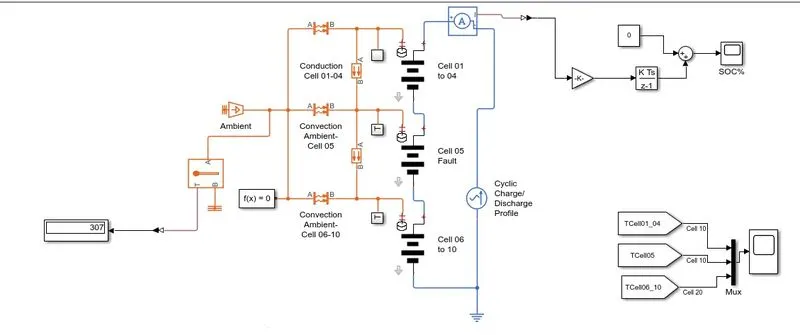
Here we actually made changes in the base model according to our requirements to obtain results.
Simulink Model:
The above Simulink model is designed for a 10-cell series lithium-ion battery to simulate the thermal effects and compare life cycle performance at various temperatures, charge & discharge rates. The block parameters used for designing the model are:
Cyclic Charge/ Discharge Profile:
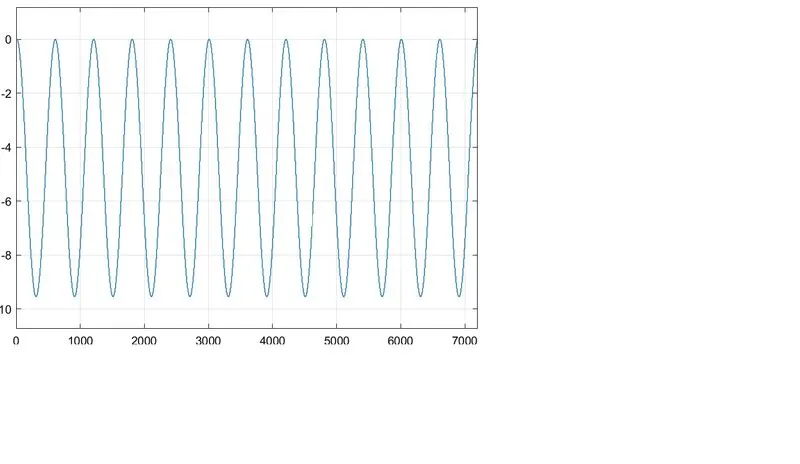
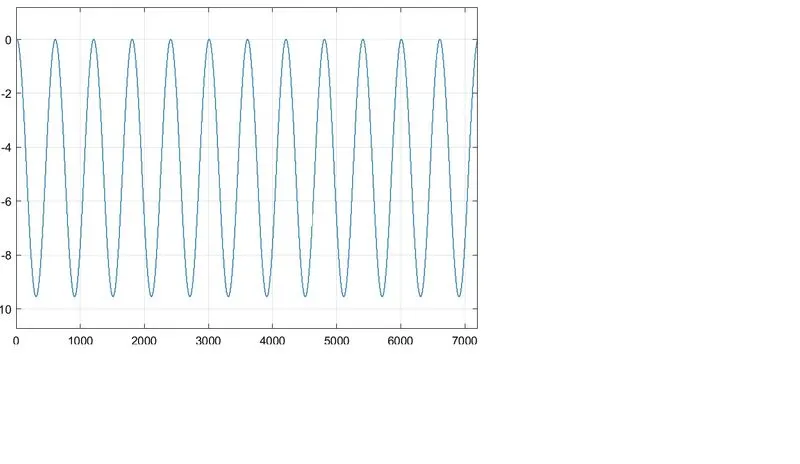
The cyclic charge/discharge profile means it is an ac current source, which charges and discharges the battery by sending the alternating current on a time basis and it has a time period and amplitude of 600sec and 50A respectively.
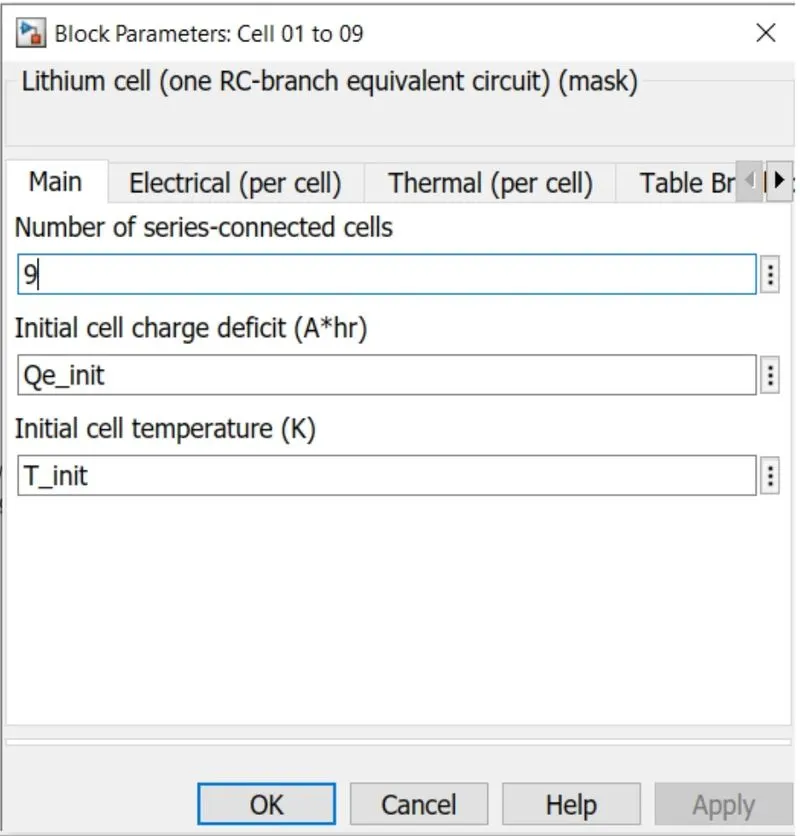
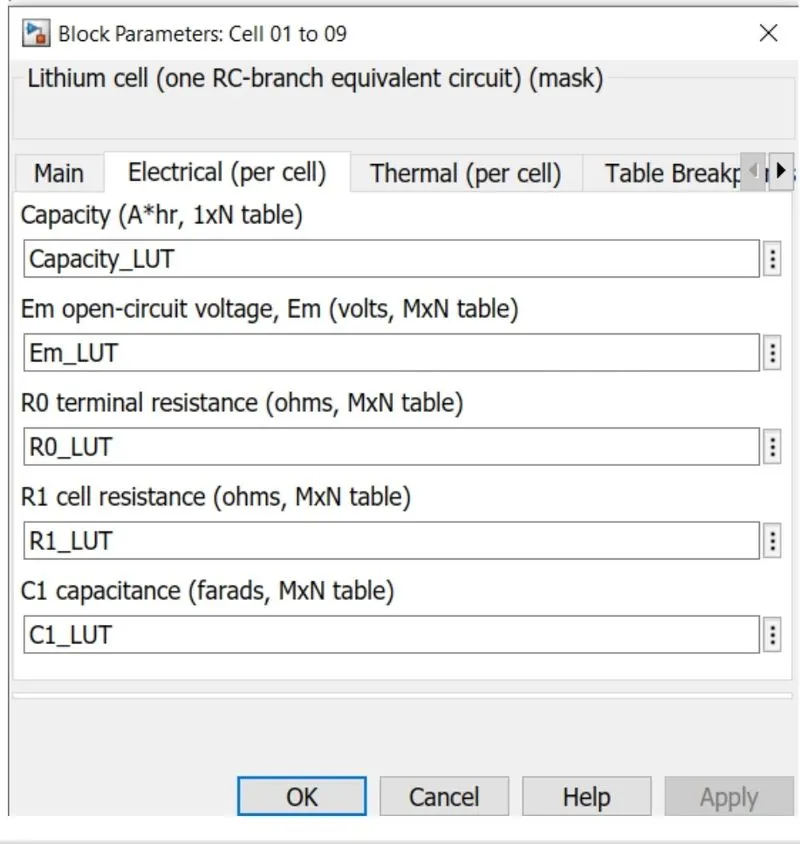
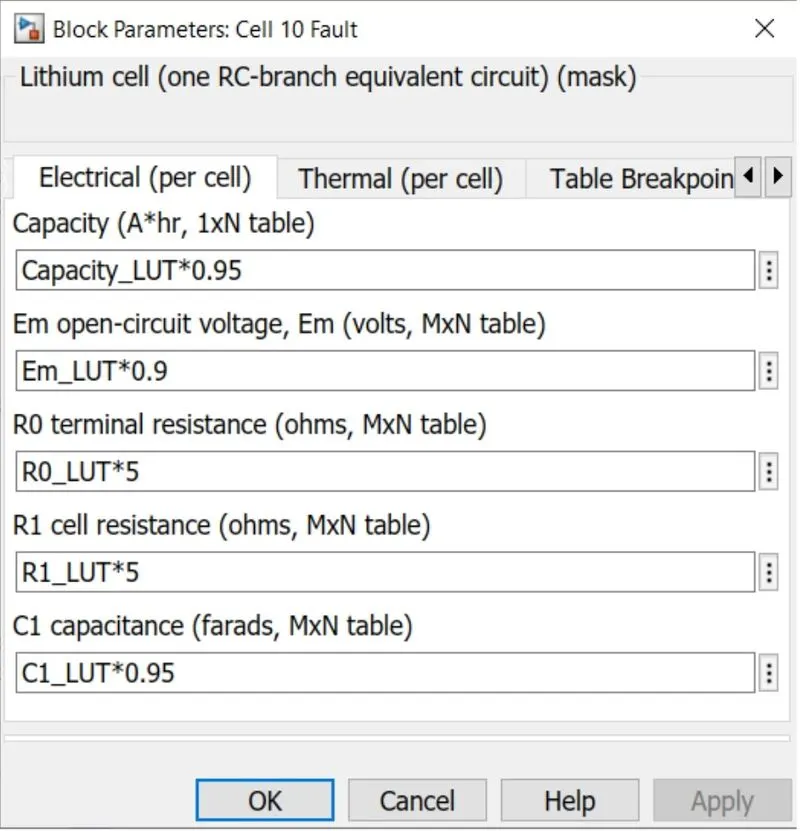
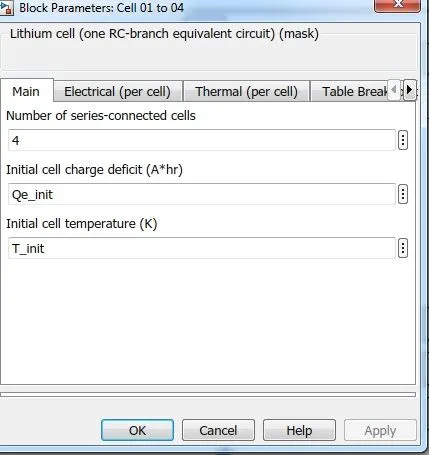
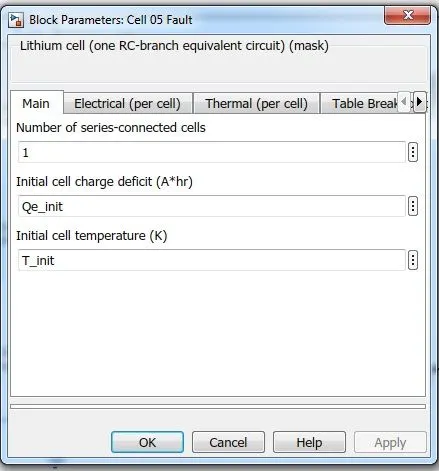
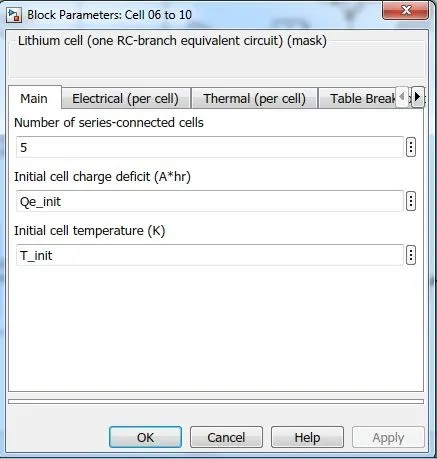
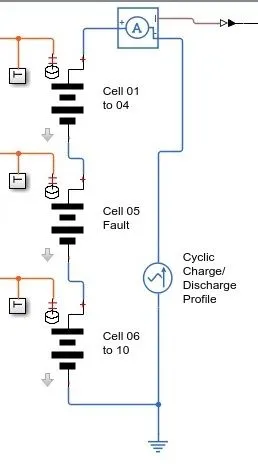

Here cell 01 to cell 09 there is only one cell which is multiplied by 9 times to obtain the same voltage as the 9 cell system, and the 10th cell is a faulty cell, from the 11th to the 20th cell there are 10 cells, but designed by only one cell. The block parameters are:
Now we see the block parameters of the 10th cell which are faulty.
see from the above parameters of the 10th cell,
we observed that,
- The cell capacity has been reduced by 5%. since it is multiplied by 0.95.
- The cell open-circuit voltage is reduced by 10%,
- The internal resistance of the cell is increased by 5 times, which causes a high-temperature rise in the cell.
- The capacitance is reduced by 5%.
The above parameters tell that the 10th cell is faulty.
As per the criteria, we are asked to determine the effects of a faulty cell for a series arrangement of 10 cells. so we are modifying the same circuit for 10 cells.
In the first set of batteries, we have to give 4 cells in series. to do that we need to change the no.of series-connected cells to 4 in the block parameters.
For the second set of batteries, we need to give 1 cell for the 5th cell
which is the faulty cell of this model.
and finally, we connect 5 cells remaining, from the 6th to the 10th cell.
Modeling for calculation of SOC:
To find Soc we need to find how much charge has been stored and dissipated, this can be done by finding out the charge.
The charge can be calculated from the value of the current.
If we integrate the current over a certain time, we will get the charge stored or dissipated (depending on the direction of the current) through a certain time.
we need to connect a current sensor to find the current and multiply it with a gain of 1/10000 and then we integrate it. subtract it from zero.
The Convective heat transfer block represents a transfer of heat in a thermal network by convection due to fluid motion.
The rate of heat transfer is proportional to the temperature difference, heat transfer coefficient, and surface area in contact with the fluid.
we need to model this parameter for the batteries.
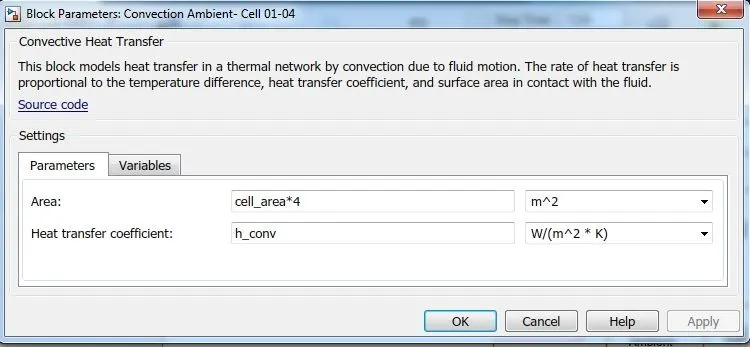
For 01 to 04 cells:
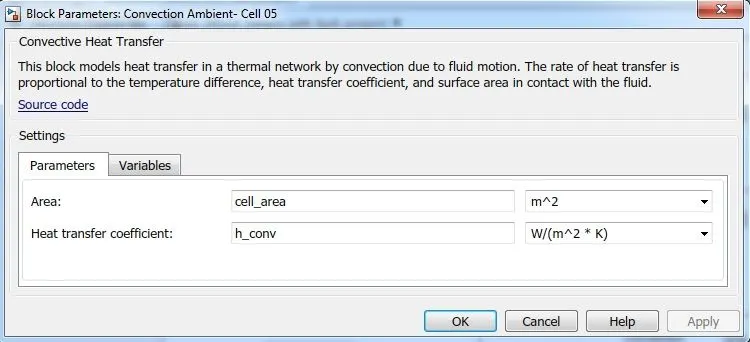
we have changed the cell area by 4 times since we only have 4 cells in that system and next for the faulty cell only one cell is present before and after so no need to change this parameter.
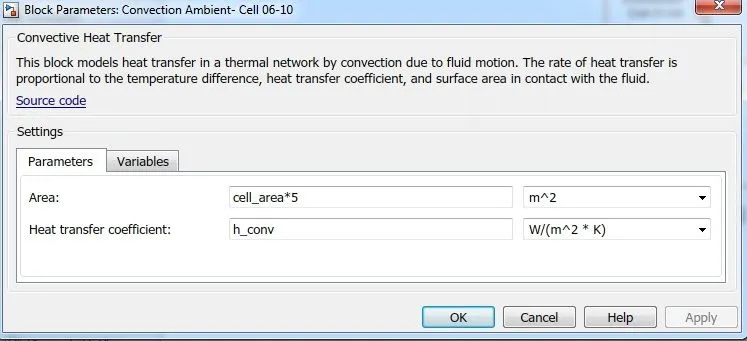
for the 6th to 10th cell, we are having 5 cells so we need to increase the convective heat transfer contact area by 5times.
we are not changing any of the parameter values of the conductive heat transfer block which transfers heat from battery to battery and the default values are assigned.
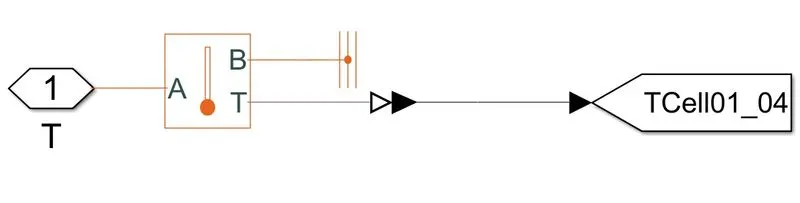
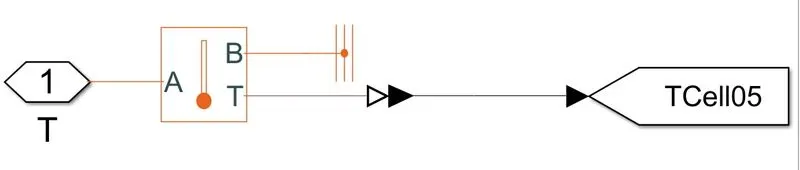
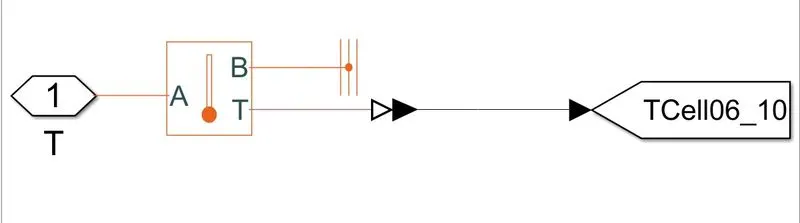
To observe the temperature variation, we need to connect temperature sensors at each stage, the subsystem is shown below for each stage.
The subsystem for the block T are
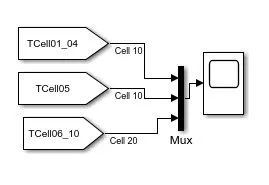
The outputs of these temperatures are connected to the scope using the Mux block.
Temperature Sensor:
This block measures temperature in a thermal network. There is no heat flow through the sensor. The physical signal port T reports the temperature difference across the sensor. The measurement is positive when the temperature at port A is greater than the temperature at port B.
In this model, the temperature is measured an displayed through the display block.
Scope Results:
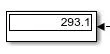
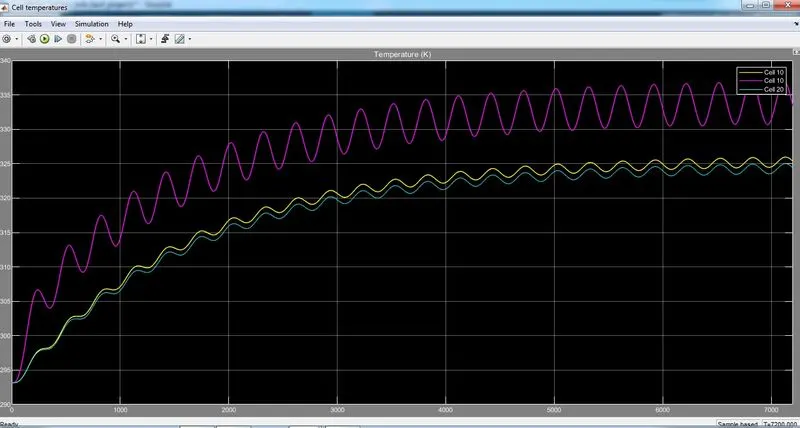
At T=293.1K
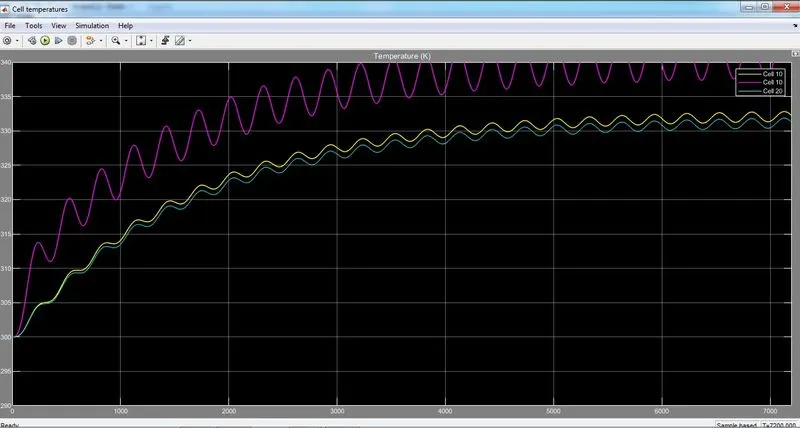
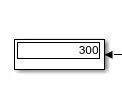
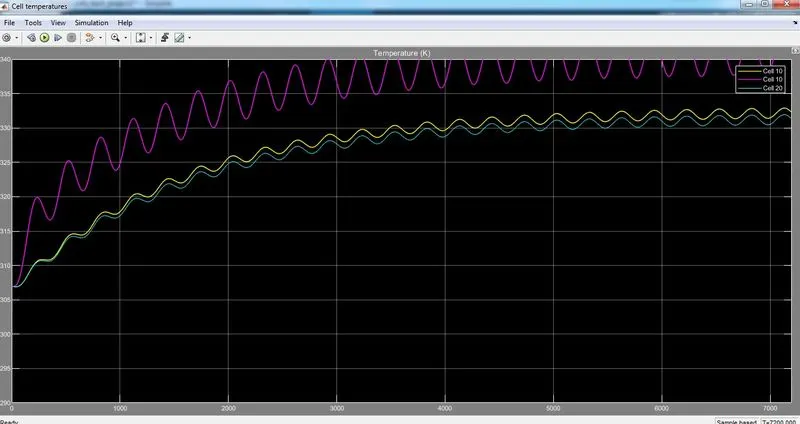
At 300K:
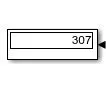
At 307K:
Observations:
- we applied different temperatures of 293K and 300K and 307K.
- we found the variation in temperature of faulty cell with the remaining cells, and the charging and discharging curve of the battery pack.
- There is not much difference in the no. of cycles at each temperature.
- There is a 7.5K temperature difference is there between healthy and faulty cell temperatures.
- As charging and discharging go on the temperature of the overall battery pack is increasing over time.
- if we increase the temperature source value the rate of increase of temperature is also raised.
At 293K, The healthy cells reach 325K and the faulty cell reaches 332.5K.
At 300K, The healthy cells reach 332.5K and the faulty cell reaches 340K.
At 307K, The healthy cells reach 337.5K and the faulty cell reaches 345K.