Project 2 Thermal modeling of battery pack
AIM
- To simulate the thermal effects and compare the life cycle performance of 10 cell series lithium-ion battery model at various temperatures, charge & discharge rates using MATLAB.
Here the inbuilt model Lithium-ion battery pack with fault is taken as the reference model and has been modified accordingly
reference model: https://in.mathworks.com/help/physmod/simscape/ug/lithium-ion-battery-pack-with-fault.html
Simulink model
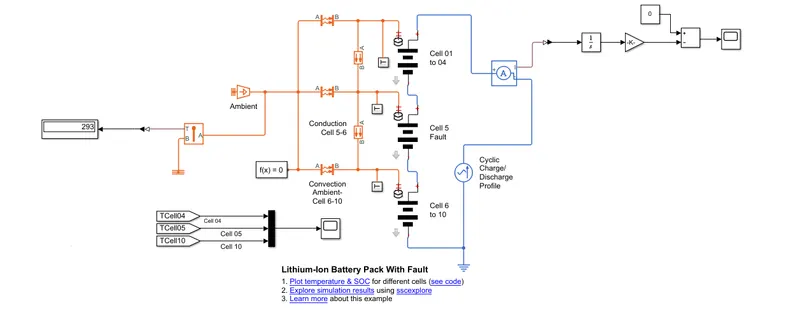
- the above model consists of 10 cells in series, where the first pack has 4 cells (cells 01-04). the second pack has only one cell (cell 5) which is fault one and the third pack has 5 cells (cells 6-10)
Blocks, parameters, and explanation
good cell packs (1-4 and 6-10 cells)
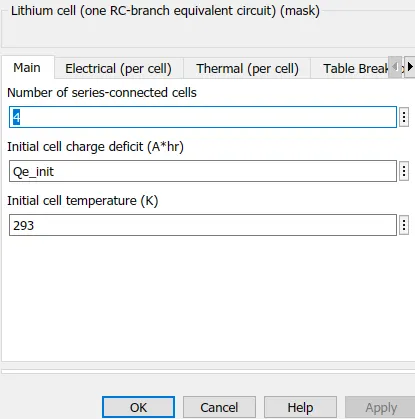
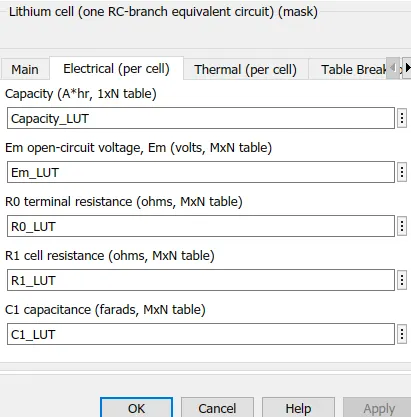
fault cell (cell 5)
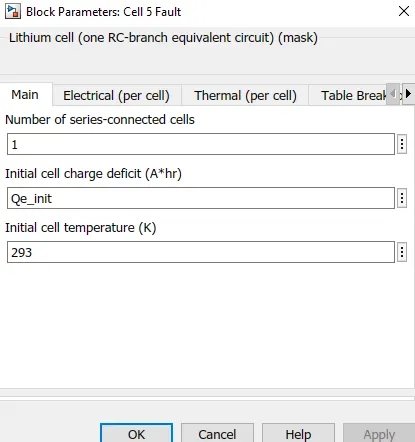
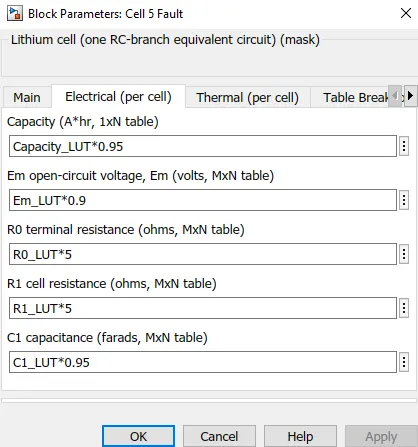
- in the fault cell (5), the capacity, open-circuit voltage, resistance, and capacitance are altered.
- then to measure the temperatures of cells 4, 5, 10 the below modifications are done in the T subsystem of the above model
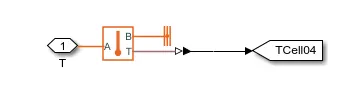
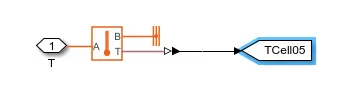
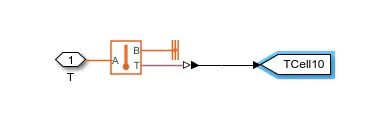
- then connected to scope by from blocks for observing the result.
CONDUCTION
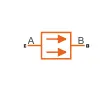
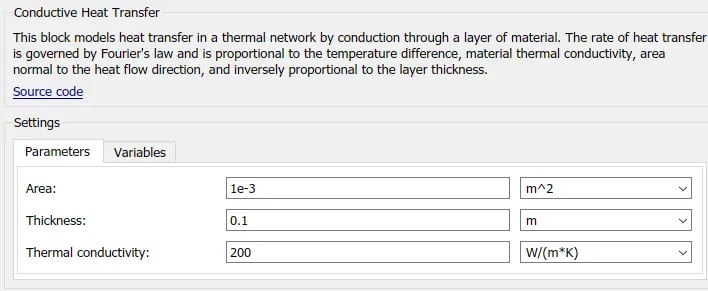
- the heat transfer in the thermal network is done by conduction through a layer of material.
- this block conducts heat transfer between the cell packs ie. first (1-4 cells) and second pack (cell 5). then between the second (5) and third pack (6-10 cells)
Block parameter
CONVECTION
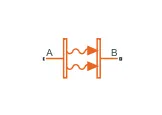
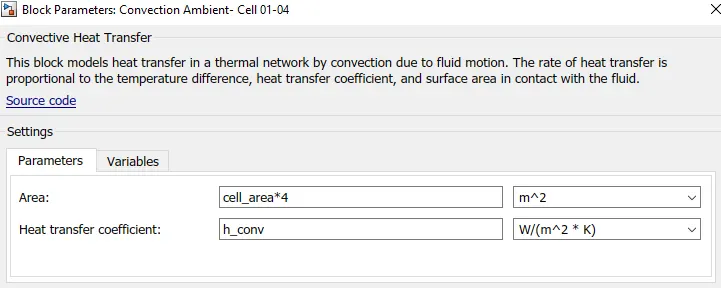
- the heat transfer in a thermal network is done by the convection method due to fluid motion.
- in this model, the heat transfer is done from the ambient thermal source to cell packs
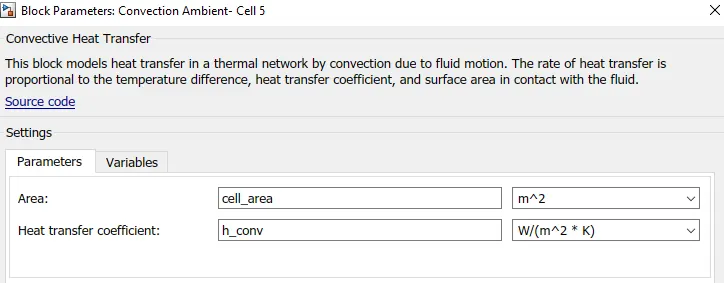
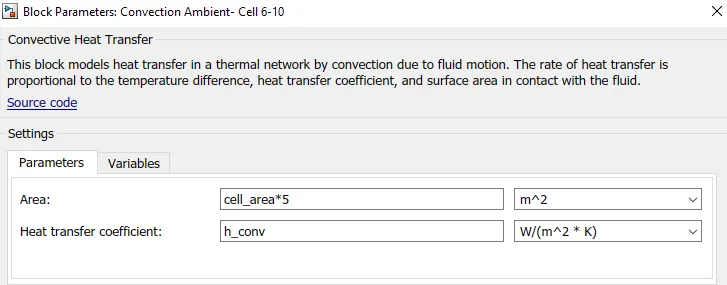
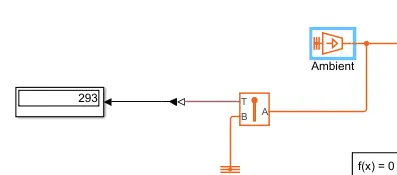
- the ambient temperature is measured by the temperature sensor and displayed
SOC
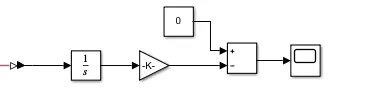
- the values from the current sensor are integrated and then connected to the gain block, add block, and then to the scope
Cyclic charge/discharge profile
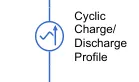
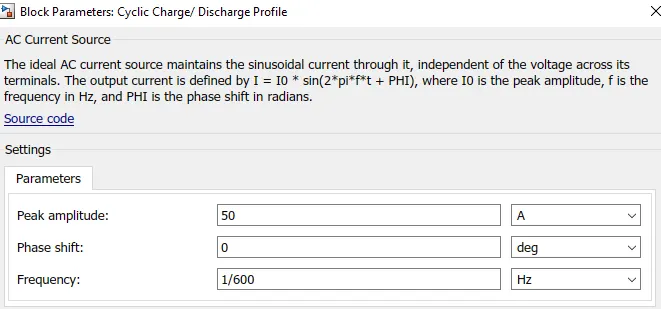
- AC current source block is used for the charge/discharge cycle
Simulation and Results
case 1: when ambient, cell packs temperature are the same 293 K. the current peak amplitude in the AC source block = 50 A
Temperature
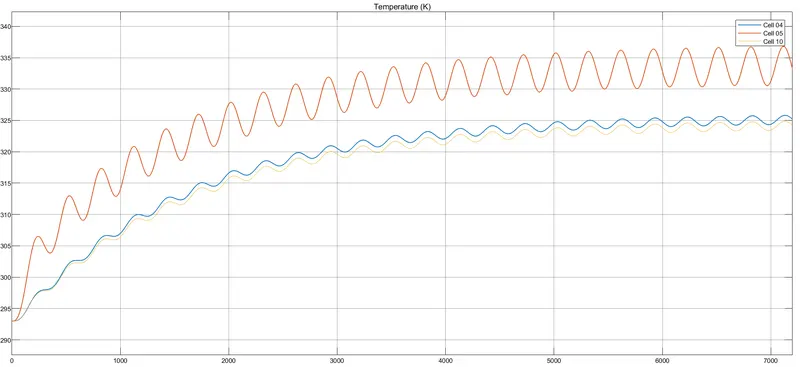
- Initially, all the packs start with 293 K
- according to the charge/discharge cycles, the temperature of the packs are varied
- we can observe that cells 4 and 10 follow the same pattern reaching a maximum temperature of 325 K
- the faulty cell 5 shows a different pattern and reaches a maximum temperature of 336 K which will impact the overall performance of the total battery pack.
SOC
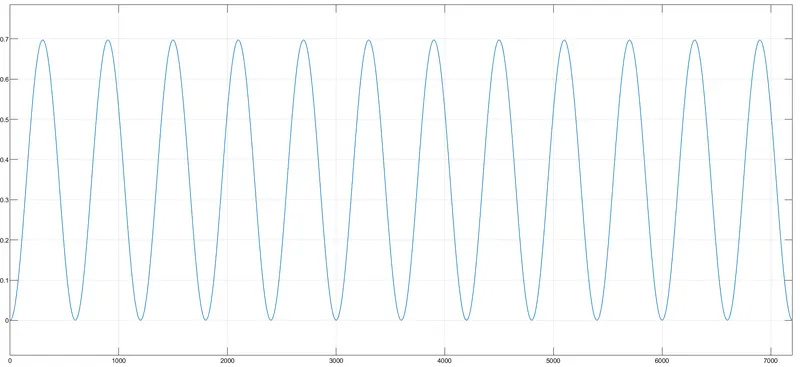
- here one charging+discharging cycle takes 600 sec
- with a current peak amplitude of 50A, SOC varies from 0 - 70 %
CONDUCTION (cell 4-5)
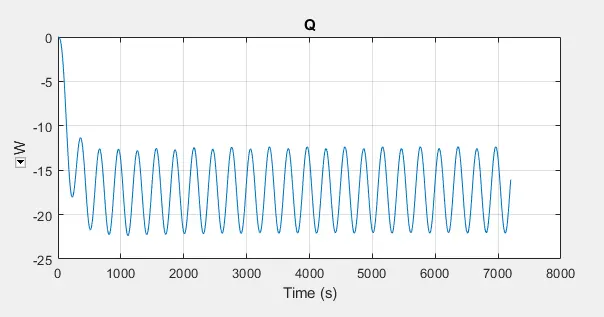
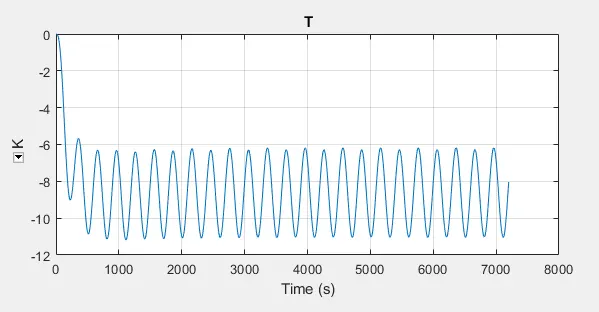
- here the heat conduction and temperature difference between the (first pack) cell 4 and (second pack) cell 5 are plotted.
- the heat conduction during charging is around -12W and during discharging is around -22W.
- the negative sign indicates the heat transferred (direction) from cell 5 to cell 4. since cell 5 had a higher temperature due to the fault conditions.
- the temperature difference during charging is around -6K and during discharging is around -11k
cell 5-6
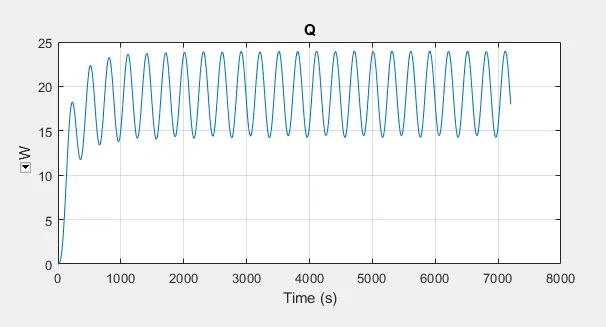
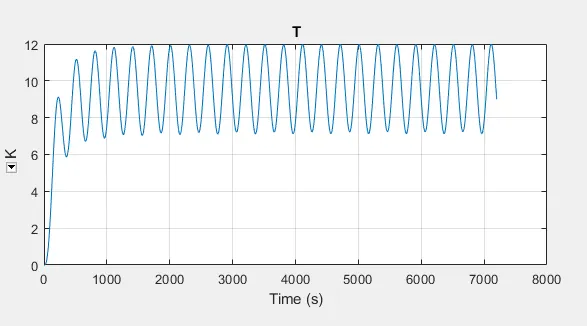
- here we can observe positive values since the heat transfer direction is from cells 5 - 6
- the heat conduction during charging is around 24W and during discharging is around 15W
- the temperature difference during charging is around 12K and during discharging is around 7K
CONVECTION (heat transfer through molecules of gases and liquid)
Ambient - cells 1-4
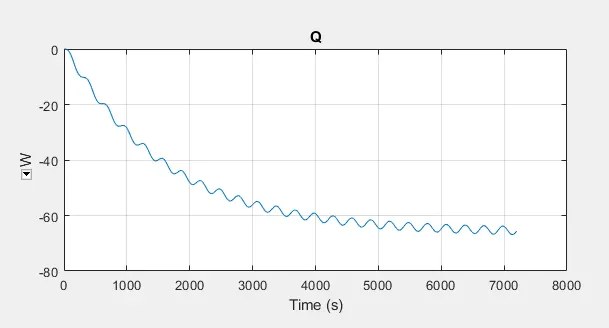
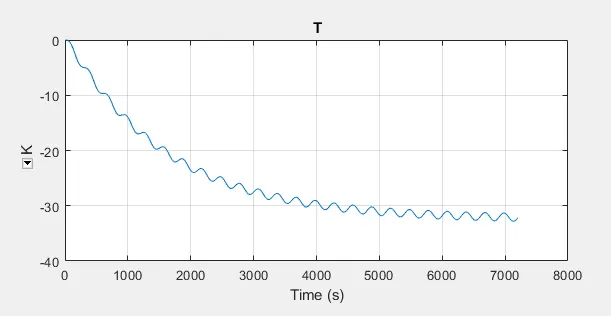
- at the end of the simulation, the heat convection is about -68W and the temperature difference is about -32K
Ambient - cell 5
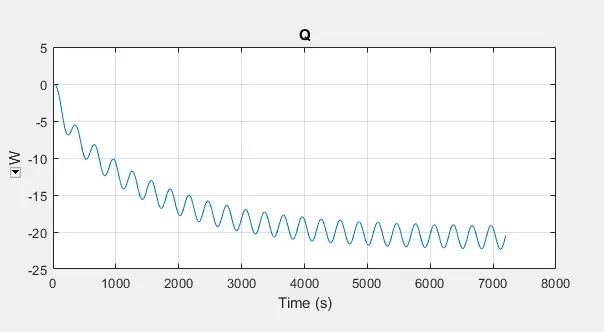
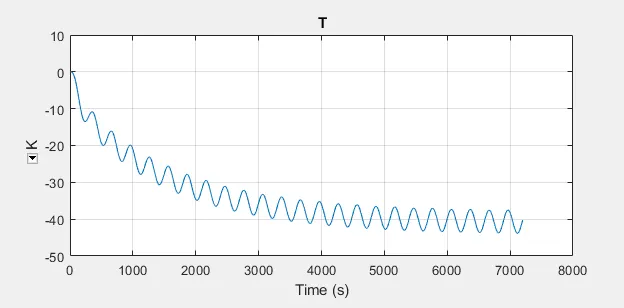
- at the end of the simulation, the heat convection is about -21W, and the temperature difference is about -41K
Ambient - cells 6-10
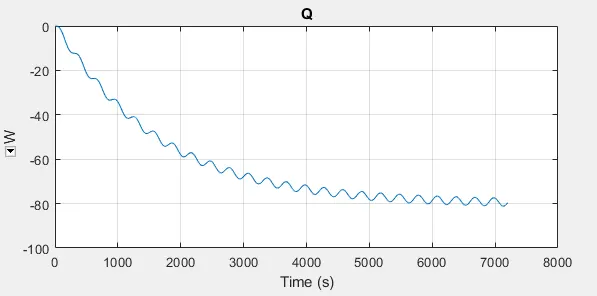
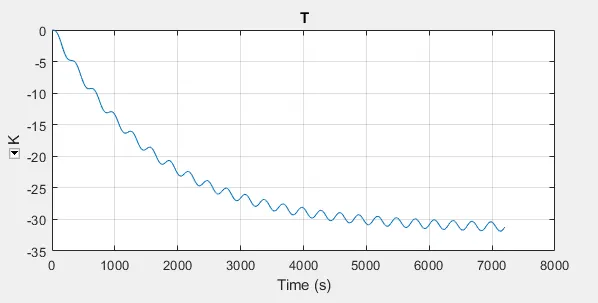
- at the end of the simulation, the heat convection is about -80W and the temperature difference is about -32K
the temperature difference is different with ambient-cell 5 when compared to the others
charge/discharge cycle:
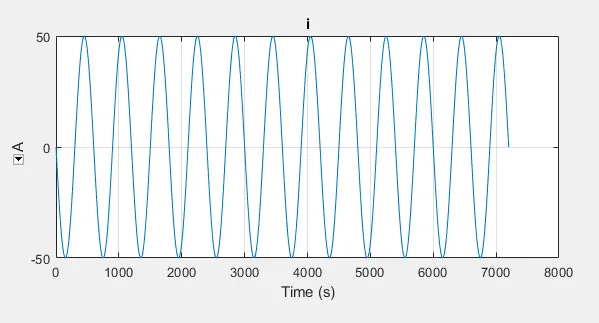
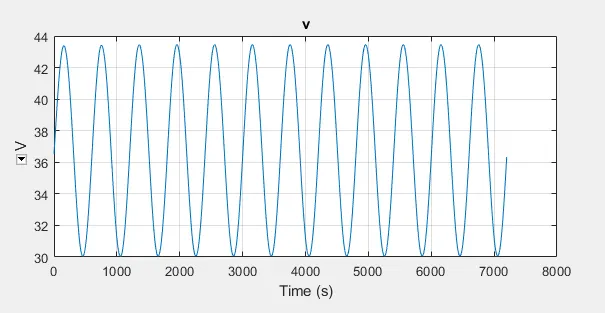
- we can observe the current values varying from -50 to 50 A (charging/discharging)
- the voltage varies from 30 to 43 V
case 2: when ambient temp = 300K, cell 1-4 = 295K, cell 5 = 320K, cell 6-10 = 310K, and the current peak amplitude in the AC source block = 40 A
Temperature
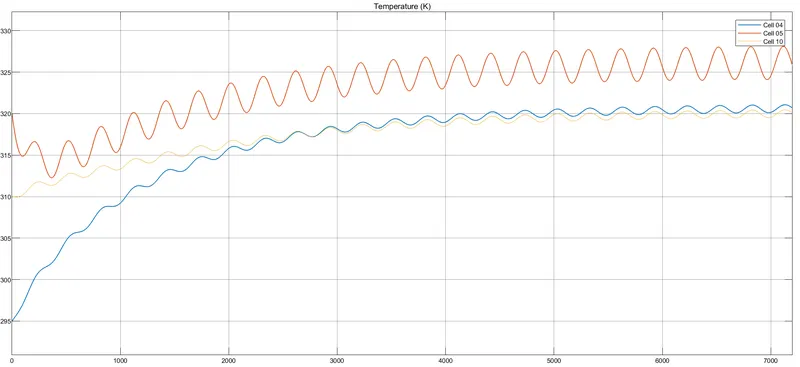
- Initially, cell4 starts at 295K, cell5 starts at 320K, cell 10 starts at 310K
- we can observe that at 2000 sec, cells 4 and 10 are temperature balanced and follow the same pattern reaching a maximum temperature of 320 K
- the faulty cell 5 shows an initial decrease and raises to a maximum temperature of 326 K.
SOC
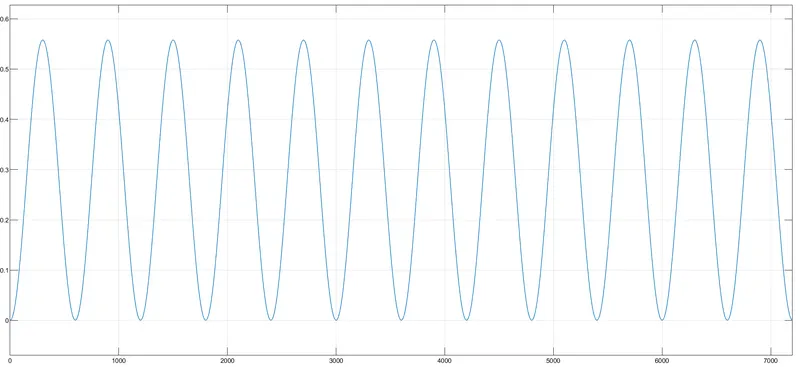
- here one charging+discharging cycle takes 600 sec
- with a current peak amplitude of 40A, SOC varies from 0 - 55 %
CONDUCTION (cell 4-5)
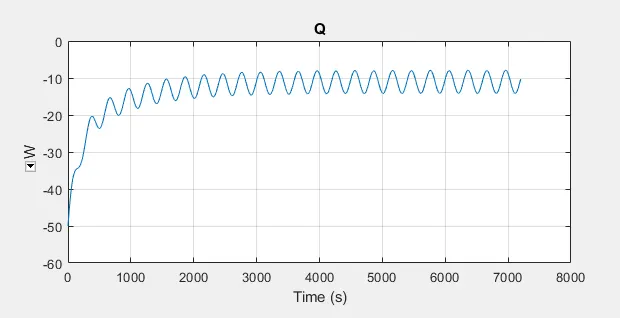
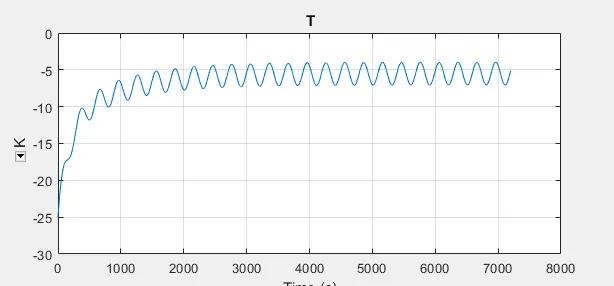
- here the heat conduction and temperature difference between cell 4 and cell 5 are plotted.
- the heat conduction during charging is around -9W and during discharging is around -14W.
- the temperature difference during charging is around -4K and during discharging is around -8k
cell 5-6
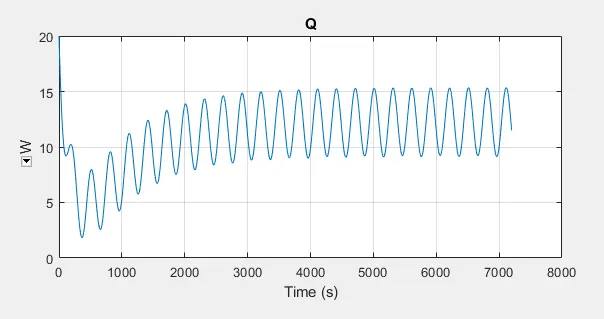
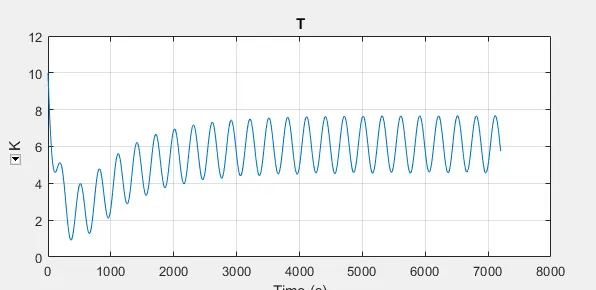
- the heat conduction during charging is around 15W and during discharging is around 9W
- the temperature difference during charging is around 8K and during discharging is around 4K
CONVECTION (heat transfer through molecules of gases and liquid)
Ambient - cells 1-4
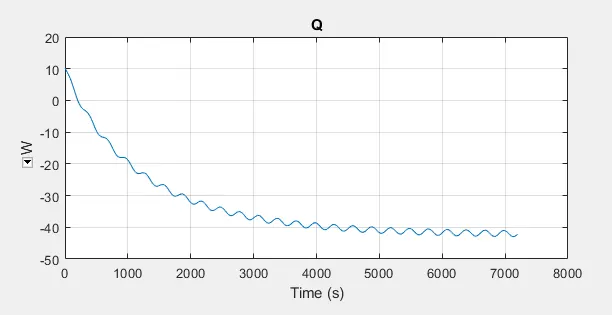
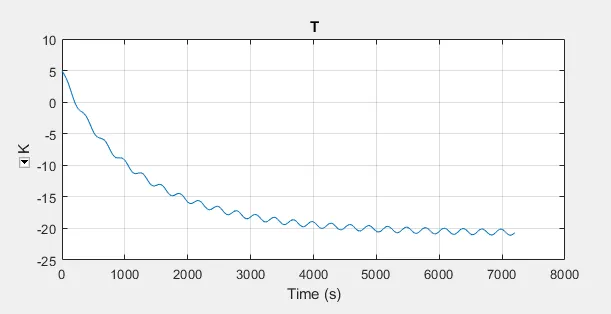
- at the end of the simulation, the heat convection is about -41W, and the temperature difference is about -21K
Ambient - cell 5
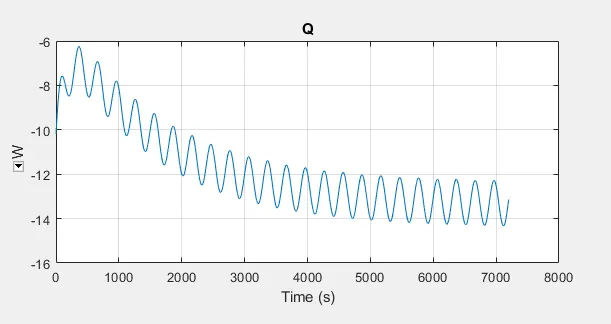
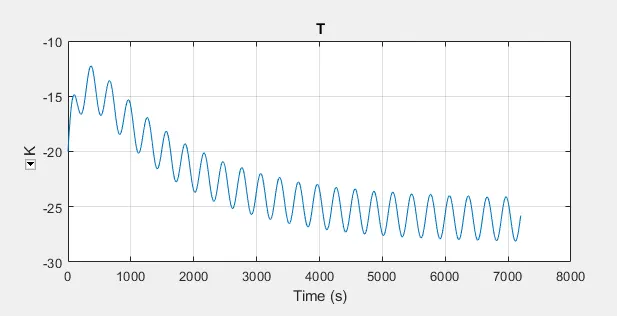
- at the end of the simulation, the heat convection is about -13W, and the temperature difference is about -26K
Ambient - cells 6-10
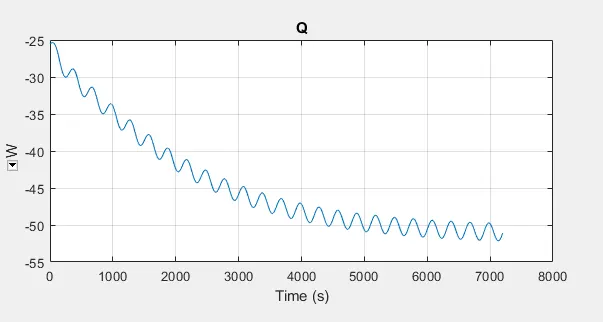
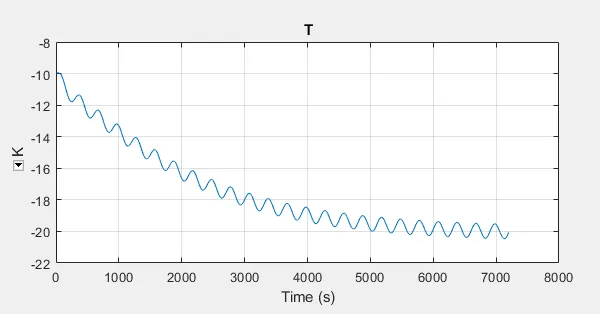
- at the end of the simulation, the heat convection is about -52W and the temperature difference is about -20K
the temperature difference is different with ambient-cell 5 when compared to the others
charge/discharge cycle:
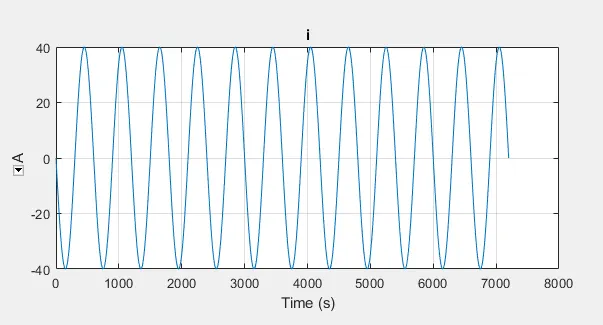
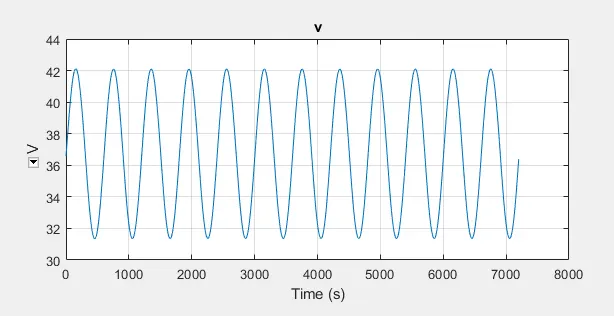
- we can observe the current values varying from -40 to 40 A (charging/discharging)
- the voltage varies from 31 to 42 V
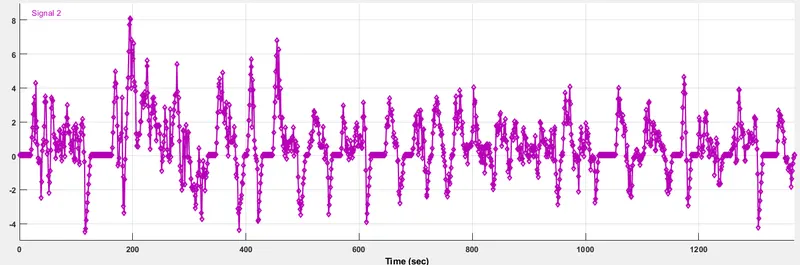
Using UDDS current profile
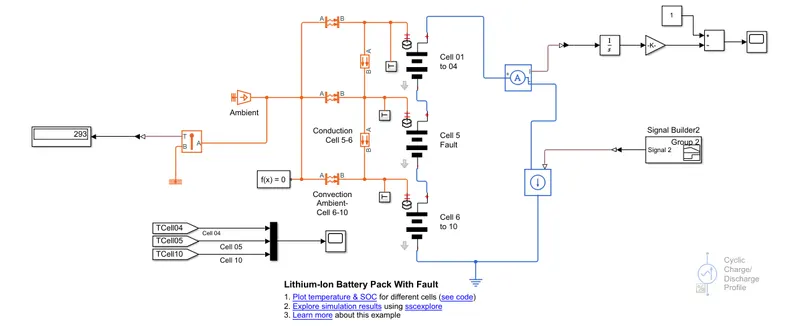
- the UDDS current profile is given as drive cycle input through a controlled current source
- the SOC here is initially considered as 1
- all the ambient, cell packs temperature are the same 293K
- the simulation time is 1400 sec
Input signal builder
Simulation and Result
Controlled current source
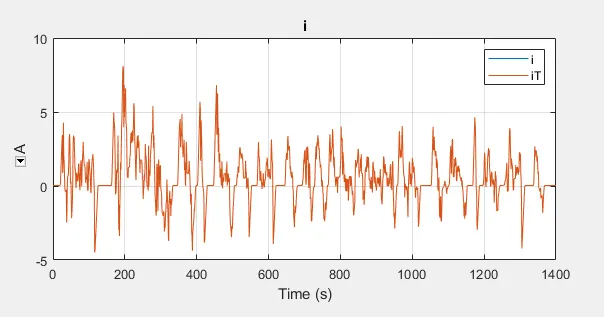
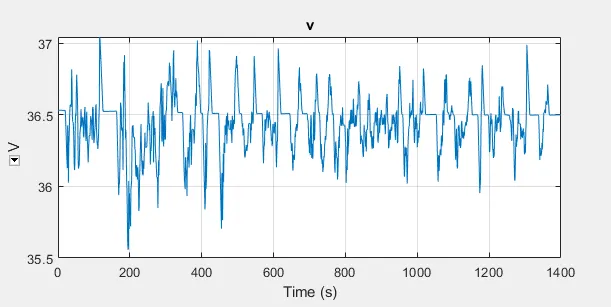
- the current profile matches the UDDS cycle. negative current indicates charging and positive current indicates discharging
- the voltage varies between 35.5 to 37 V
Temperature
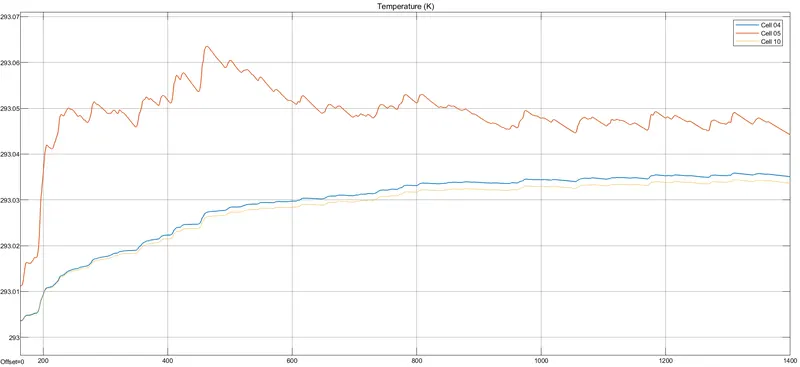
- Initially, all the packs start with 293 K
- according to the UDDS current profile, the temperature of the packs are varied
- we can observe that cells 4 and 10 follow the same pattern while cell 5 is different due to the fault condition
- cell 5 achieves a higher temperature than the others
SOC
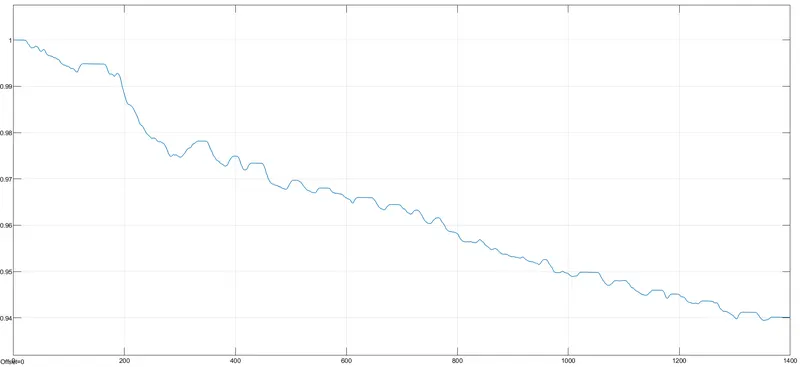
- for the UDDS current profile, SOC is reduced to 94%
CONCLUSION
- the thermal modeling of 10 cell series lithium-ion battery model for various temperatures, charge/discharge profiles are simulated.
- the results for temperature, SOC, conduction, convection, current, voltage are plotted, analyzed, and explained.
Gdrive attachments: https://drive.google.com/file/d/1XdBj9pbvuSZY2mmeQt60-1w7Cdplds8w/view?usp=sharing