Project 2 Thermal modeling of battery pack
AIM: -
To simulate the thermal effects and compare life cycle performance at various temperatures, charge & discharge rates for a 10 cell series lithium-ion battery model, using MATLAB.
Objective: -
1) To connect 10 Lithium cells in series to form a battery pack.
2) Observe SOC variation with respect to cyclic charge and Discharge.
3) To simulate the thermal effects and compare life cycle performance at various temperatures.
Theory: -
Need for Battery Modelling
An accurate forecast of the remaining driving range of an electric vehicle (EV) is crucial to avoid range Drivers need to know how much further they would travel before their vehicle batteries require a recharge. In addition, the battery management system should predict when batteries need replacement. The remaining charge calculation must be precise to utilize the battery's full capability. The state of charge (SOC) of a battery or pack of batteries is analogous to a fuel gauge of a conventional vehicle.
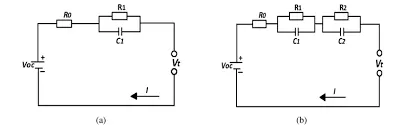
Equivalent circuit modeling is the most common approach for battery numerical analysis. For lithium cells, a one or two RC block model with no parasitic branch is a common choice. It has the advantage of being computationally simple and is easily combined with other methods such as coulomb counting with an OCV/SoC correlation for periodic recalibration during rest.
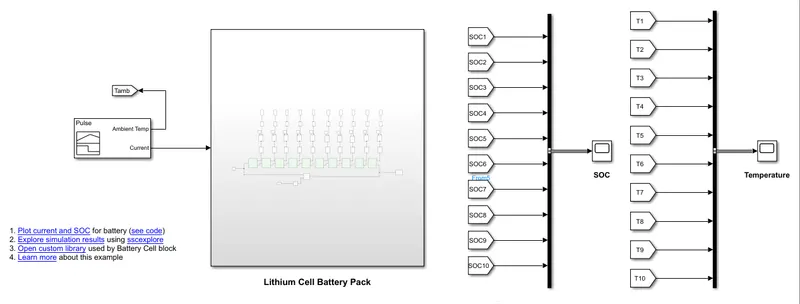
The built-in model for the Lithium-Ion Battery pack in series with 10 cells is shown below.
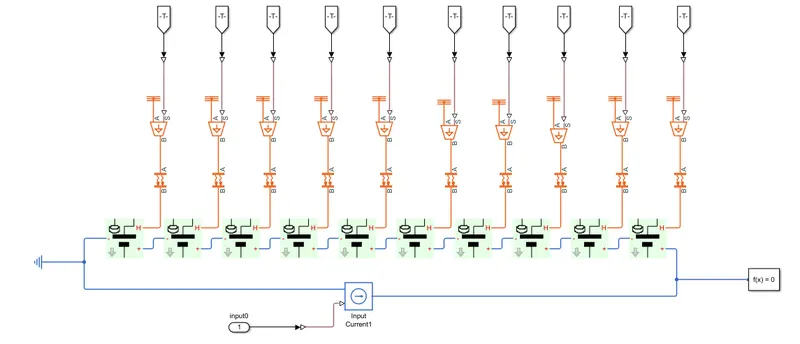
As we can see in the above model 10 lithium cells are connected in series. The input to the Battery pack is given by the Current Source which comes from the signal builder. For Temperature control there is a Controlled Temperature Source that has two inputs, one is from the signal builder as Ambient temperature which is to be maintained as 20 deg Celcius throughout and the other input is to the Thermal reference. Also, we use the Convective heat transfer method for heat transmission in the battery.
Convective Heat Transfer- The heat transfer from surrounding.
Signal Builder-
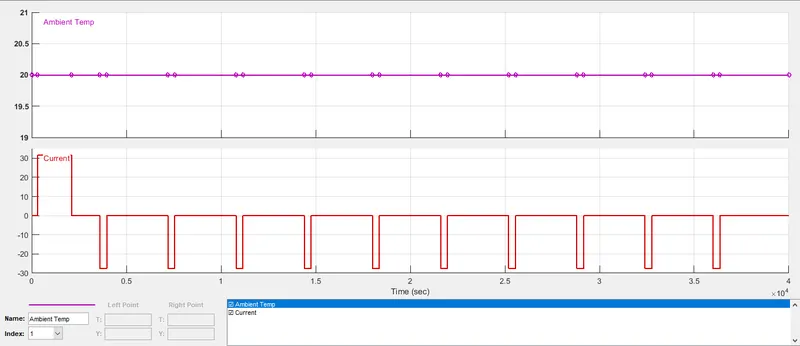
In signal builder we can see that, Ambient temperature is constant and current is charging and discharging.
Lithium Cell 1RC branch equivalent circuit-
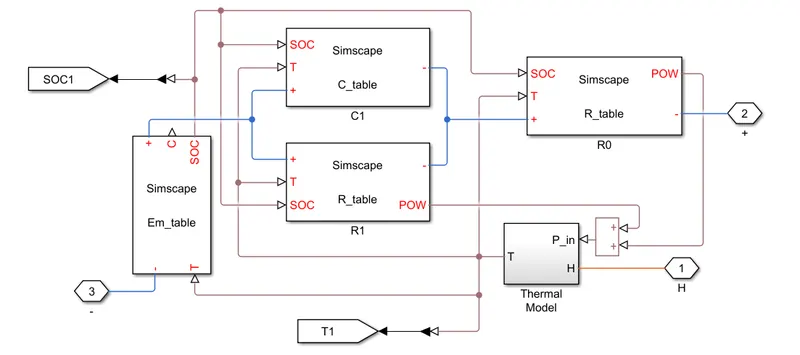 This block basically consists of capacitance value table which depends on an external physical signal inputs SOC and T. It is assumed that the capacitance value is slowly varying with time, and hence the equation i= C*dv/dt holds. Resistance value (R) table which depends on an external physical signal inputs SOC and T.
Thermal Model-
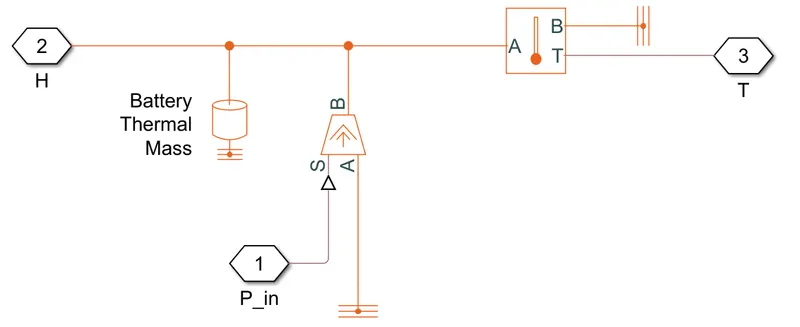
The important blocks inside the thermal model subsystem are:
- Thermal reference: This block represents a reference point in a thermal network where the temperature is equal to absolute zero.

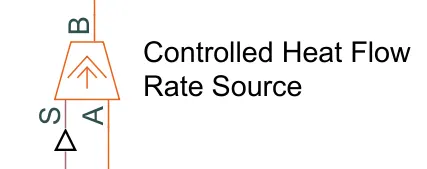
- Controlled Heat Flow Rate Source: This block represents an ideal energy source in a thermal network that can maintained a controlled heat flow rate regardless of the temperature difference. The heat flow rate is set by the physical signal port S. A positive heat flow rate flows from port A to port B.
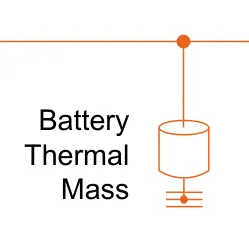
- Thermal mass: This blocks models internal energy storage in a thermal network. The rate of temperature increase in proportion to the heat flow rate into the material and inversely proportional to the mass and specific heat of the material.
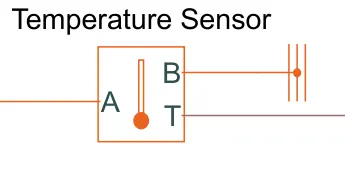
- Temperature sensor: This block measures the temperature in a thermal network. There is no heat flow through the sensor. The physical signal port T reports the temperature difference across the sensor. The measurement is positive when the temperature at port A is greater than the temperature port B.
Measurment of Temperature and SOC-
To measure SOC and Temperature of each cell we use goto and from tags and attched with bus creator with the Scope.
Final Simulation model looks as follow
Result : -
Simulation running for 40000 sec
Case 1: - When all cells are have same ambient temperature at input with current source
SOC plot-
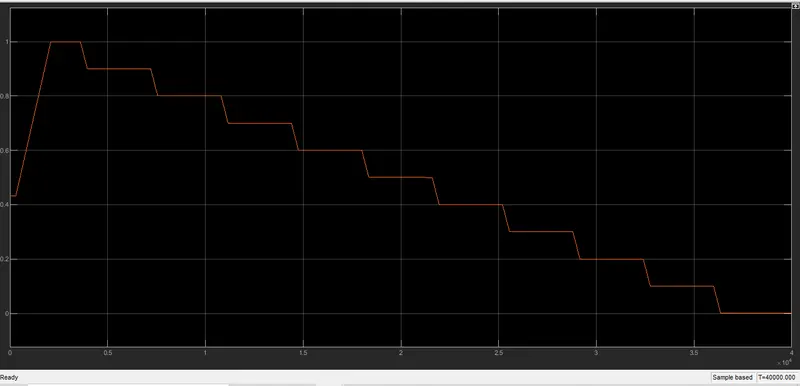
From SOC plot it is seen that as current value changes the Charging and Discharging happens. We provide charging at starting and then Discharging, but there is difference in cell temperature due th that all cells SOC variation is same.
Temperature Plot-
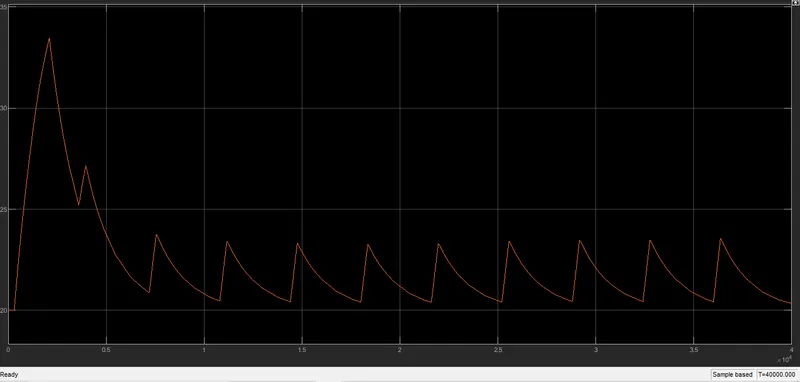
In temperature plot we can say that at starting due to current increasing meance charging the temperature also increases and the while discahrging it decreases. But due to same temperature in all cell no difference can be seen.
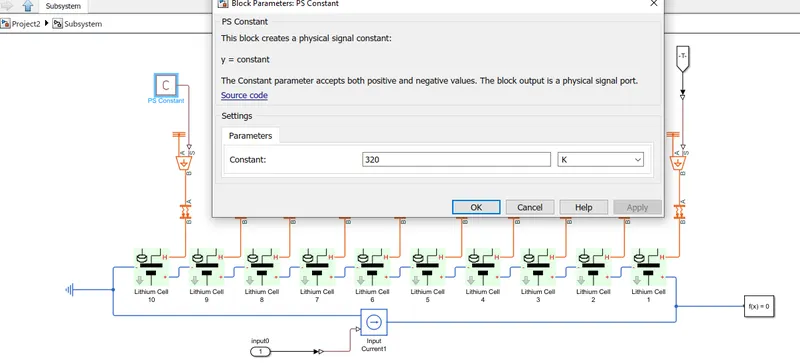
Case 2: - When cell no 10 has different temperature by connecting PS Constant block having temperature of 320 K and observe the result.
Now intentionally we provide fault like or abnormal condition at cell 10 by increasing its temperature and observr the result,
SOC plot-
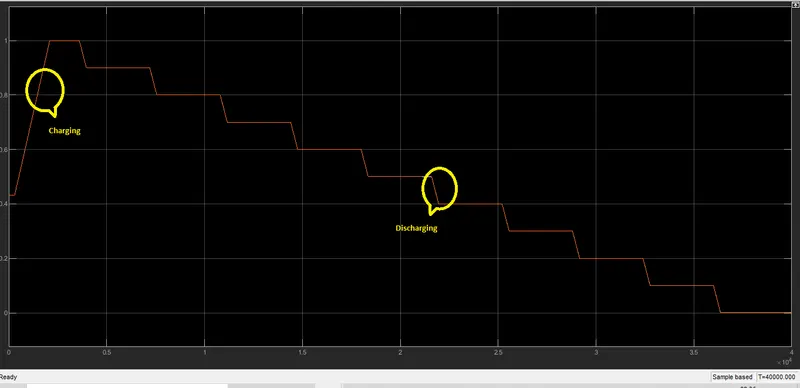
The SOC plot shows some changes while charging and discharging. We observe that changes.
While focusing on Charging
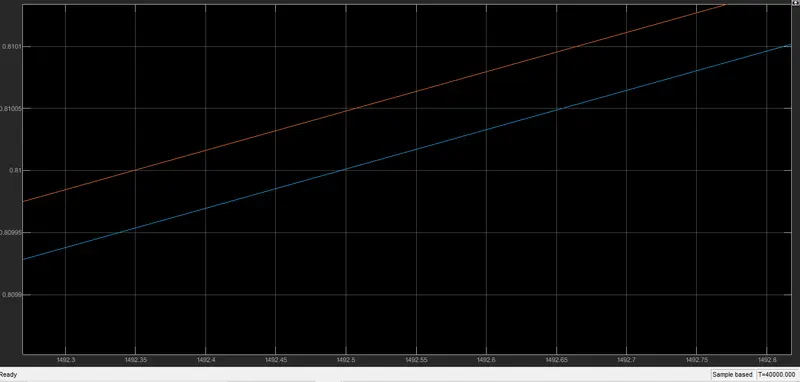
Here we can see that red one is for cell 10 and blue one is for remaining all, SO by seeing this plot we conclude that when temperature increases in perticular cel that cell charing rate increases than normal once.
Now Focus on Discharging-
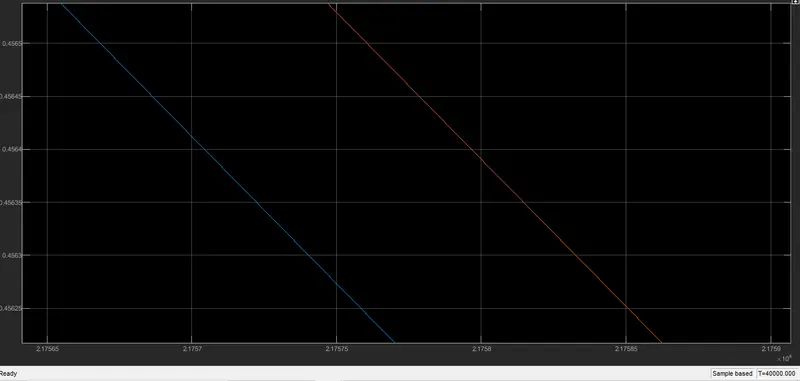
While focusing on the Discharing cycle we observe that due to change in temperature the faulty or abnormal cell discharging rate increases.
Temperature Plot-
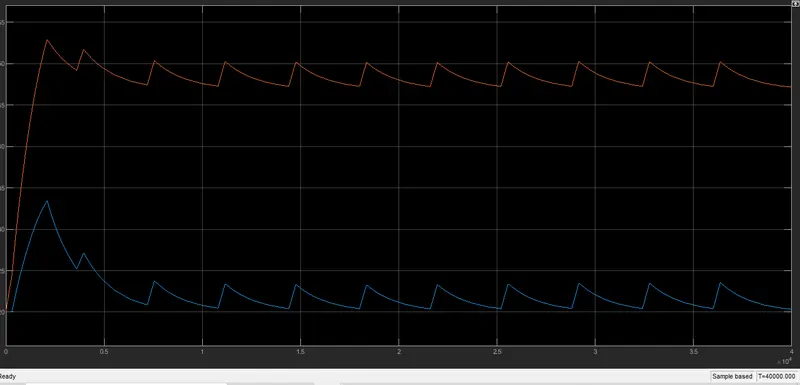
Temperature plot show variation in temperature Red one is for cell 10 and blue is for other cell.
Conclusion:-
- In the case 1, the temperature of each cell is same and SOC of each cell is also same.
- In case 2, cell 10 has the different temperature, then the SOC is also different for and has slight difference.
- The cell with the higher temperature has the highest charging and the discharging rate.
- And the cell with the lowest temperature has the lowest charging and the discharging rate.
- The cell with higher temperature has the higher SOC and the cell with the lower temperature has the lowest SOC.
Reference: - https://in.mathworks.com/help/physmod/simscape/ug/lithium-battery-cell-one-rc-branch-equivalent-circuit.html