Week - 4
Que 1)
Implement control logic of a “washing machine” using Stateflow as per given sequence:
- If the power supply is available, the system gets activated
- If the Water supply is not available, stop the process & indicate through LED
- Soaking time should be 200s followed by Washing time of 100s.
- Then rinsing happens for next 20s & dryer runs for 50s
After all the processes have completed turn on the finished LED
Answer
Washing Machine - A machine use to wash the cloths with different settings like Washing, Soaking, Rinsing, Drying and all.
The model for Stateflow and chart of washing machine is given below.
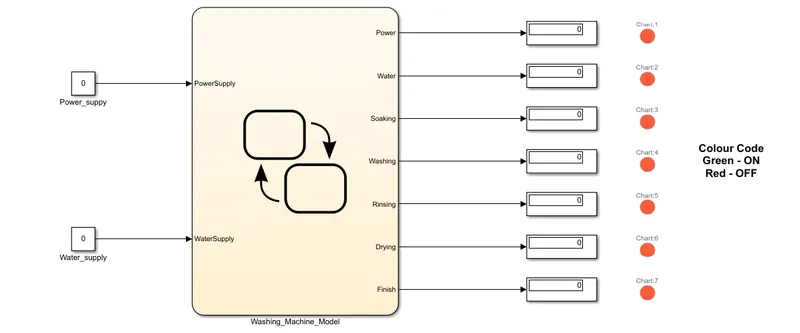
Here we can see that as conditions mention in given data we full all that.
For input we provide signals like Power Supply and Water Supply, while for output port we take Power, Water, Soaking, Washing, Rinsing, Drying, Finish, etc.
Inside the chart we can see that,
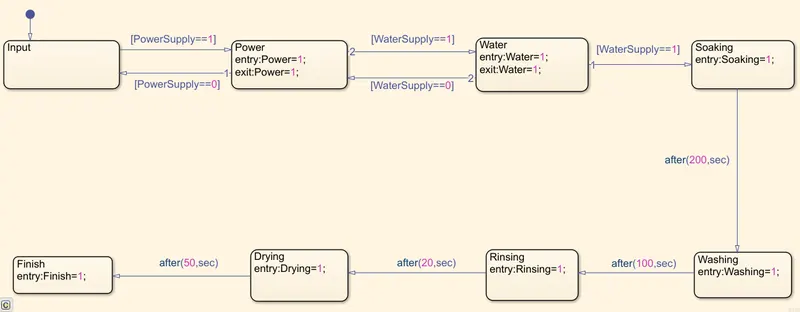
Condition
- If the power supply is available, the system gets activated.
- If the Water supply is not available, stop the process & indicate through LED.
- Soaking time should be 200s followed by Washing time of 100s.
- Then rinsing happens for next 20s & dryer runs for 50s.
Case 1 - When both Power & Water signals are zero or off.
As seen in above fig. we observe that if both sig are off then at outport all system is shut down because power is off.
Case 2 - If the power supply is available, the system gets activated & If the Water supply is not available, stop the process & indicate through LED.
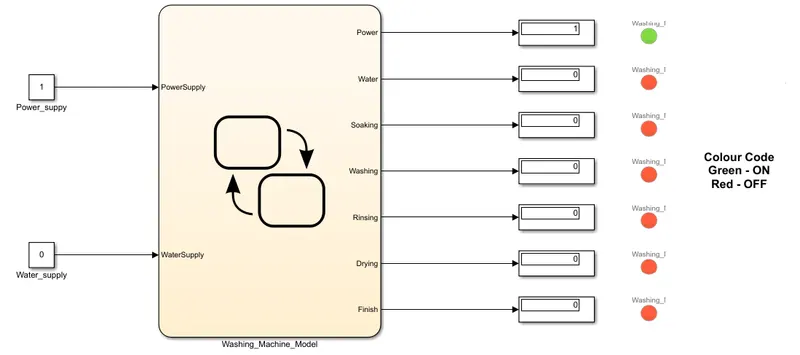
When power is given then system is Activated, and also water supply is off then process returns to stop as we see in 2nd LED light.
Case 3 - When both Power & Water signals are provide.
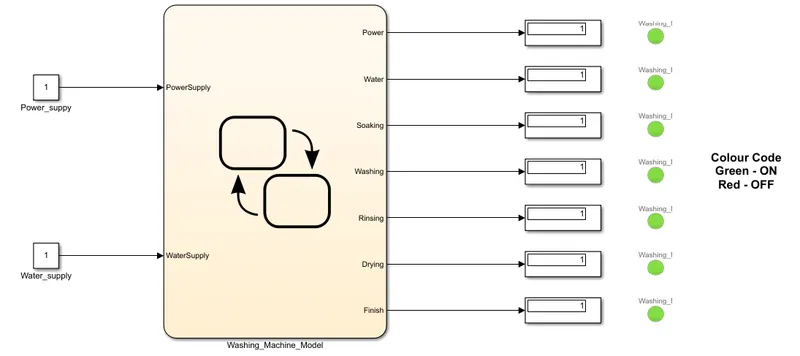
When both Power & Water signals are ON then all system working properly and all LED Lights are blinking properly.
File attached
Stateflow_WashingMachine.slx
Que 2)
Make a Simulink chart for the “Gear shift” logic as per below conditions:
Speed Range(kmph) Gear
0 to 15 1
16 to 25 2
26 to 40 3
41 to 60 4
Above 61 5
Give speed input while the simulation is running & display the gear number.
Answer
Gear Shift Operation - In vehicle, As speed increase we have to shift gear for smooth operation of vehicle and vice-vegearrsa. To display this structure we develope a model which is given below.
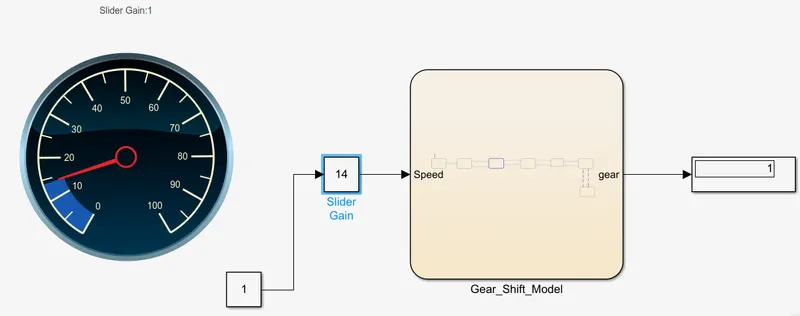
Components Used
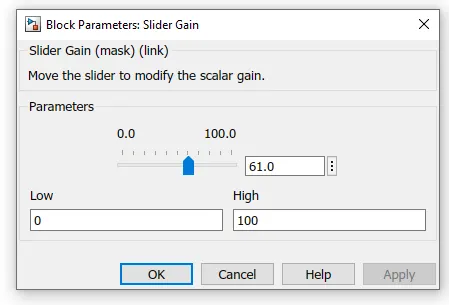
1) Slider gain- use to show speed virtually in speedometer.
2) Constant- To add constant value here.
3) Slider Gain- To increase speed from 0-100 km/h
4) Chart- To make Stateflow Model of gear shift operation.
5) Display- To show which gear right now activated.
Condition
Speed Range(kmph) Gear
0 to 15 1
16 to 25 2
26 to 40 3
41 to 60 4
Above 61 5
Inside chart we can see the Gear shift Model the state flow diagram which is given below.
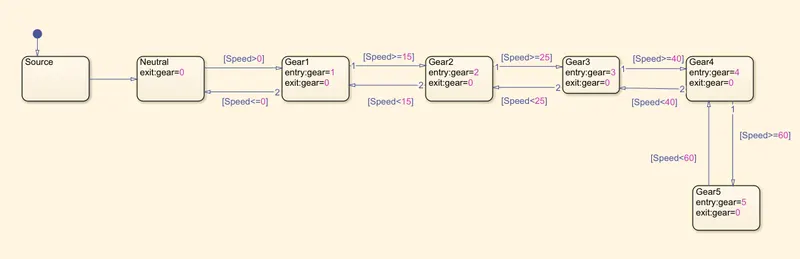
In chart the Gear shift is seen in form of the state and we specify the conditions for the changind that staes in belween the blocks.
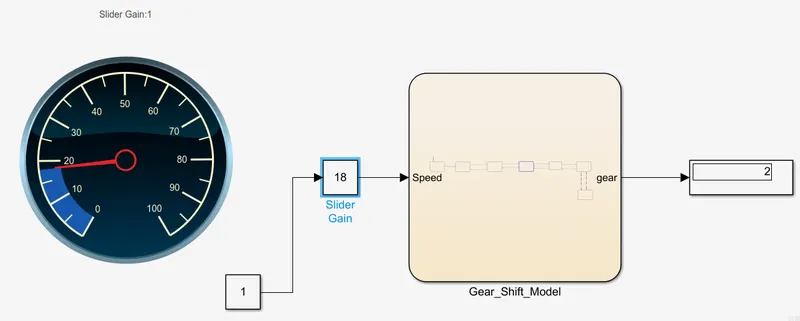
Case 1) When speed is 18 km/h then display should show gear 2 that we see in display block.
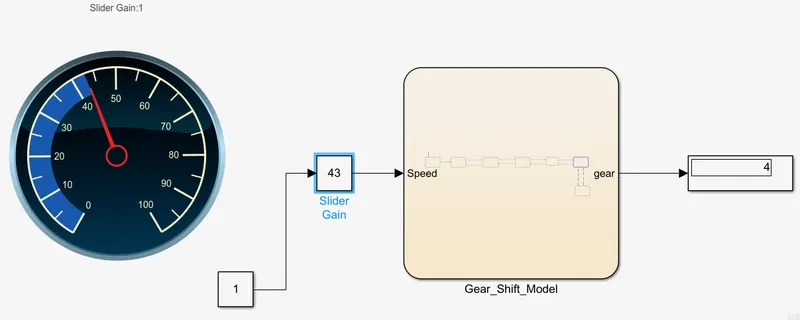
Case 2) When speed is 43 km/h then display should show gear 4 that we see in display block.
Case 3) When speed is 33 km/h then display should show gear 3 that we see in display block.
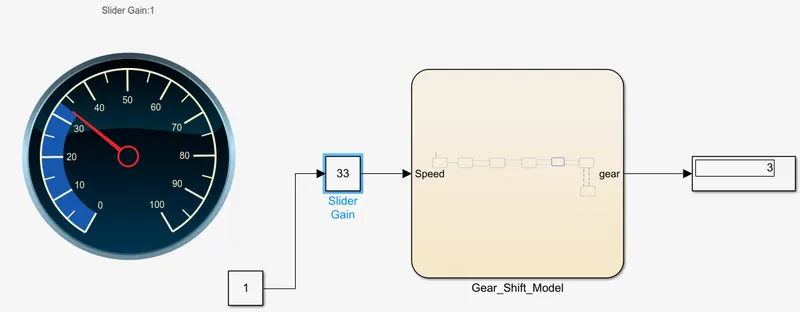
here we reduce the speed using slider gain thats why gear is shift to 4 to 3.
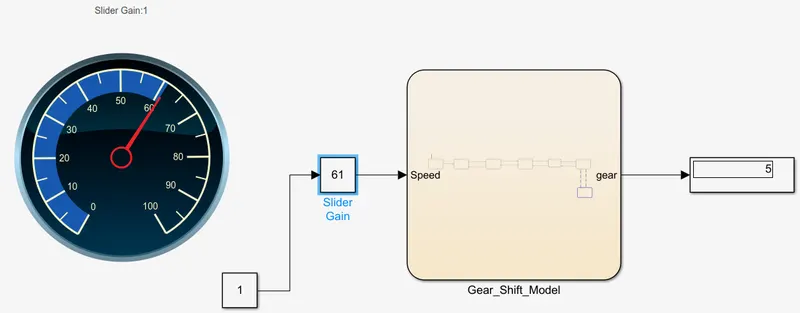
Case 4) When speed is above 61 km/h then display should show gear 5 that we see in display block.
Slider Gain -
File attached
GearShift.slx