Project 2 Thermal modeling of battery pack
Thermal modeling of battery pack :
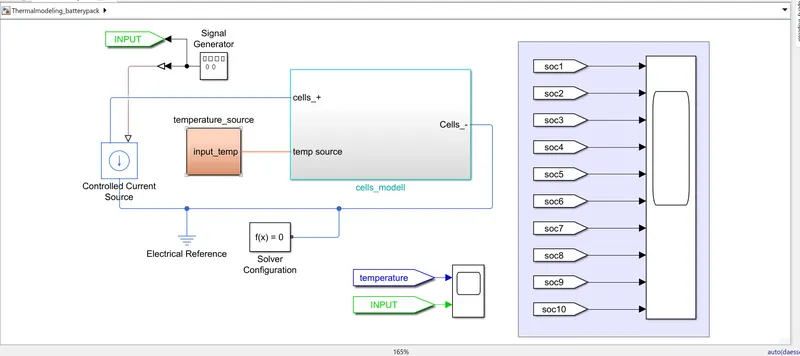
THe model shown below is the Thermal modeling of battery pack model.
The model mainly consists of temperature source subsystem.
cell model subsystem, and controlled current source , signal generator block .
And electrical reference , solver configutration block , tags (goto &from),scopes.
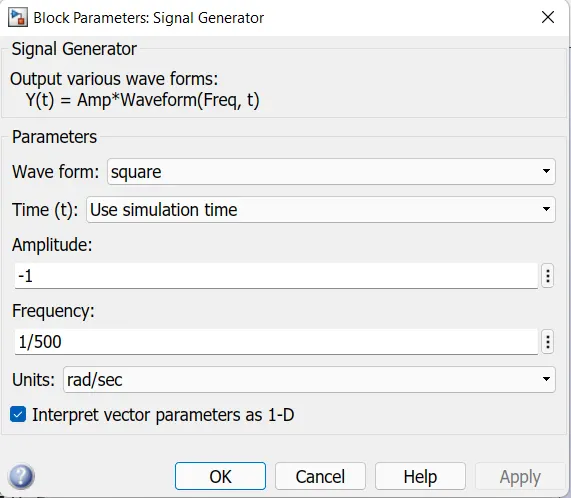
Signal generator data :
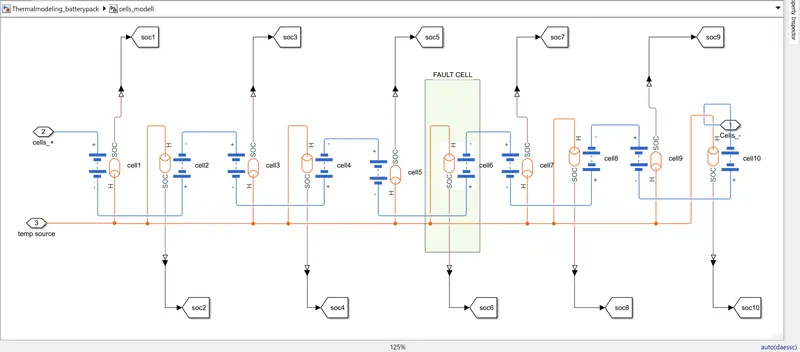
The cells subsytem model :
It mainly consists of 10 table based batteries .
The table based battery gives the soc value directly.
All these batteries or cells are connected in series .
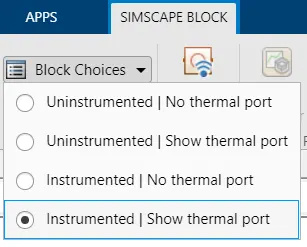
The batteries are set to be instumented and thermal ported.The image shown below.
All the cells soc are taged using the goto tags.
And named as soc1 .2 3 and so .
The cell6 is named named as fault cell and highlighted.
The thermal port is given with external source.
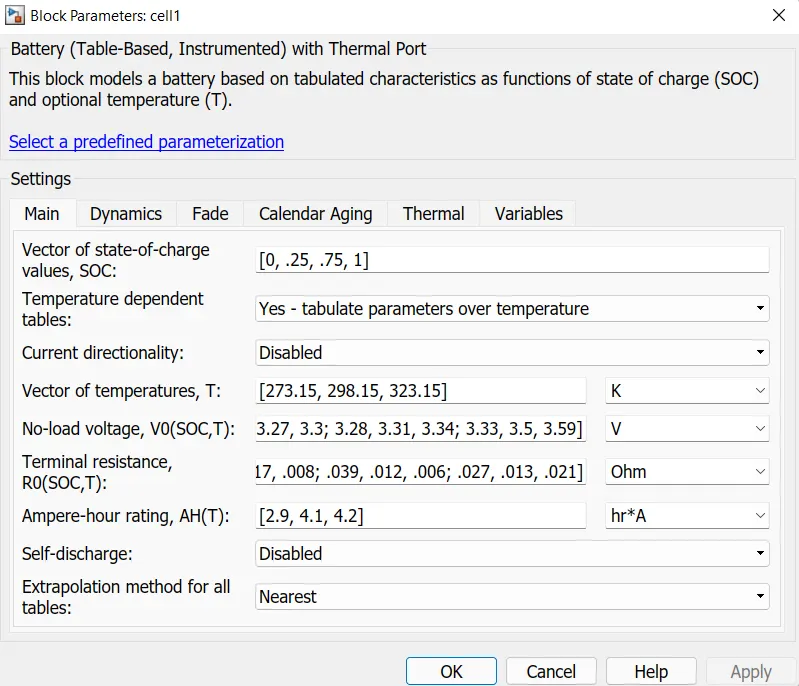
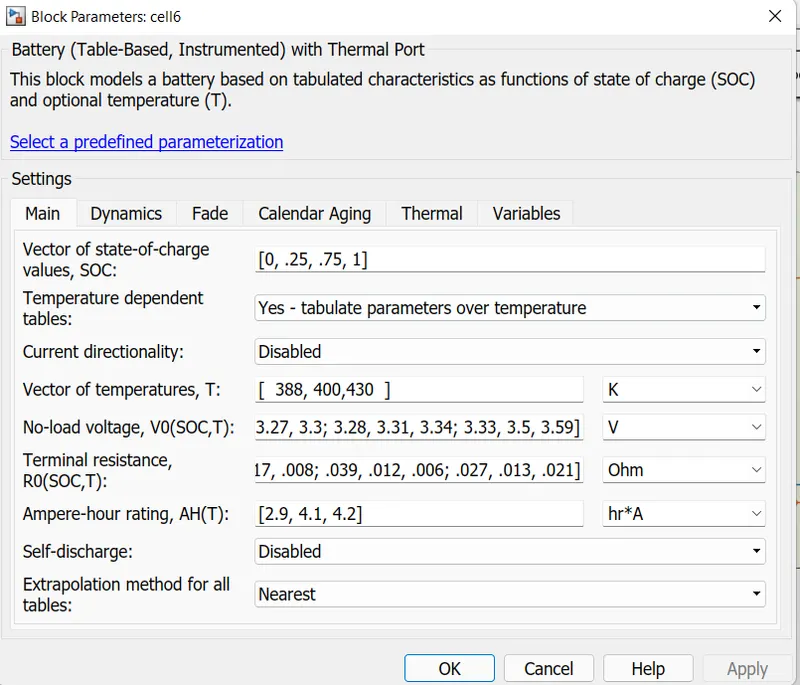
The cells configuration are shown below:
The 9cells of the model is configured as 1 image parameters except 6th cell.
The 6th cell is configured as second image.
The diffrence is vector of temperature for fault creaation.
Temperature source model :
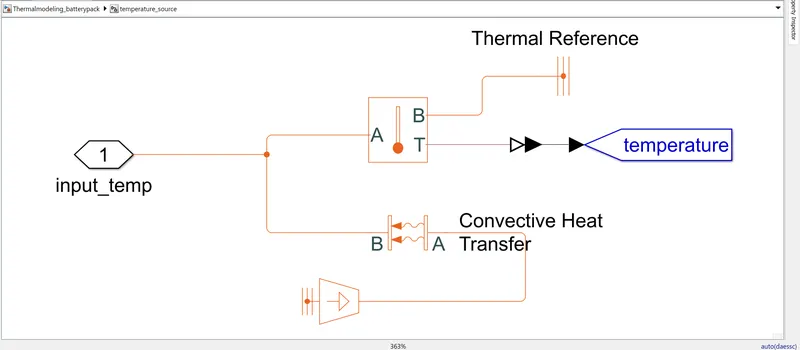
The model consists of temperature source ,convective heat transfer ,
Temperature sensor and ,ps to simulink converter and tags .
The configuration of diffrent blocks shown below.
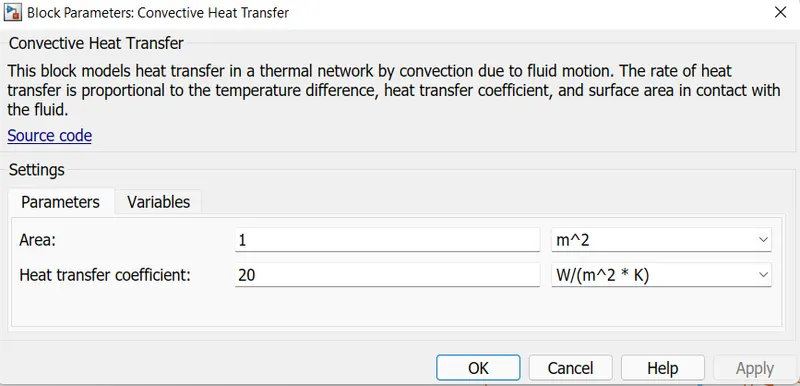
convective heat transfer confiuration :
The area of temperature affected is 1m^2
And heat transfer co efficient as 20.
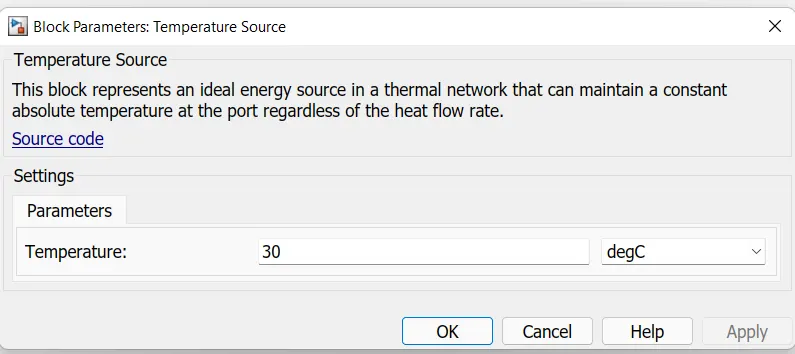
Temperature source configuration :
This block is used to generate the temperature in cells .
This helps to study the temperature effect on battery pack.
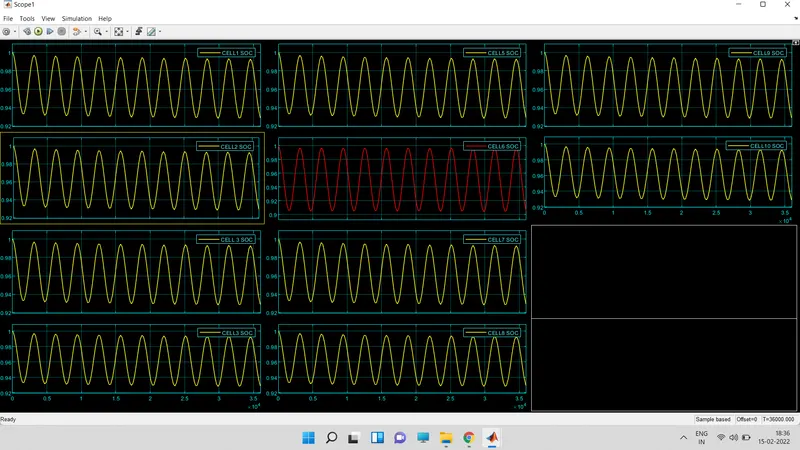
The cells soc plot :
The plot shows the all cells soc below.
All cells soc are oscillating between 100 to 93%
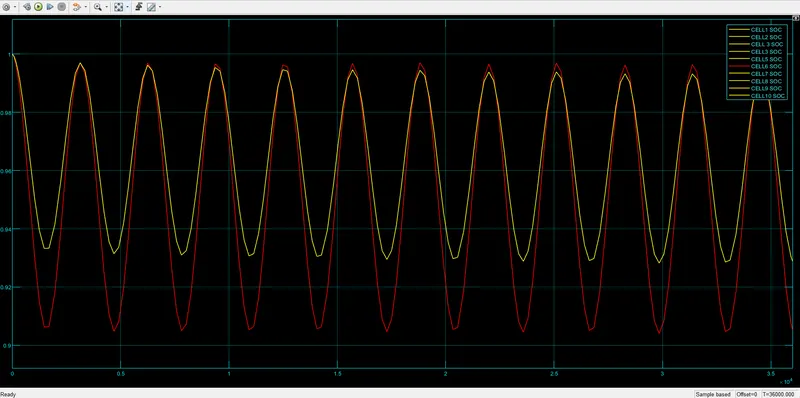
But the cell6 soc drops to 90% from 100% due to its high temperature.
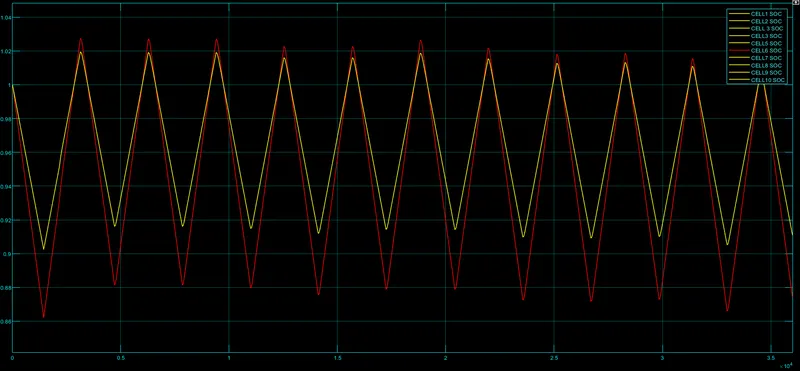
The same plot shown in single layout , we can clearly observe the diffrence between cell 6 and remaining cells soc :
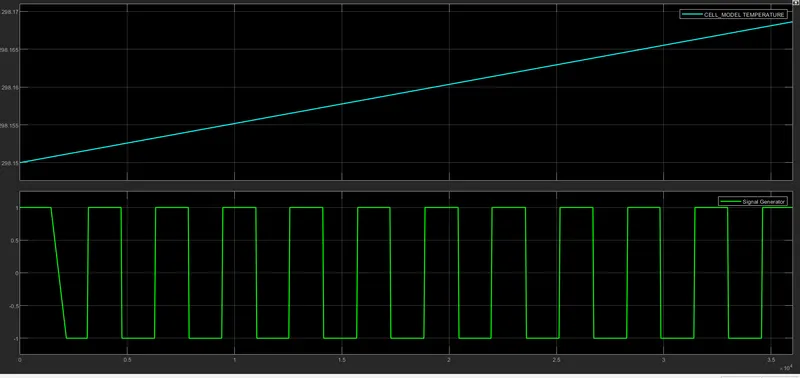
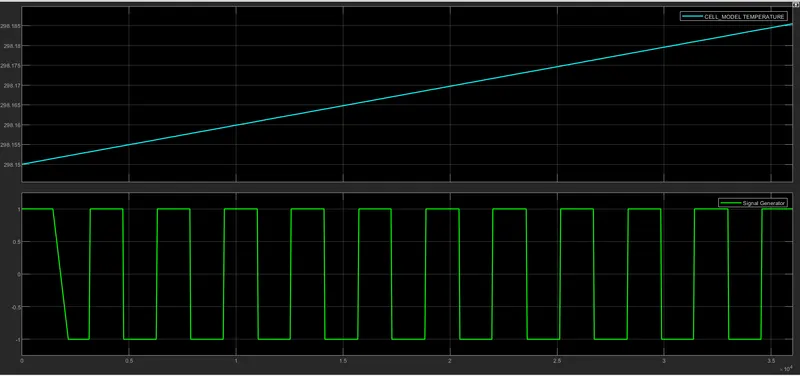
The input signal and battery temperature plot :
The Input shonwn below plot which is oscillating -1 and 1.
The battery temparature is incresed to 298.165 from 298.15.
case 2 : when input temperature increse to 100degrees.
All cells soc are oscillating between 100 to 90%
But the cell6 soc drops to 86% from 100% due to its high temperature.
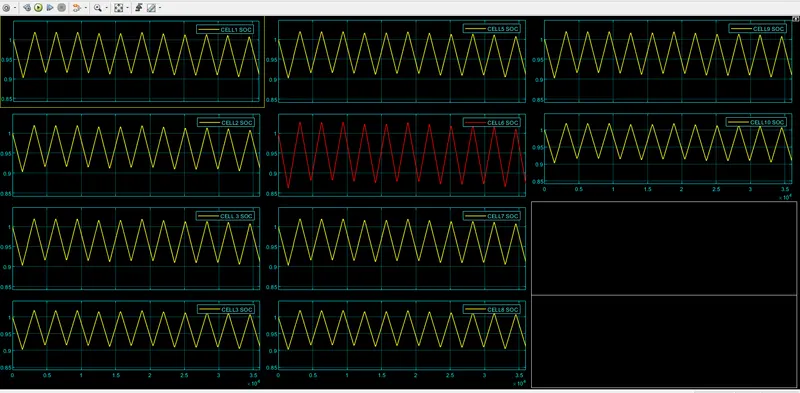
The same plot shown in single layout , we can clearly observe the diffrence between cell 6 and remaining cells soc :
The input signal and battery temperature plot :
The Input shonwn below plot which is oscillating -1 and 1.
The battery temparature is incresed to 298.185 from 298.15.
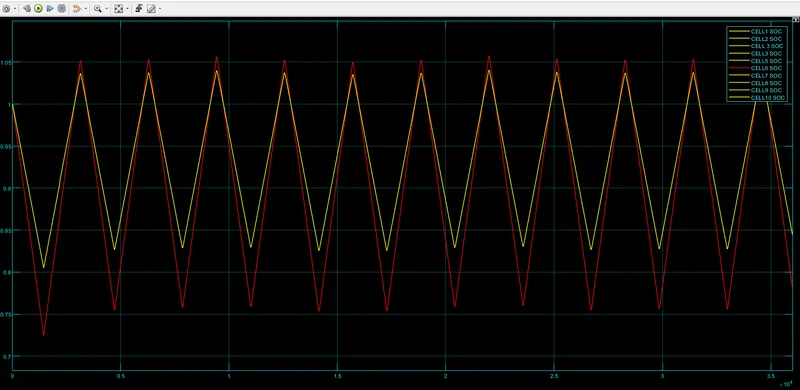
Diffrent discharge rate :
intially the signal generator is set for 1 amplitude now it is set to amplitude 2.
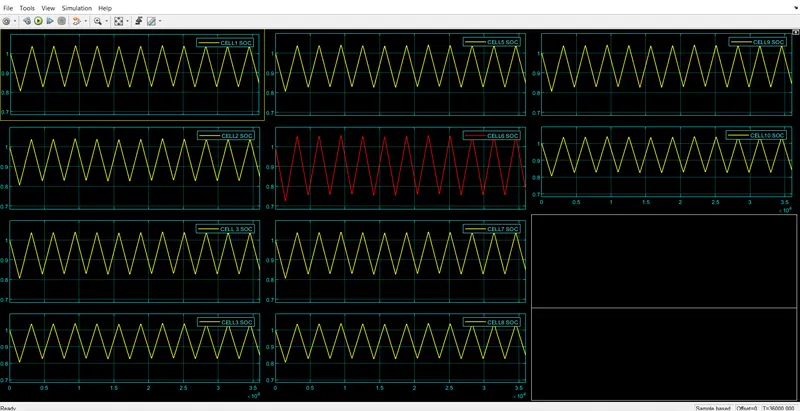
All cells soc are oscillating between 100 to 80%
But the cell6 soc drops to 74% from 100% due to its high temperature.
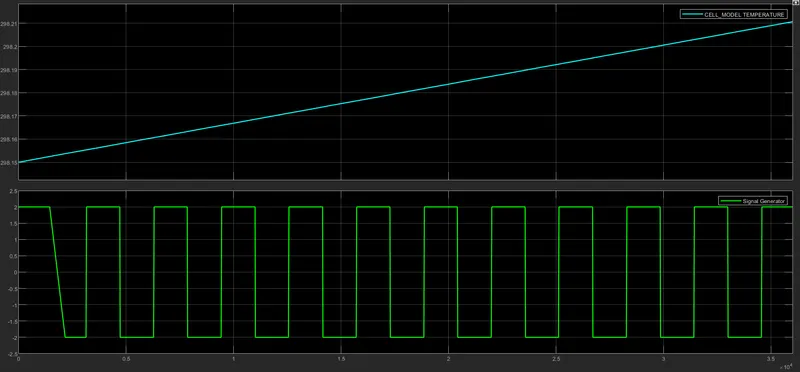
The input signal and battery temperature plot :
The Input shonwn below plot which is oscillating -2 and 2.
The battery temparature is incresed to 298.185 from 298.21.
- Hrishikesh KaleI am at this project need to discuss something can you provide your contact?