Project 2 - Supply and Demand Gap Analysis
Supply and Demand Gap Analysis
Aim:
The aim of this project is to collect and analyze the data in detail of the Pickup point of the Airport and City Request id in Uber Request Data.
Introduction:
Uber provides the 2016 data. By using this data find out the demand and supply Analysis gap of the cab.The main objective of this project is to analyze the data on, Uber Request data. Through the analysis of data, we can find some important insights.
Problem Statement:
In this project, we find out how many request id is placed from the pickup point of the Airport and city, How many Drivers are present, How many trips are completed, and how many trips are cancelled also find out how many trips the car is not available for the trips.
Methodology:
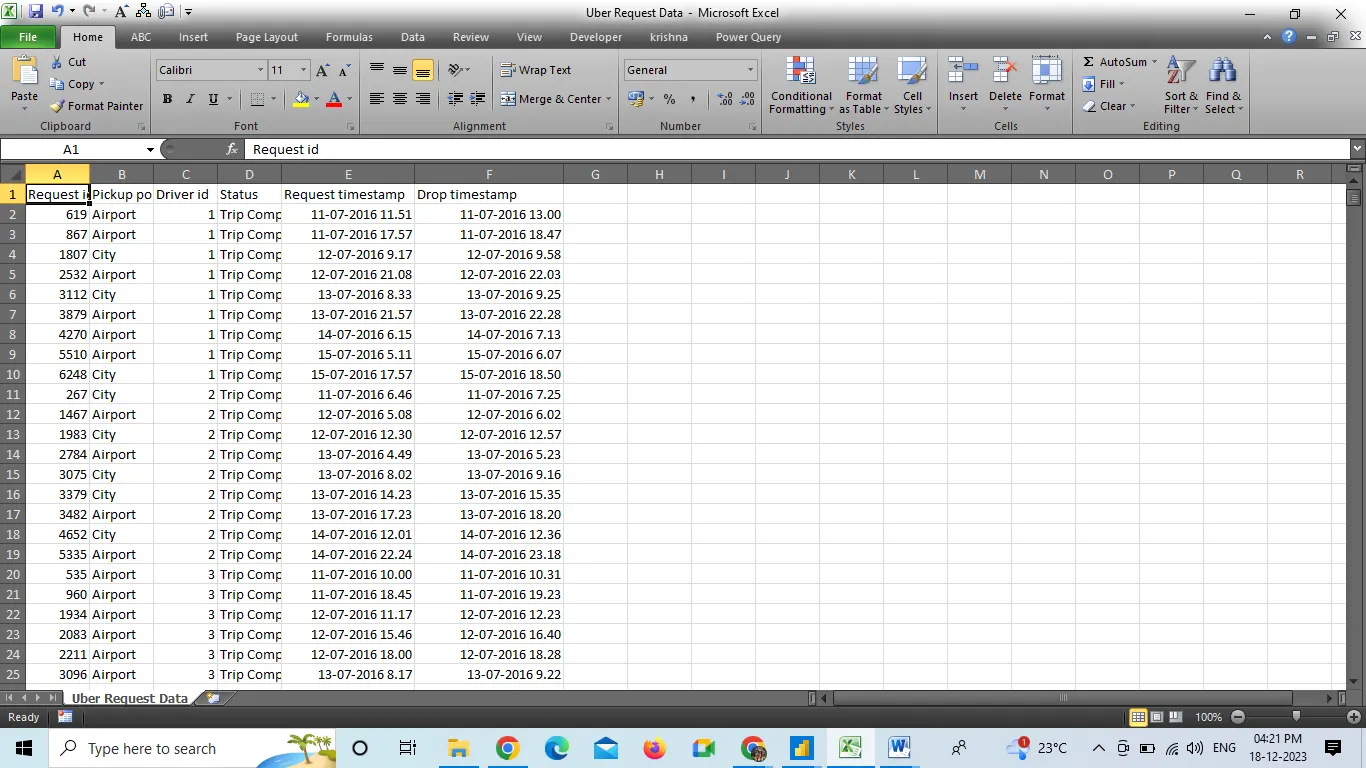
v In Uber, the Request Data set the first column is Request id in this column the request-id is present the placed by the customer.
v In the second column, the pickup point is present in this data only two Airport and City pickup point is present.
v The next column is Driver Id in this column so many drivers are present each driver assigns a separate driver ID.
v Another column is Status in this Status column three statuses are present completed, cancelled and No car available.
v The last two columns are the Request timestamp and Drop Timestamp in this column the request time and drop time are present.
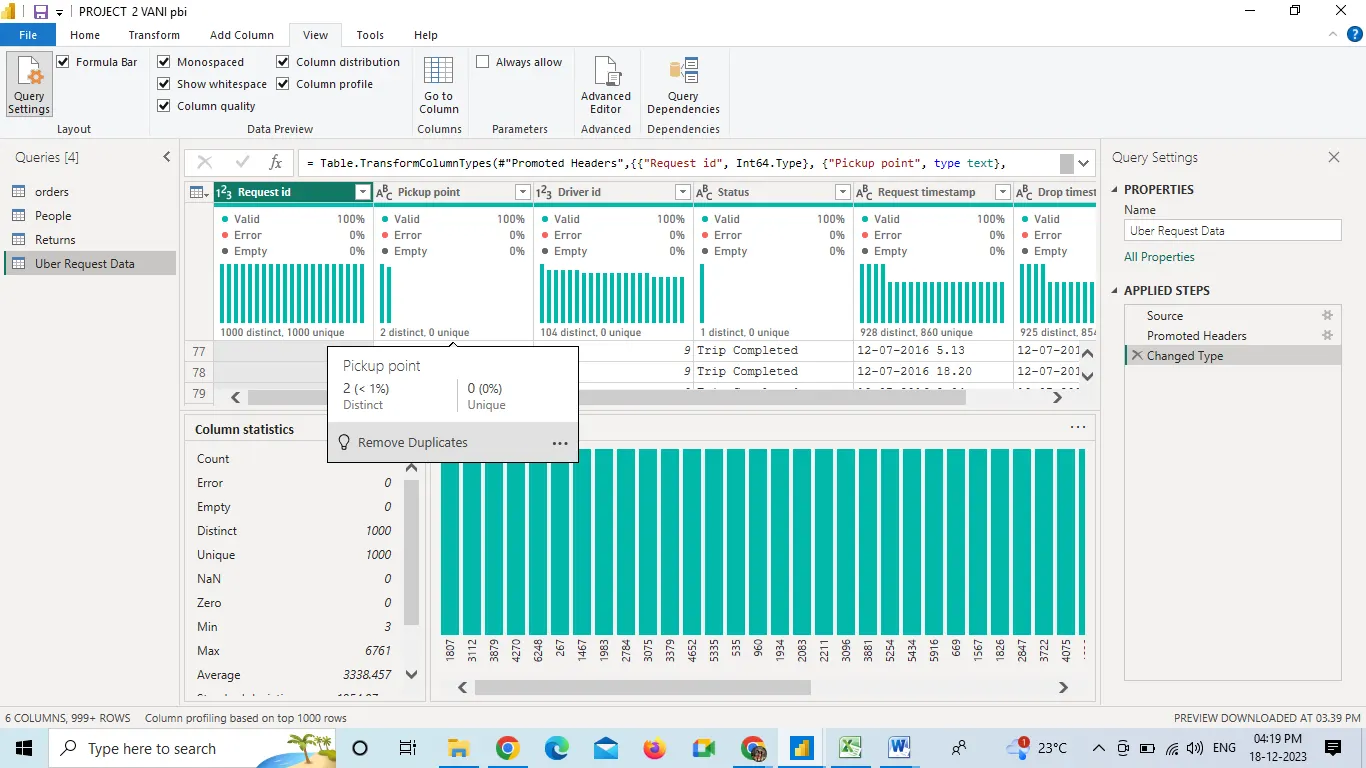
v The first step is cleaning the data. In data cleaning I cleaned the data with the transform data option present in Power BI because the dataset was not cleaned and included some missing values, so with the help of the duplicates function in Power BI, I cleaned the data and replace the null values with 0 and then started working on it.
v After Data cleaning performs the Data interpretation step. In Data interpretation found some important information.
v The data set was almost clean and completed.
v Replace the Null values with 0
v There is a total of 6746 rows and 4 columns are present.
Analysis (Data sheets pertaining to it):
Insights:
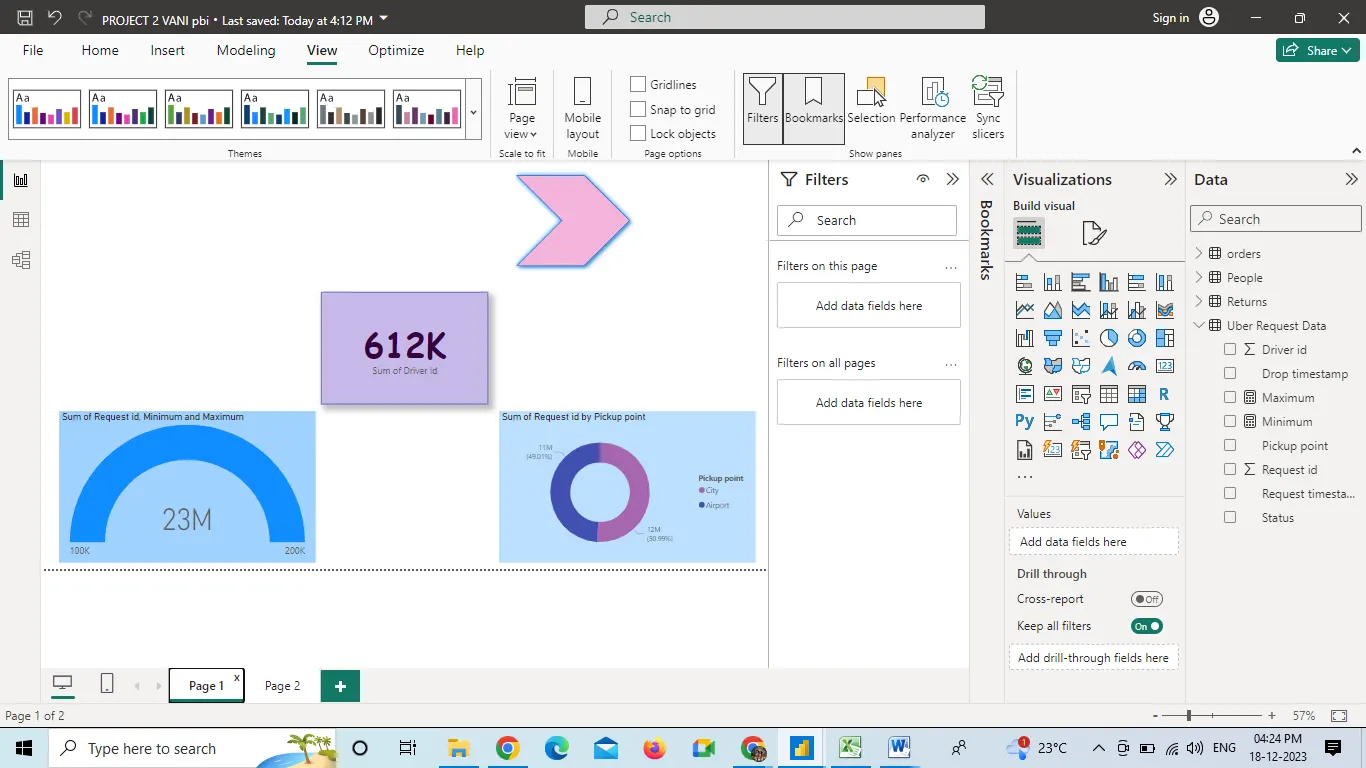
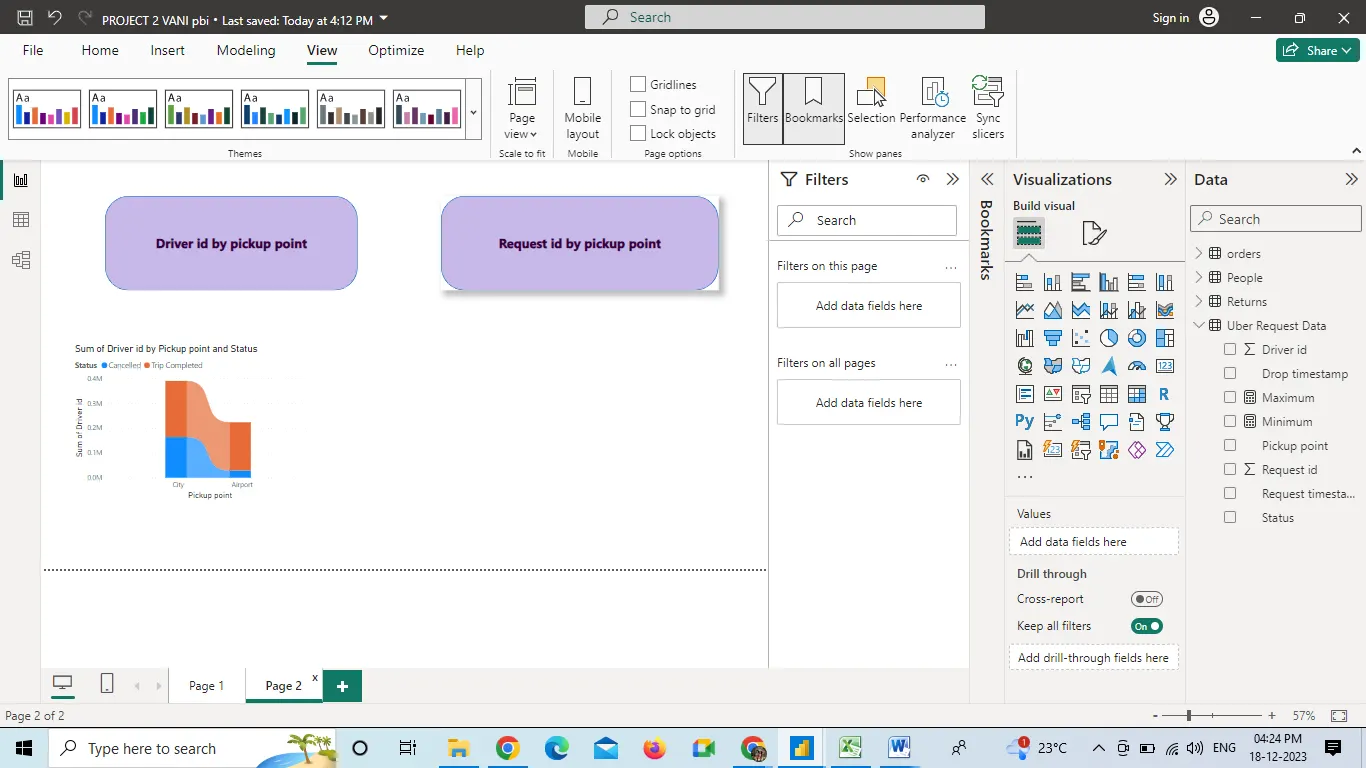
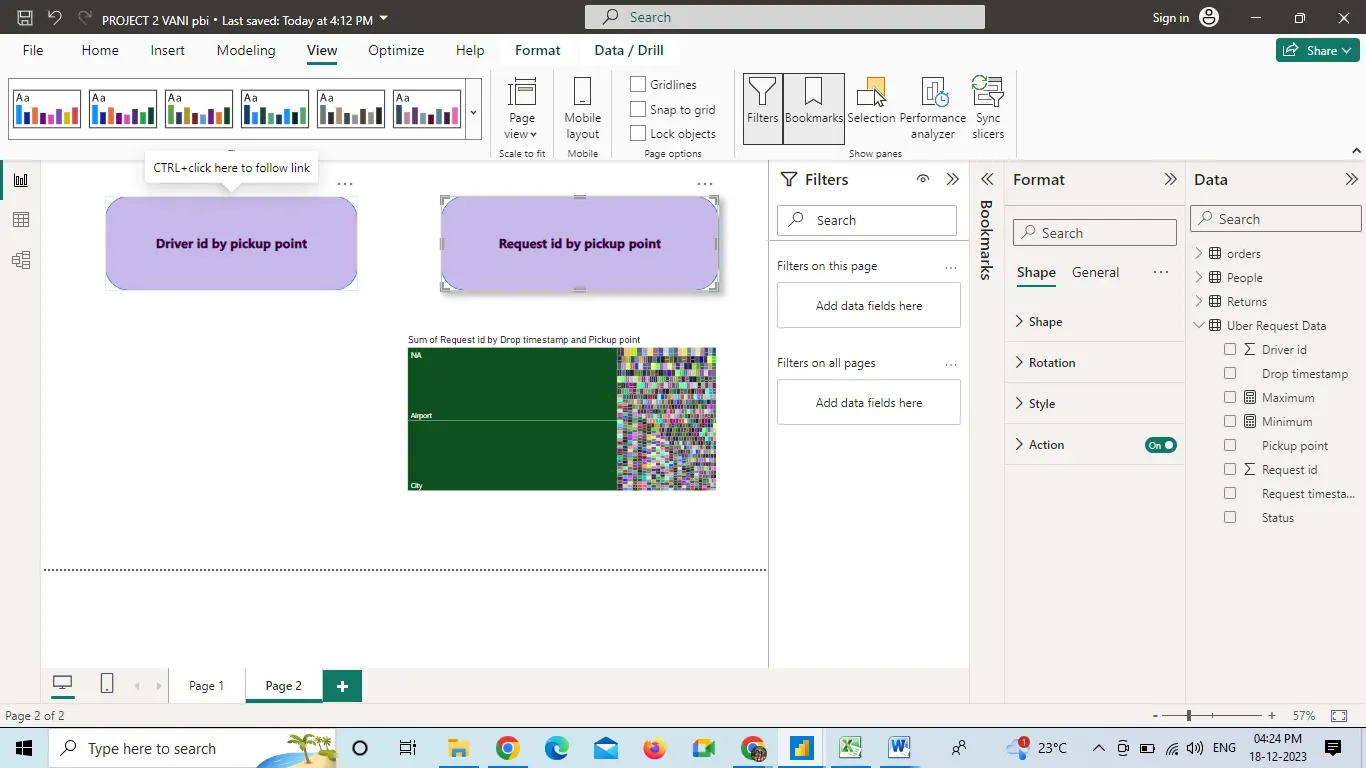
In visualization, I took the help of Power BI Desktop software to make graphs and charts here some relevant graphs and charts are attached.
Recommendations:
v We can analyze the data of the overall Trips in the City.
v Like this dataset, we can Analyze the Data according to the Different Cities-Area it takes more clarity to how to fill the supply and demand gap
v We can analyze the data with the proper format
v We can collect good datasets for more effective analysis by using charts.
Conclusions:
v In Conclusion, we can take look at the Dashboard for further Analysis.
v According to analysis, almost 1713 trips are cancelled for Airport trips. In airports, trips need to increase the drivers that help to increase the Business.
v The second points are that almost 1066 trips are cancelled by the customer in the city area and need to improve some features.
v A total of 1327 Drivers successfully completed the Airport trips and 1504 Drivers successfully completed the City trips.