Project 1 - COVID-19 Vaccinations Trend Analysis
Project 1 - COVID-19 Vaccinations Trend Analysis
AIM:
This project aims to analyse data in detail on vaccinated and fully vaccinated people by year and country.
Introduction:
The main objective of this project is to analyse the data on, COVID-19 Vaccinations. We can find out some important insights by analysing the data.
Problem statement:
• In order to know how many people are full vaccinated by the initial protocol.
• To know the population which has received at least one dose of the vaccine.
• The different vaccines used and their availability to different countries.
Methodology:
The dataset used is available for the public and which is collected from the respective health departments of the countries and from the WHO.The dataset contains information for the period December 2020 to March 2022.
Step 1: Data Exploration
In order to take any necessary steps we must understand the data we have, which is data exploration and based on our
understanding we can go ahead with the appropriate data cleaning steps required
Step 2: Data Importing
To Import the data into Power BI, Let’s start with the Get Data option under the home tab. As this is a CSV file, select the Text/CSV option from the drop-down list and the select the file named. After selecting the file, data will be displayed Click on Load and save data.
Step 3: Data cleaning
I have used Power BI tool to clean and transform the data as per my understanding and I have replaced values, grouped the data and created a new table where it seemed fit.
Step 4: Data Visualization
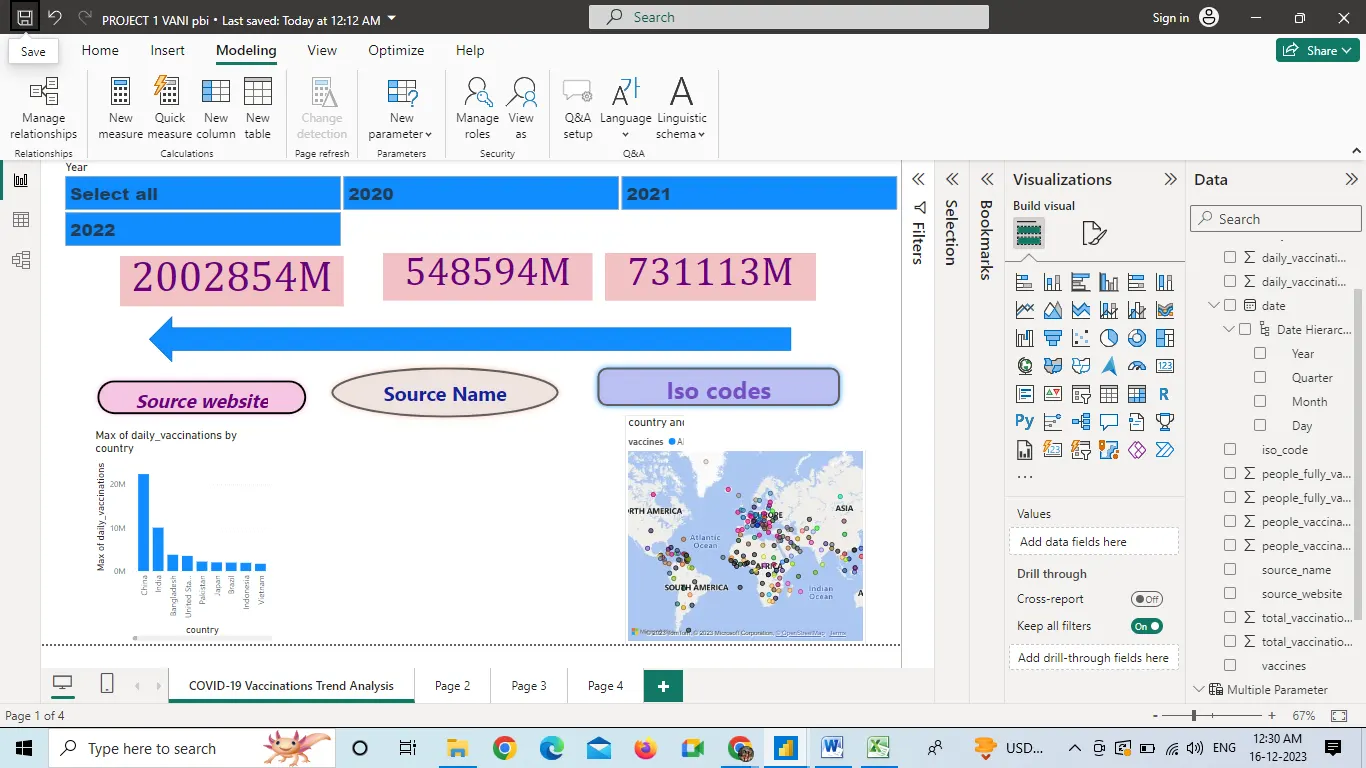
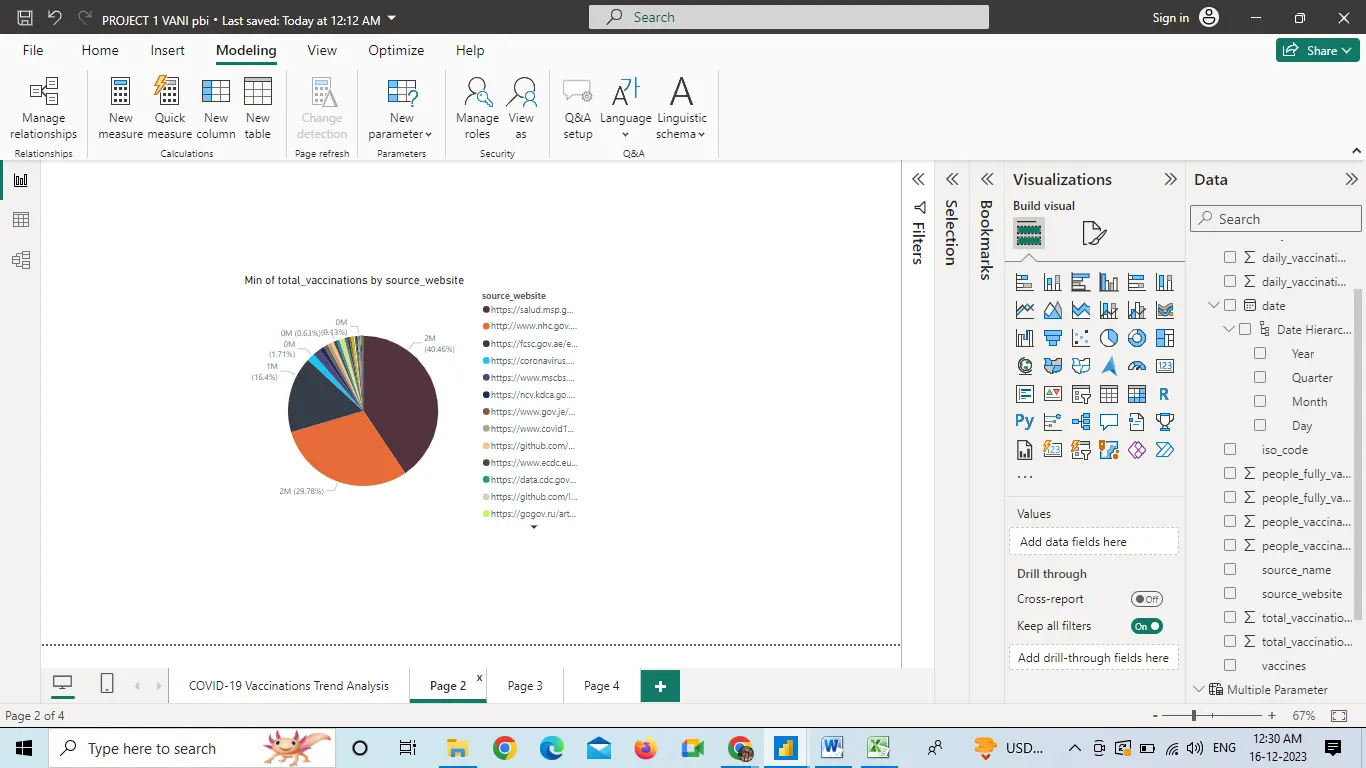
I have used Power BI tool to visualize the data available to gain meaningful insights and better understand the dataset. I have used different visualizations like bar graphs, line graphs which are available in the tool.
Analysis (Data sheets pertaining to it):
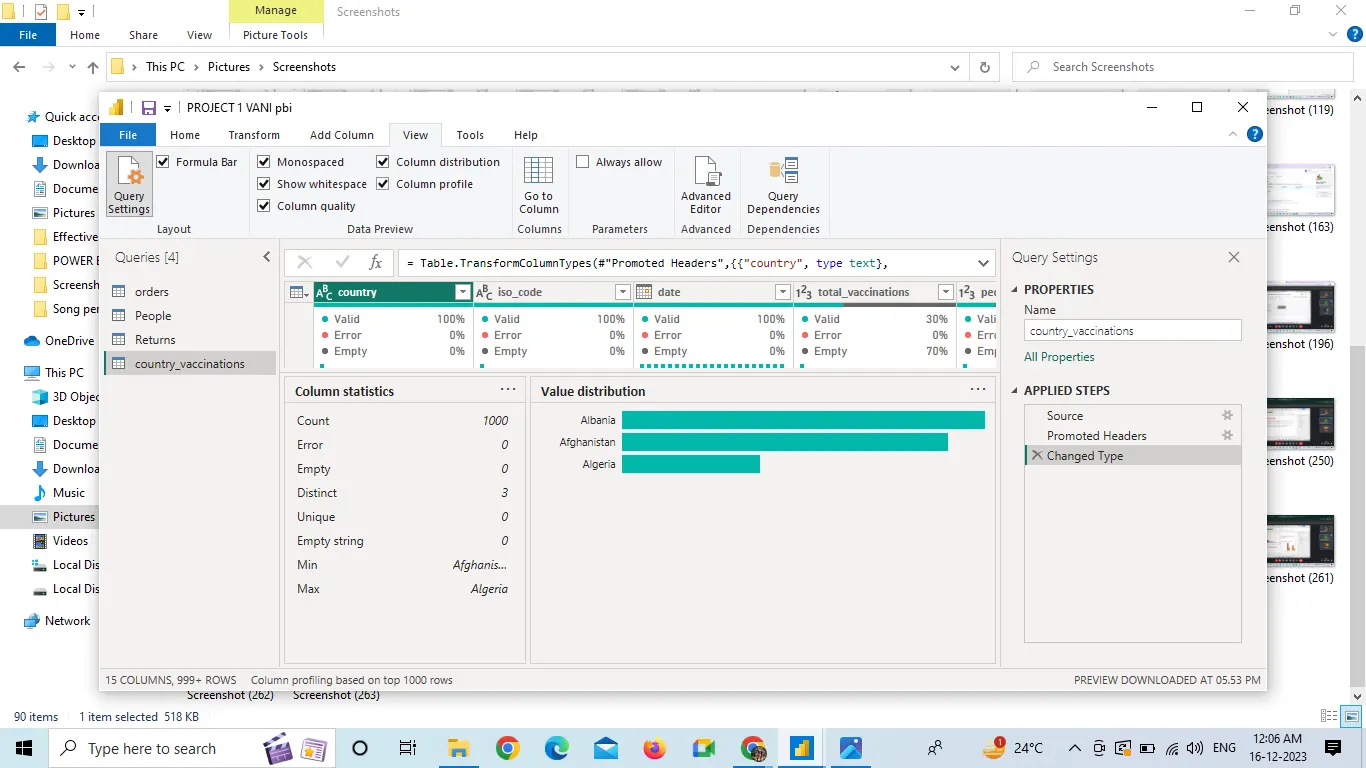
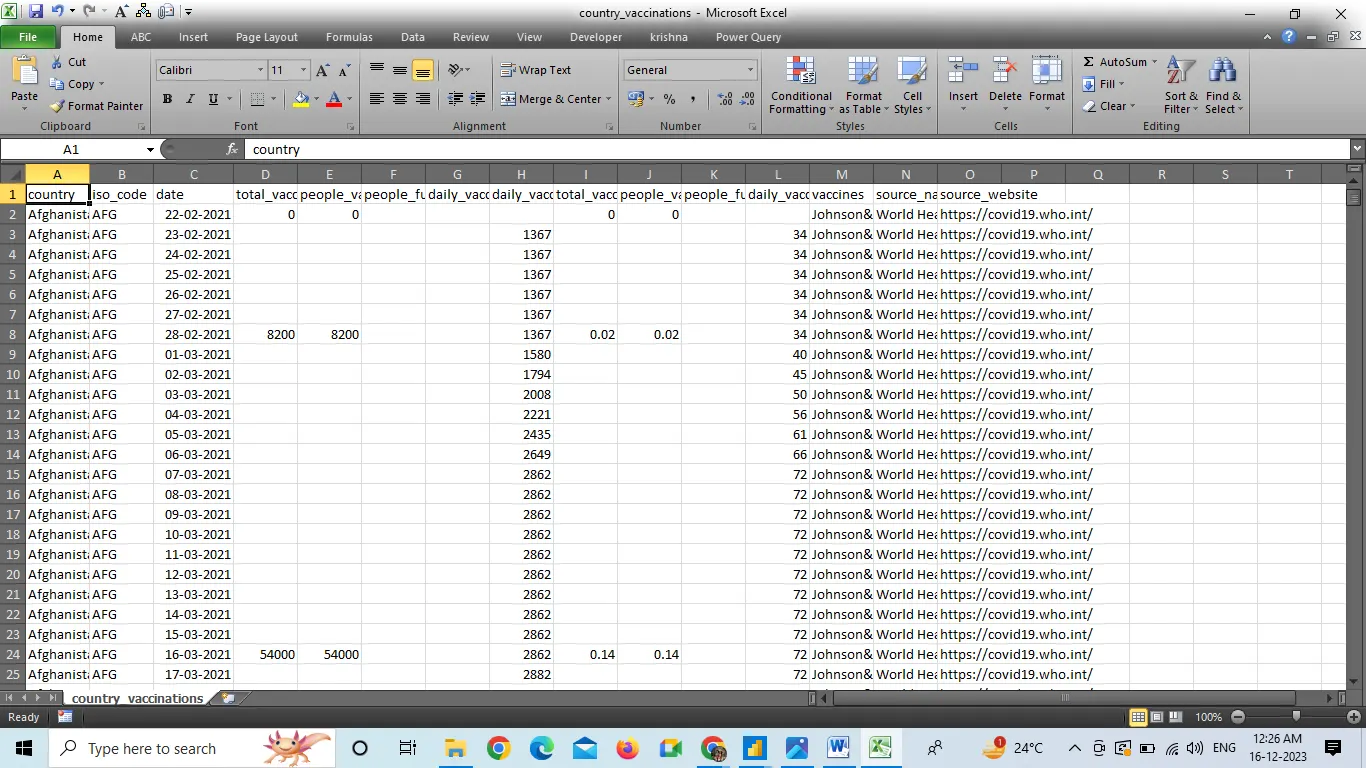
This is the data of covid vaccination. We can see there many null values are allowed so we will perform data cleaning using transformation.
Insights:
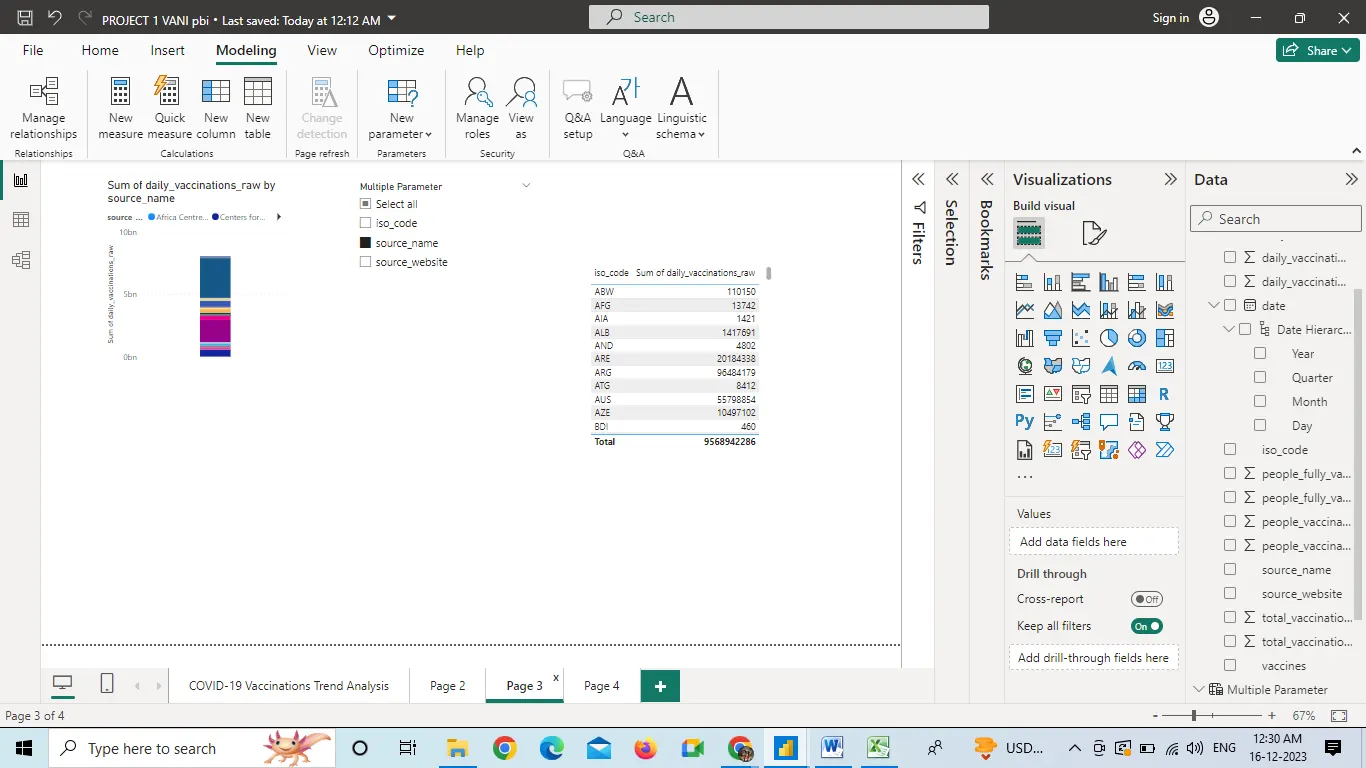
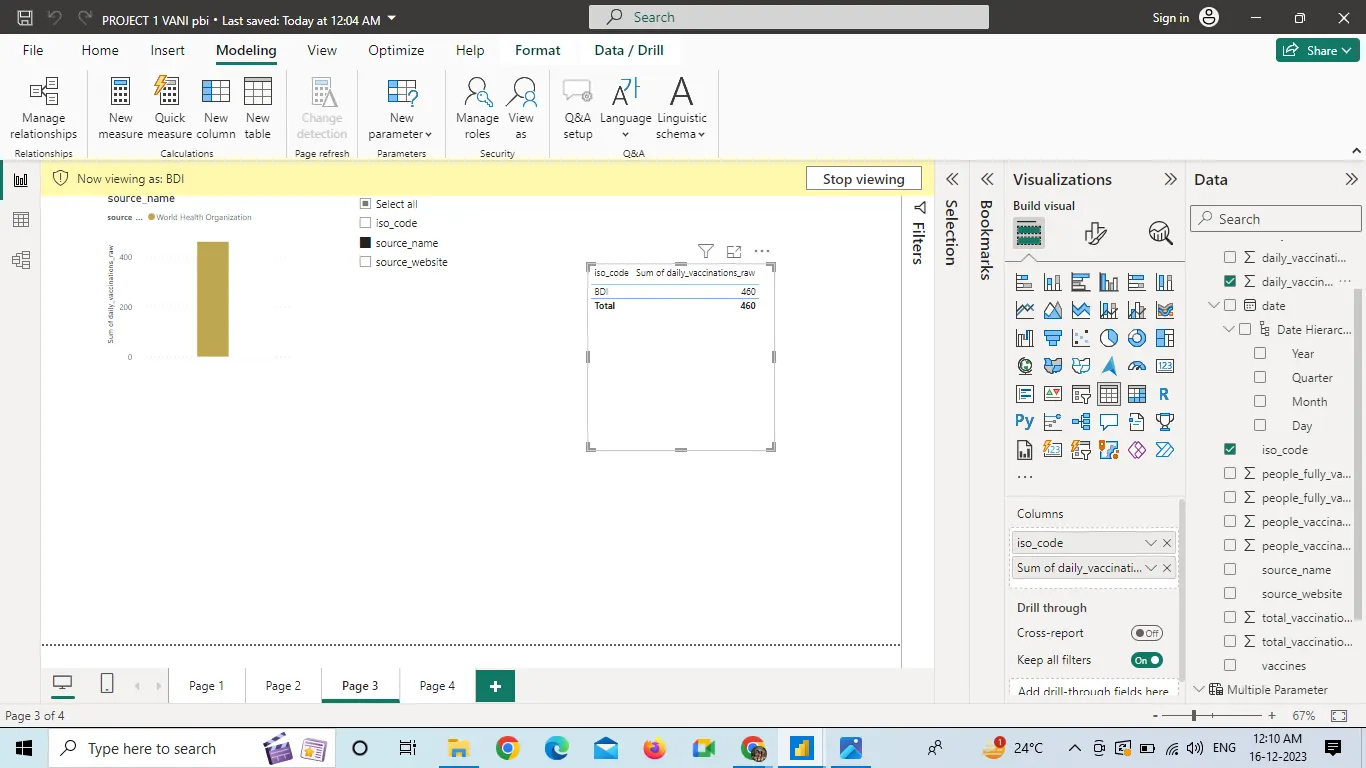
Recommendations:
We can perform operations with various categories.
In order to improve the accuracy and usefulness of the data analysis, it is important to ensure that the datasets used are of high quality and are properly cleaned and organized.
The developed and economically strong countries should help out the under developed and developing countries to improve the vaccination of the people.
At least 90% of the population should be vaccinated at least once to avoid further problems.
Conclusions:
The results of this analysis reveal that the trend of COVID-19 vaccinations is increasing in many countries. There is evidence that the number of people receiving their first dose of the vaccine is steadily increasing, while the percentage of people receiving their second dose has also been steadily increasing. Additionally, the data shows that the rate of vaccination varies across countries, with some countries having higher rates than others. In general, it appears that the rollout of the vaccine is progressing well, and that more people are becoming vaccinated on a daily basis