Project 2 - Supply and Demand Gap Analysis
Project 2 - Supply and Demand Gap Analysis
Aim: To delve into the automotive industry's sales landscape to dissect trends and patterns, ultimately formulating effective strategies for model promotion and sales enhancement.
Introduction: Passenger cars are the most common means of transportation in developed countries. In recent years there been tremendous adoption in advanced technologies such as advanced driver assistance system (ADAS). Adoption of electric vehicle is fuelling the demand for passenger cars. Due to the increase in per capita income, the number of passenger cars in developing countries is also increasing. The passenger car market of a country depends to a large extent on its current economic conditions, which is why the industry dropped during the recession in the United States and Europe. Many passenger car manufacturers, including General Motors, Ford and Chrysler, have had to seek large loans to continue production in a sluggish economy. Globally, the Passenger Cars market is segmented by fuel type, by vehicle type and by geographic coverage. Based on fuel type, the market is further segmented into petrol, diesel, hybrid and electric. The electric segment is expected to dominate the market over the forecast period. Various governments across the globe have imposed stringent emission norms on automotive manufacturers to develop emission free vehicles. Adoption of charging infrastructure in various countries is fuelling the demand for electric vehicles. By vehicle type the market is segmented into hatchback, sedan, compact-SUV and SUV. The compact-SUV segment is expected to dominate the market over the forecast period. High ground clearance, sturdy vehicle and powerful engine are the factor that is dominating the compact-SUV segment over the forecast period. Adoption of EV and Hybrid technology is also another factor that is helping to dominate in passenger car market.
Problem Statement: This study endeavors to address the intricacies surrounding brand-specific sales figures, unveiling the dynamics that govern market preferences. Additionally, it seeks to unravel the enigma of top-selling models, deciphering the attributes that elevate them to prominence in the competitive landscape. The investigation also extends its gaze to the upper echelons of luxury, meticulously dissecting the top 10 expensive cars and their allure within an exclusive market segment. Furthermore, an examination of sales pertaining to fuel efficiency emerges as a critical focal point, shedding light on the eco-conscious consumer choices that shape the industry's ecological footprint. Delving into the correlation between sales and vehicular dimensions, specifically wheelbase and length, aims to unravel the underlying trends that influence consumer decisions based on spatial considerations. This study aspires to provide a comprehensive perspective on the multifaceted world of automotive sales, from brand allegiance to economic luxury, environmental responsibility, and the nuanced impact of vehicular dimensions, thereby contributing to a deeper understanding of the intricate dynamics that propel the industry forward.
Methodology:
- Data Procurement: Acquired the requisite dataset for analysis from Kaggle, meticulously selecting an automobile sales dataset tailored to the research objectives.
- Data Integration: Within the Power BI Desktop environment, a seamless data integration process was initiated. The 'Get Data' feature under the Home tab was harnessed, specifically opting for CSV file format. The chosen dataset was seamlessly imported, setting the stage for subsequent data transformation steps.
- Data Refinement: Rigorous scrutiny of the loaded dataset ensued, revealing a pristine dataset devoid of null values. Each attribute was judiciously named to foster clarity and understanding, enhancing the dataset's coherence.
- Visual Insight: To unravel the intricate nuances of automobile sales trends, an array of visually compelling tools were harnessed. These included an assortment of visualizations such as dynamic bar graphs, engaging funnel cards, illustrative pie charts, and insightful donut charts. This diverse visual palette was strategically employed to foster a comprehensive understanding of the underlying patterns within the dataset, lending an enriched perspective to the analysis.
Analysis:
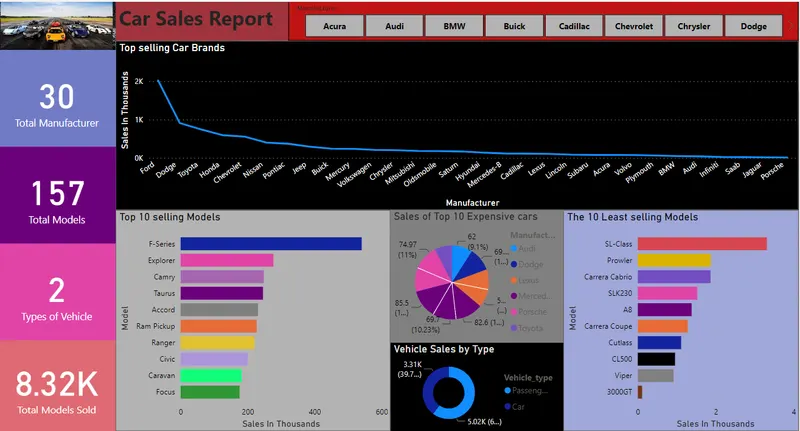
- Line Chart: Employing a dynamic line chart, a comprehensive analysis of the top-selling vehicle brands was conducted, with Ford Motor dominating the landscape at a staggering 2 million sales, juxtaposed against Porsche, which secured a more modest 12 thousand sales, anchoring the list.
- Clustered Bar Chart: Leveraging the prowess of a clustered bar chart, a meticulous examination of both the premier and underperforming vehicle models was undertaken. The Ford F series emerged triumphant as the frontrunner, while the Mitsubishi 3000GT found itself nestled at the bottom echelons of the roster.
- Donut Chart: Through the insightful lens of a donut chart, the distribution of vehicles by type was astutely scrutinized, offering a clear snapshot of sales trends within each category.
- Tree Map: The tree map visualization took center stage in deciphering the universe of opulence, spotlighting the top 10 most luxurious cars and their respective sales figures.
- Area Chart: A dynamic area chart brought into focus the realm of resale values, expertly unveiling the car model that boasted the loftiest resell value among its peers.
- Stacked Column Chart: This powerful charting technique facilitated an in-depth exploration into the units sold, highlighting the dominance of high-performance vehicles that commanded the market.
- Funnel Card: The funnel card, a visual companion, expertly guided the analysis of fuel efficiency, unveiling the number of units sold for the most fuel-efficient cars in a visually engaging manner.
- Line Stacked Column Chart: This hybrid chart, combining the strengths of both line and stacked column visuals, seamlessly illustrated the triumvirate of car attributes—length, wheelbase, and sales figures—capturing the essence of their interconnectedness within the automotive
Insights:
- Brand Dominance: The line chart brought to light the remarkable market dominance of Ford Motor, with an impressive 2 million sales, underscoring its position as a frontrunner. In contrast, Porsche's sales figures stood at a comparatively modest 12 thousand, highlighting a stark contrast in brand popularity.
- Model Hierarchy: The clustered bar chart intricately unraveled the hierarchy within the realm of vehicle models. The Ford F series emerged as the undisputed leader, while the Mitsubishi 3000GT occupied the lower rungs of sales, indicating a noteworthy disparity in consumer preferences.
- Segment Distribution: Through the lens of the donut chart, a discerning view of vehicle sales by type emerged, revealing the proportionate distribution of sales across various categories, offering valuable insights into consumer preferences and market trends.
- Luxury Landscape: The tree map visualization, while artistically captivating, provided a clear snapshot of the upper echelons of luxury, spotlighting the elite group of the top 10 most expensive cars and their respective sales figures.
- Resale Value Gem: The area chart cast a spotlight on the world of resale values, uncovering a vehicle model that exhibited exceptional resell value, emphasizing the influence of certain models in retaining their value over time.
- Performance Prowess: The stacked column chart, by focusing on units sold, emphasized the overwhelming market share commanded by high-performance vehicles, showcasing the strong consumer demand for these powerful machines.
- Fuel Efficiency Focus: The funnel card's engaging representation eloquently conveyed the sales performance of the most fuel-efficient cars, offering insights into environmentally conscious consumer choices and the market's response.
- Attributes Interplay: The innovative line stacked column chart hybrid provided a holistic perspective, illustrating the correlation between car attributes like length, wheelbase, and sales figures. This highlighted the intricate interplay of these factors in shaping consumer preferences and purchase decisions.
In summary, the diverse range of visual insights unveiled a wealth of information, from brand popularity to model preferences, luxury indulgence, fuel efficiency considerations, performance dynamics, and the interwoven attributes influencing consumer choices in the realm of automobile sales.
Recommendation:
- Brand Strategy Refinement: Capitalize on the market dominance observed with Ford Motor by further enhancing its brand appeal and customer engagement. This could include innovative marketing campaigns, exclusive partnerships, and targeted initiatives to maintain and expand its market share.
- Model Diversification: Recognizing the significant contrast in sales between the Ford F series and the Mitsubishi 3000GT, consider reevaluating the model lineup. Invest in research and development to introduce new features, technologies, or design elements that resonate with consumers, boosting the appeal of underperforming models.
- Segment-Specific Marketing: Leverage the insights gained from the donut chart to tailor marketing strategies to specific vehicle types. Highlight unique features and benefits of each segment to effectively target and attract distinct consumer groups.
- Luxury Expansion: Exploit the luxury car segment's potential by further curating the lineup of top-end models. Engage in strategic collaborations or introduce limited editions to attract high-end consumers seeking exclusivity and prestige.
- Resale Value Promotion: Identify the factors that contribute to the exceptional resell value of the highlighted vehicle model from the area chart. Incorporate these attributes into marketing campaigns and emphasize them in customer communications to enhance perceived value and encourage higher resale values for other models.
- Performance Portfolio Enhancement: Given the substantial market share held by high-performance vehicles, consider expanding and diversifying the range of powerful models. Innovate in terms of technology, design, and performance to cater to the robust demand for these vehicles.
- Sustainable Transport Advocacy: Building on the funnel card's insights into fuel-efficient cars, actively promote and support environmentally friendly options. Invest in research for hybrid or electric vehicles, and communicate the company's commitment to sustainable transportation solutions.
- Attributes Integration: Utilize the comprehensive insights from the line stacked column chart to inform future vehicle designs. Strive for an optimal balance between attributes like length, wheelbase, and sales potential, tailoring models to align with consumer preferences and market trends.
By implementing these recommendations, the automotive industry can harness the valuable insights garnered from the visual analyses to drive strategic decisions, enhance brand competitiveness, and align product offerings with evolving consumer demands.
Conclusion: The comprehensive analysis of the diverse visualizations has unveiled a panoramic view of the intricate landscape of automobile sales, providing valuable insights that resonate across various dimensions of the industry. From brand dominance to model preferences, luxury indulgence to sustainable choices, and performance dynamics to attribute interplay, each visualization has contributed a piece to the puzzle, ultimately painting a vivid picture of the market's dynamics and consumer behavior. As we conclude this analysis, it is evident that the fusion of data analytics and visual storytelling has brought forth a tapestry of knowledge, enriching our understanding of the automotive sales realm. The journey of discovery continues, fueled by the commitment to harness these insights for transformative progress and innovation in the exciting world of automobile sales.
Dashboard:
Enclosed herewith are the accompanying report, PPT, and PBIX files for your reference.