Project 2 - Rankine cycle Simulator
Report
Aim: With the help MATLAB programming create Rankine simulator and find network output and back work ratio.
Objectives of the project:
- Create a Rankine Cycle Simulator using MATLAB.
- Calculate the state points of the Rankine Cycle (any type of your choice) based on user inputs.
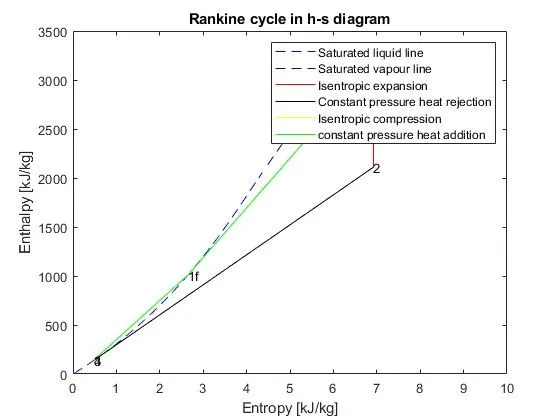
- Plot the corresponding T-s and h-s plots for the given set of inputs. Title and axes labels are a must, while legends could be used if necessary.
- Calculate Network output and Back work ratio.
- Data used for simulator is Xsteam library.
Body of the content:
The Rankine cycle:
A Rankine cycle power system is a heat engine converting thermal energy into work.
It comprises four main components are as follow :
Pump: Compression of the fluid to high pressure using a pump
Boiler: The compressed fluid is heated to the final temperature (which is at boiling point), therefore, a phase change occurs—from liquid to vapor.
Turbine: Expansion of the vapor in the turbine.
Condenser: Condensation of the vapor in the condenser (where the waste heat goes to the final heat sink (the atmosphere or a large body of water
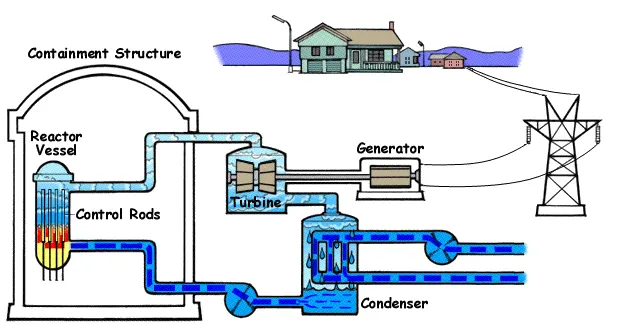
Fig.1
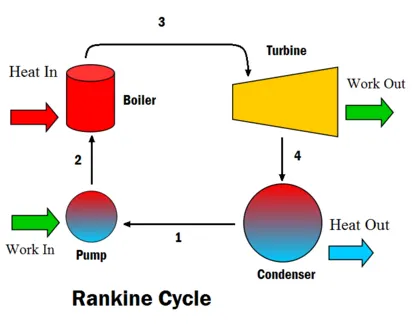
Fig.2
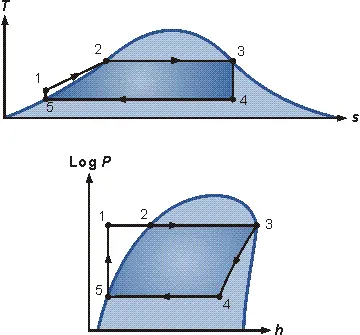
Fig 3 T-s and p-h diagrams.
The Rankine cycle operates in the following steps:
1-2-3 Isobaric Heat Transfer. High pressure liquid enters the boiler from the feed pump (1) and is heated to the saturation temperature (2). Further addition of energy causes evaporation of the liquid until it is fully converted to saturated steam (3).
3-4 Isentropic Expansion. The vapor is expanded in the turbine, thus producing work which may be converted to electricity. In practice, the expansion is limited by the temperature of the cooling medium and by the erosion of the turbine blades by liquid entrainment in the vapor stream as the process moves further into the two-phase region. Exit vapor qualities should be greater than 90%.
4-5 Isobaric Heat Rejection. The vapor-liquid mixture leaving the turbine (4) is condensed at low pressure, usually in a surface condenser using cooling water. In well designed and maintained condensers, the pressure of the vapor is well below atmospheric pressure, approaching the saturation pressure of the operating fluid at the cooling water temperature.
5-1 Isentropic Compression. The pressure of the condensate is raised in the feed pump. Because of the low specific volume of liquids, the pump work is relatively small and often neglected in thermodynamic calculations.
Incase of programming project
Main Program:
close all
clear all
clc

disp('RANKINE CYCLE SIMULATOR');
disp('1-2 = isentropic expansion in the turbine');
disp('2-3 = constant pressure heat rejection by the condensor');
disp('3-4 = isentropic compression in the pump');
disp('4-1 = constant pressure heat addition by the boiler');

%input of the state variables
t1 = input('Enter the inlet turbine temperature in degree celcius');
p1 = input('Enter the inlet turbine  pressure in bar');
p2 = input('Enter the turbine exit pressure in bar');

%invalid input condition
if t1 == 0;
    fprintf('The cycle cannot have %f as an input temperature for inlet to turbine');
else
    if p1 == 0;
        fprintf('The cycle cannot have %f as an input pressure for inlet to turbine');
    else

%specific heat at constanat pressure of super heated vapour at t1 [kJ/kg]
Cp1 = XSteam('Cp_pT',p1,t1);

%properties at state point 1
s1 = XSteam('s_pT',p1,t1);
t1sat = XSteam('Tsat_p',p1);
h1sat = XSteam('hV_p',p1);
h1 = XSteam('h_pT',p1,t1);
hf1 = XSteam('hL_p',p1);

sf1 = XSteam('sL_p',p1);
sg1 = XSteam('sV_p',p1);

fprintf('At state point 1:  \n')
fprintf('P1 is :%f bar \n',p1)
fprintf('T1 is :%f degree celcius \n',t1)
fprintf('S1 is :%f kJ/kg \n',s1)
fprintf('H1 is :%f kJ/kg \n',h1)
fprintf(' \n')

%properties at state point 2
t2sat = XSteam('Tsat_p',p2);
sg2 = XSteam('sV_p',p2);
hg2 = XSteam('hV_p',p2);
sf2 = XSteam('sL_p',p2);
hf2 = XSteam('hL_p',p2);
Cp2 = XSteam('CpV_p',p2);
s2 = s1;
%dryness fraction at state point 2
x = (s2-sf2)/(sg2-sf2);

%finding the exit temperature of turbine
if x>1
    t2 = (exp((s2-sg2)/Cp2))*(t2sat+273);
    t2 = t2-273;
else
    t2 = t2sat;
end

%Enthalpy at state point 2
h2 = hf2 + x*(hg2-hf2);

fprintf('At state point 2:  \n')
fprintf('P2 is :%f bar \n',p2)
fprintf('T2 is :%f degree celcius \n',t2)
fprintf('S2 is :%f kJ/kg \n',s2)
fprintf('H2 is :%f kJ/kg \n',h2)
fprintf('x2 is :%f \n',x)
fprintf(' \n')

%properties at state point 3
p3 = p2;
t3 = XSteam('Tsat_p',p2);
h3 = XSteam('hL_p',p2);
s3 = sf2;
v3 = XSteam('vL_p',p3);

fprintf('At state point 3:  \n')
fprintf('P3 is :%f bar \n',p3)
fprintf('T3 is :%f degree celcius \n',t3)
fprintf('S3 is :%f kJ/kg \n',s3)
fprintf('H3 is :%f kJ/kg \n',h3)
fprintf(' \n')

%properties at state point 4
p4 = p1;
s4 = s3;
v4 = XSteam('vL_p',p4);

%STATEMENTS for T4
t4 = XSteam('T_ps',p4,s4);

%pump work
Wp = (v3*(p4-p3))*100;
h4 = h3+Wp;

fprintf('At state point 4:  \n')
fprintf('P4 is :%f bar \n',p4)
fprintf('T4 is :%f degree celcius \n',t4)
fprintf('S4 is :%f kJ/kg \n',s4)
fprintf('H4 is :%f kJ/kg \n',h4)
fprintf(' \n')

% turbine work
Wt = h1 - h2;

% net work output
Wnet = Wt - Wp;

% Back work ratio
bwr = (Wp)/(Wt);

%heat supplied
Qs = h1 - h4;

%thermal efficiency
eff = (Wnet)/Qs;

%Specific steam consumption
SSC = 3600/(Wnet);

fprintf(' \n')
fprintf('Wt is :%f kJ/kg \n',Wt)
fprintf('Wp is :%f kJ/kg \n',Wp)
fprintf('efficiency is :%f \n',eff)
fprintf('Wnet is :%f kJ/kg \n',Wnet)
fprintf('SSC is :%f kg/kW-hr \n',SSC)
fprintf(' \n')

%plotting
%extracting the saturated entropy and enthalpy values for respective temperature
temp = linspace(1,t1,5000);
for i = 1:length(temp);
    S_L(i) = XSteam('sL_T',temp(i));
    S_G(i) = XSteam('sV_T',temp(i));
    H_L(i) = XSteam('hL_T',temp(i));
    H_G(i) = XSteam('hV_T',temp(i));
end

figure(1)
%plotting saturated line in T-s diagram
plot(S_L,temp,'color','b','linestyle','--')
hold on
plot(S_G,temp,'color','b','linestyle','--')
hold on

%plotting Rankine cycle in T-s diagram

if x>1
   plot([s1 s2],[t1 t2],'color','r')
hold on
plot([s2 sg2],[t2 t2sat],'color','c')
hold on
plot([sg2 sf2],[t2sat t3],'color','k')
hold on
plot([s3 s4],[t3 t4],'color','y')
hold on
plot([s4 sf1],[t4 t1sat],'color','m')
hold on
plot([sf1 sg1],[t1sat t1sat],'color','m')
hold on
plot([sg1 s1],[t1sat t1],'color','m')
hold on

text(s1,t1,'1')
text(s2,t2,'2')
text(sg2,t2sat,'2s')
text(sf2,t3,'3')
text(s4,t4,'4')
text(sf1,t1sat,'1f')
text(sg1,t1sat,'1g')

title('Rankine cycle in T-s diagram')
xlabel('Entropy [kJ/kg]');
ylabel('Temperature [degree Celcius]')
legend('Saturated liquid line','Saturated vapour line','Isentropic expansion','heat rejected in the heat exchanger','Constant pressure heat rejection','Isentropic compression','constant pressure heat addition')

else

plot([s1 s2],[t1 t2],'color','r')
hold on
plot([s2 sf2],[t2sat t3],'color','k')
hold on
plot([s3 s4],[t3 t4],'color','y')
hold on
plot([s4 sf1],[t4 t1sat],'color','g')
hold on
plot([sf1 sg1],[t1sat t1sat],'color','g')
hold on
plot([sg1 s1],[t1sat t1],'color','g')
hold on

text(s1,t1,'1')
text(s2,t2,'2')
text(sf2,t3,'3')
text(s4,t4,'4')
text(sf1,t1sat,'1f')
text(sg1,t1sat,'1g')

title('Rankine cycle in T-s diagram')
xlabel('Entropy [kJ/kg]');
ylabel('Temperature [degree Celcius]')
legend('Saturated liquid line','Saturated vapour line','Isentropic expansion','Constant pressure heat rejection','Isentropic compression','constant pressure heat addition')
end

figure(2)
%plotting saturated line in h-s diagram
plot(S_L,H_L,'color','b','linestyle','--')
hold on
plot(S_G,H_G,'color','b','linestyle','--')
hold on

%plotting Rankine cycle in h-s diagram

if x>1
   plot([s1 s2],[h1 h2],'color','r')
hold on
plot([s2 sg2],[h2 hg2],'color','c')
hold on
plot([sg2 sf2],[hg2 h3],'color','k')
hold on
plot([s3 s4],[h3 h4],'color','y')
hold on
plot([s4 sf1],[h4 hf1],'color','m')
hold on
plot([sf1 sg1],[hf1 h1sat],'color','m')
hold on
plot([sg1 s1],[h1sat h1],'color','m')
hold on

text(s1,h1,'1')
text(s2,h2,'2')
text(sg2,hg2,'2s')
text(sf2,h3,'3')
text(s4,h4,'4')
text(sf1,hf1,'1f')
text(sg1,h1sat,'1g')

title('Rankine cycle in h-s diagram')
xlabel('Entropy [kJ/kg]');
ylabel('Enthalpy [kJ/kg]')
legend('Saturated liquid line','Saturated vapour line','Isentropic expansion','heat rejected in HX during expansion','Constant pressure heat rejection','Isentropic compression','constant pressure heat addition')

else

plot([s1 s2],[h1 h2],'color','r')
hold on
plot([s2 sf2],[h2 h3],'color','k')
hold on
plot([s3 s4],[h3 h4],'color','y')
hold on
plot([s4 sf1],[h4 hf1],'color','g')
hold on
plot([sf1 sg1],[hf1 h1sat],'color','g')
hold on
plot([sg1 s1],[h1sat h1],'color','g')
hold on

text(s1,h1,'1')
text(s2,h2,'2')
text(sf2,h3,'3')
text(s4,h4,'4')
text(sf1,hf1,'1f')
text(sg1,h1sat,'1g')


title('Rankine cycle in h-s diagram')
xlabel('Entropy [kJ/kg]')
ylabel('Enthalpy [kJ/kg]')
legend('Saturated liquid line','Saturated vapour line','Isentropic expansion','Constant pressure heat rejection','Isentropic compression','constant pressure heat addition')
end

    end
end
Output:
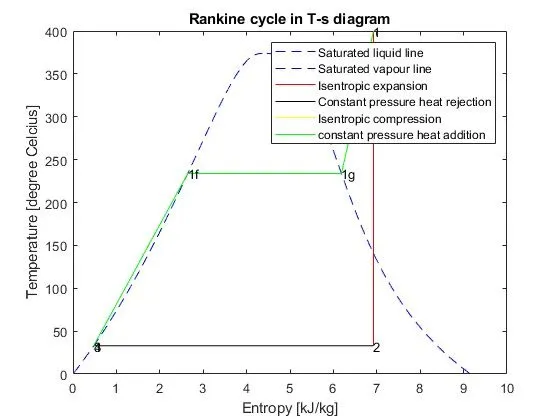
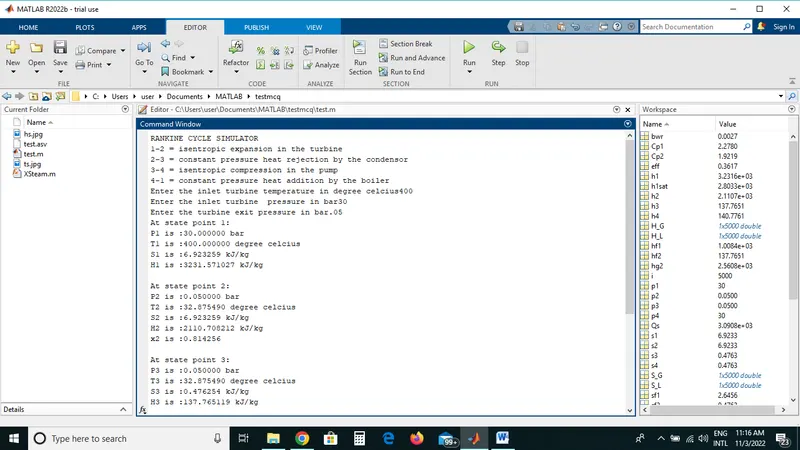
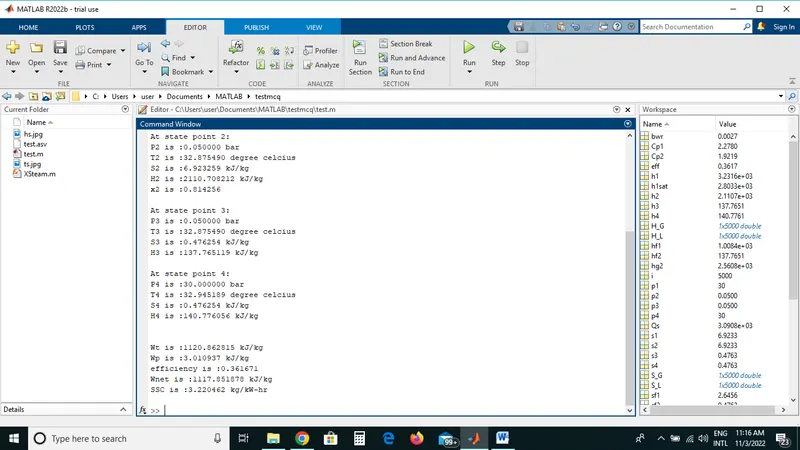
Cammand Window:
Conclusion :
With the help of Matlab we can easily create Rankine simulator and find network output and back work ratio. Data used for this MATLAB program is Xstream library.
Links: