Project 1 - Parsing NASA thermodynamic data
Report
Aim:
To write a code in MATLAB to parse NASA thermodynamic data file and then calculate thermodynamic properties of various gas species.
Objectives of the project:
- To parse the given NASA thermodynamic data and find following data from the file.
- Write a function that extracts the 14 co-efficient and calculates the enthalpy, entropy and specific heats for all the species in the data file
- Calculate the molecular weight of each species and display it in the command window.
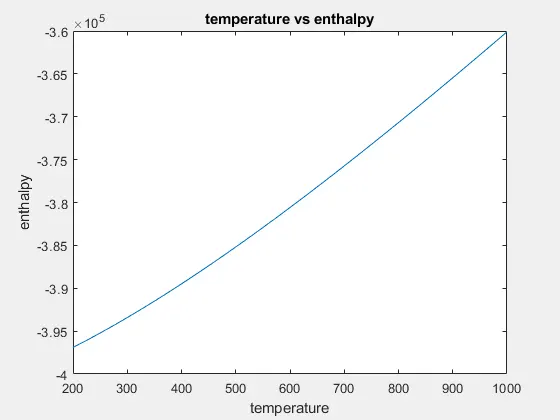
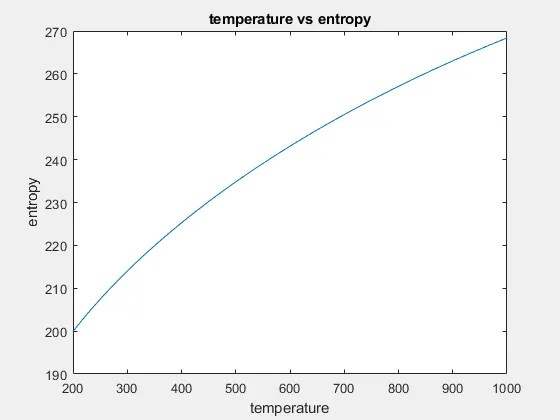
- Plot the Cp, Enthalpy and Entropy for the local temperature range (low temperature : high temperature) specific for each species
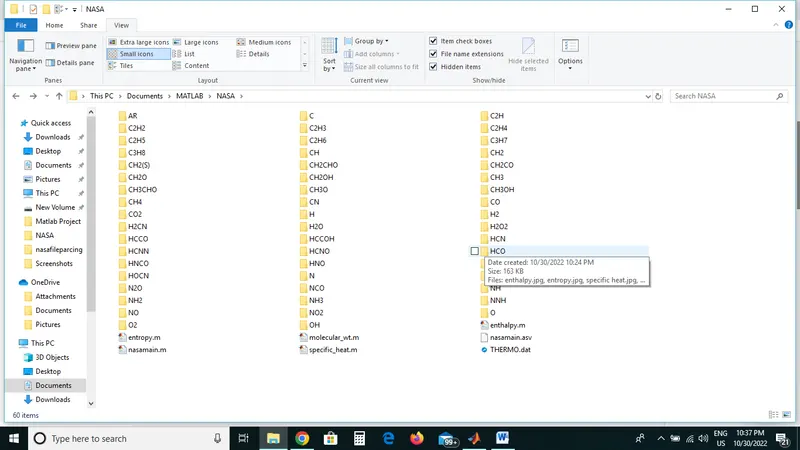
- Save the plots as images with appropriate names and dump them in separate folders for each species with suitable name. All these should be generated automatically.
- The main program that you will submit will just take the "THERMO.dat" file as an input and generate Cp, H and S plots.
- Please write a detailed report to describe your logic.
Body of the content:
File Parsing:
File parsing is a string or symbol either in natural language computer language or data structure confirming to the rules of the former grammar.
MATHEMATICAL EQUATION:
Specific heat:
The quantity of heat required to raise the temperature of one gram of a substance by one Celsius degree. The units of specific heat are usually calories or joules per gram per Celsius degree.
The formulae are shown below:
Cp/R=b1+b2⋅T+b3⋅T2+b4⋅T3+b5⋅T4cpR=b1+b2⋅T+b3⋅T2+b4⋅T3+b5⋅T4
Enthalpy :
Is the measurement of energy in a thermodynamic system. The quantity of enthalpy equals to the total content of heat of a system, equivalent to the system’s internal energy plus the product of volume and pressure.
The formulae are shown below:
H/RT=b1+b2T2+b3T23+b4⋅T34+b5⋅T45+b6THRT=b1+b2T2+b3T23+b4⋅T34+b5⋅T45+b6T
Entropy:
The measure of a system's thermal energy per unit temperature that is unavailable for doing useful work.
S/R=b1⋅log(T)+b2⋅T+b3⋅T22+b4⋅T33+b5⋅T44+b7SR=b1⋅log(T)+b2⋅T+b3⋅T22+b4⋅T33+b5⋅T44+b7
where
T= local temprature
b1-b7 =high temperature coefficient
b8-b14 =low temprature coefficient
R=Gas constant=8.314
Main Program:
clear all
close all
clc

% Open file
f1=fopen('THERMO.dat','r');

% Reading Header Information
fgetl(f1);

% Global Temperature
t_line= fgetl(f1) ;

a=strsplit(t_line,' ');

global_low_temp=str2double(a{2});
global_mid_temp=str2double(a{3});
global_high_temp=str2double(a{4});


% Neglecting the 3 lines
fgetl(f1);
fgetl(f1);
fgetl(f1);

% Reading species block
% line 1
for i=1:53
    t_line2=fgetl(f1);
    s=strsplit(t_line2,' ');
    species_name=s{1};
    A=strfind(t_line2,'G');
    temp_values=t_line2(A+4:length(t_line2));
    B=strsplit(temp_values,' ');

    local_low_temp=str2double(B{1});
    local_mid_temp=str2double(B{2});
    local_high_temp=str2double(B{3});

t_line= fgetl(f1);
b=findstr(t_line,'E');
%1st coefficient
b1=t_line(1:b(1)+3);
b1=str2num(b1);
%2nd coefficient
b2=t_line(b(1)+4:b(2)+3);
b2=str2num(b2);
%3rd coefficient
b3=t_line(b(2)+4:b(3)+3);
b3=str2num(b3);
%4th coefficient
b4=t_line(b(3)+4:b(4)+3);
b4=str2num(b4);
%5th coefficient
b5=t_line(b(4)+4:b(5)+3);
b5=str2num(b5);

% Line 2
line2=fgetl(f1);
%6th coefficient
b6=line2(1:b(1)+3);
b6=str2num(b6);
%7th coefficient
b7=line2(b(1)+4:b(2)+3);
b7=str2num(b7);
%8th coefficient
b8=line2(b(2)+4:b(3)+3);
b8=str2num(b8);
%9th coefficient
b9=line2(b(3)+4:b(4)+3);
b9=str2num(b9);
%10th coefficient
b10=line2(b(4)+4:b(5)+3);
b10=str2num(b10);

%line 3
line3=fgetl(f1);
%11th coefficient
b11=line3(1:b(1)+3);
b11=str2num(b11);
%12th coefficient
b12=line3(b(1)+4:b(2)+3);
b12=str2num(b12);
%13th coefficient
b13=line3(b(2)+4:b(3)+3);
b13=str2num(b13);
%14th coefficient
b14=line3(b(3)+4:b(4)+3);
b14=str2num(b14);

% Universal Gas Constant
R=8.314;

t=linspace(local_low_temp,local_high_temp,100);

% To Calculate
% Specific Heat by creating function
[c_p]=specific_heat(b1,b2,b3,b4,b5,b6,b7,b8,b9,b10,b11,b12,b13,b14,local_low_temp,local_mid_temp,local_high_temp,t,R);

% Enthalpy by creating function
H=enthalpy(b1,b2,b3,b4,b5,b6,b7,b8,b9,b10,b11,b12,b13,b14,local_low_temp,local_mid_temp,local_high_temp,t,R);

% Entropy by creating function
S=entropy(b1,b2,b3,b4,b5,b6,b7,b8,b9,b10,b11,b12,b13,b14,local_low_temp,local_mid_temp,local_high_temp,t,R);


% Creating a folder

mkdir(species_name)
cd(species_name)


% Plotting for

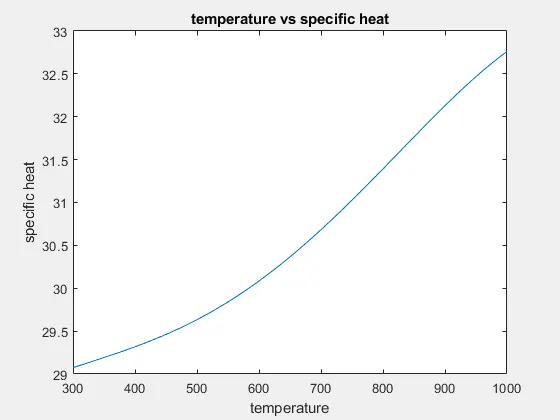
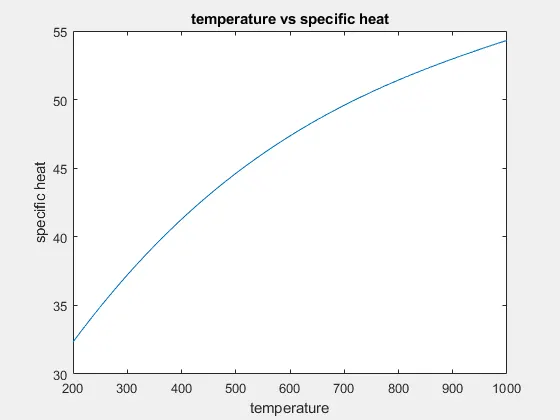
% temperature vs specific heat

figure(1)
plot(t,c_p)
xlabel('temperature')
ylabel('specific heat')
title('temperature vs specific heat')
image=getframe(gcf);
imwrite(image.cdata,'t vs cp.png')
saveas(1,'specific heat','jpg')

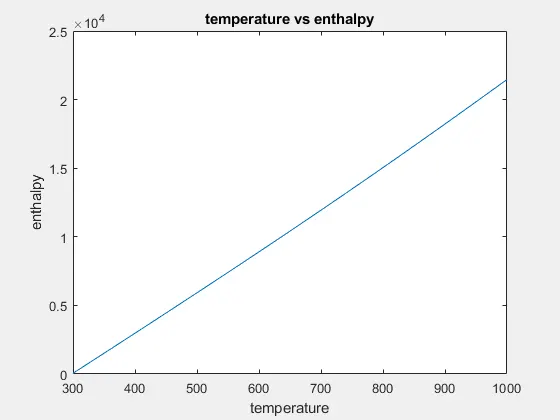
%temperature vs enthalpy
figure(2)
plot(t,H)
xlabel('temperature')
ylabel('enthalpy')
title('temperature vs enthalpy')
image=getframe(gcf);
imwrite(image.cdata,'t vs H.png')
saveas(2,'enthalpy','jpg')

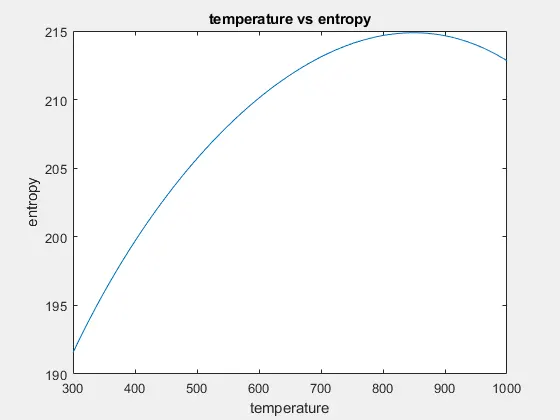
%temperature vs entropy
figure(3)
plot(t,S)
xlabel('temperature')
ylabel('entropy')
title('temperature vs entropy')
image=getframe(gcf);
imwrite(image.cdata,'t vs S.png')
saveas(3,'entropy','jpg')

cd ..

%calculating molecular mass
[M]=molecular_wt(species_name);
K=sprintf('%s mol_wt=%f',species_name,M);
disp(K)
end
FUNCTION
- For Specific Heat function
function [c_p]=specific_heat(b1,b2,b3,b4,b5,b6,b7,b8,b9,b10,b11,b12,b13,b14,local_low_temp,local_mid_temp,local_high_temp,t,R) if (t>local_mid_temp) c_p=R*(b1+(b2.*t)+(b3.*(t.^2))+(b4.*(t.^3))+(b5.*(t.^4))); else c_p=R*(b8+(b9.*t)+(b10.*(t.^2))+(b11.*(t.^3))+(b12.*(t.^4))); end - For Enthalpy Function:
function [H]=enthalpy(b1,b2,b3,b4,b5,b6,b7,b8,b9,b10,b11,b12,b13,b14,local_low_temp,local_mid_temp,local_high_temp,t,R) if (t>local_mid_temp) H=(b1+((b2.*t)/2)+((b3.*(t.^2))/3)+((b4.*(t.^3))/4)+((b5.*(t.^4))/5)+(b6./t)).*t*R; else H=(b8+((b9.*t)/2)+((b10.*(t.^2))/3)+((b11.*(t.^3))/4)+((b12.*(t.^4))/5)+(b13./t)).*t*R; end - For Entropy Function:
function [S]=entropy(b1,b2,b3,b4,b5,b6,b7,b8,b9,b10,b11,b12,b13,b14,local_low_temp,local_mid_temp,local_high_temp,t,R)

if (t>local_mid_temp)
    S=((b1.*logt)+(b2.*t)+((b3.*(t.^2))/2)+((b4.*(t.^3))/3)+(b5.*(t.^4))+b7);

else
    S=((b8.*log(t))+(b9.*t)+((b10.*(t.^2))/2)+((b11.*(t.^3))/3)+(b12.*(t.^4))+b14)*R;
end
4.For molecular_wt Function:
function [M]=molecular_wt(species_name)


atomic_mass=[15.999,1.008,12.011,14.007,39.948];
elements=['O','H','C','N','A'];

mol_wt=0;
for i=1:length(species_name)
    for j=1:length(elements)
        if strcmpi(species_name(i),elements(j))
            mol_wt=mol_wt+atomic_mass(j);
            z=j;
        end

    end
   t=str2double(species_name(i));
    if (t>1)
        mol_wt=mol_wt+(atomic_mass(z)*(t-1));
    end
end
M=mol_wt
   end
Screenshot of the window where all the folders are saved.
Plots For O2:
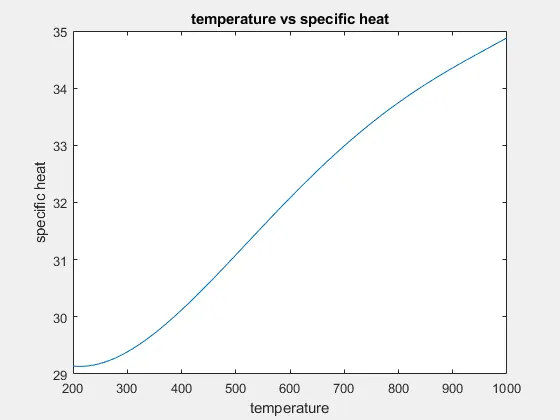
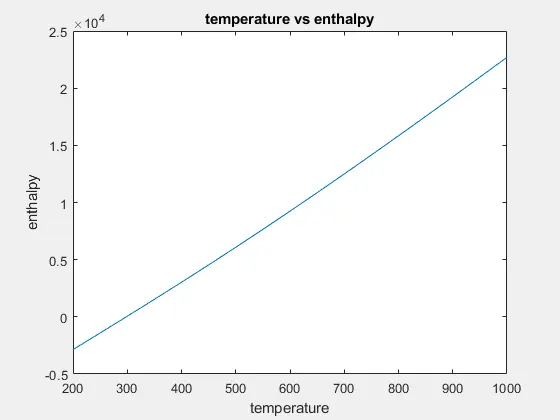
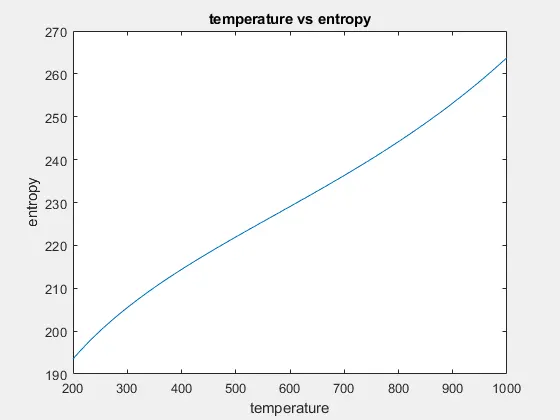
Plots For N2:
Plots For CO2:
Conclusion : With the help of Matlab we can easily parse the data file for various purpose .