Project 2 - Rankine cycle Simulator
Aim:
Creation of Rankine cycle simulator from given input and reading the data from standard thermodynamic library of steam table.
Objective:
- To create a Rankine Cycle simulator in
- To calculate the state point using function
- To plot the T-S and H -S curve for given input in Rankine Cycle. To get output in the command window for each state point in cycle.
Description:
The Rankine cycle is one of the vapor powered cycle. This cycle is somewhat different than gas powered cycle in which working fluid remained gas throughout the entire cycle. In vapor powered cycle the working fluid is steam because of its many desirable characteristics such as low cost of production, availability and high enthalpy of vaporization. There are many impracticalities associated with Carnot cycle which can be eliminated by superheating the steam and condense in condenser which makes it best for nuclear power plants and other steam related power generation sources.
The processes in Rankine cycle are given as:
- lsentropic Compression in pump
- Constant pressure heat addition in Boiler
- lsentropic expansion in a turbine.
- Constant pressure heat rejection in condenser.
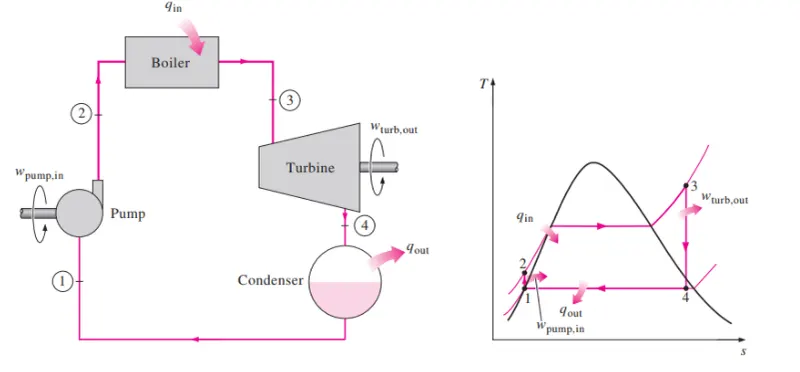
Figure: Rankine cycle schematic and T-s diagram
Note: In MATLAB code following are the preocesses of Rankine cycle
l-2 Isentropic Expansion in Turbine
2-3 Isobaric heat rejection in Condensor
3-4 Isentropic Compression in Compressor
4-1 Isobaric heat addition in Boiler
Working of Rankine cycle
Water enters the pump at state 1 as saturated liquid and is compressed isentropically to the operating pressure of the boiler. The water temperature increases during this isentropic compression process. The vertical distance between point 2 and 1 is nothing but pump work.
Water enters the boiler as a compressed liquid at state 2 and leaves as a superheated vapor at state 3. The boiler is basically a large heat exchanger where the heat originating from combustion gases, nuclear reactors, or other sources is transferred to the water essentially at constant pressure. The boiler, together with the section where the steam is superheated (the superheater), is often called the steam generator.
The superheated vapor at state 3 enters the turbine, where it expands isentropically and produces work by rotating the shaft connected to an electric generator. The pressure and the temperature of steam drop during this process to the values at state 4,where steam enters the condenser. At this state, steam is usually a saturated liquid-vapor mixture with a high quality. Steam is condensed at constant pressure in the condenser, which is basically a large heat exchanger, by rejecting heat to a cooling medium such as a lake, a river, or the atmosphere. Steam leaves the condenser as saturated liquid and enters the pump,completing the cycle. In areas where water is precious, the power plants are cooled by air in stead of water. This method of cooling,which is also used in car engines, is called dry cooling.
Remembering that the area under the process curve on a T-s diagram represents the heat transfer for internally reversible processes, we see that the area under process curve 2-3 represents the heat translerred to the water in the boiler and the area under the process curve 4-1 represents the heat rejected in the condenser. The difference between these two is the net work produced during the cycle.
All the four components of Rankine cycle are steady flow devices hence the process regarding this device can be evaluated as steady state process. The steady state flow energy equation per unit mass of steam reduces to:
(Qin-Qout) + (Win - Wout) = he - h1
The boiler and condenser are not involved in any mechanical work whereas pump and turbine are assumed to isentropic in nature while working throughout the cycle, then conservation of energy relation for each device can be expressed as:
`W_(pump=h_2-h_1`
Where, `h_1` is `h_f` at `P_1` and `v_1` = `v_f` at `P_1`
The heat added in boiler can be given as:
qin = `h_3-h_2`
The work which can be taken out of cycle from turbine is given as:
`W_out= h_3-h_4`
The heat removed from the condenser is given as:
`q_(out= h_4-h_1`
The thermal eff iciency of Rankine cycle is given as:
`η_(th)`= Wnet /qin
Where, Wnet = qin - qout = Wturb -Wpump
MATLAB Code
% Code for Rankine cycle simulator
clear all
close all
clc

% Print Process Description
fprintf('l-2 Isentropic Expansion in Turbine\n ')
fprintf('2-3 Isobaric heat rejection in Condensor\n ')
fprintf('3-4 Isentropic Compression in Compressor\n ')
fprintf('4-1 Isobaric heat addition in Boiler\n')

% Entering the input data for calculation of state points
p1= 30;   %Pressure at Turbine Inlet in Bar
T1=400;   %Temperature at Turbine Inlet in Degree Celcius
p2=0.05;  %Pressure at turbine outlet in bar

% Taking data from Xsteam file for state point 1
h1 = XSteam('h_pT', p1, T1);
s1 = XSteam('s_pT', p1, T1);

% Taking data from Xsteam file for state point 2
s2 =  s1;                    % Because of Isentropic Expansion
sf2 = XSteam('sL_p',p2);     % saturated liquid entropy at pressure 2
sg2 = XSteam('sv_p', p2);    % Saturated vapour entropy at pressure 2
x2 = (s2-sf2)/(sg2-sf2);     % Vapour Fraction at state point 2
hf2 = XSteam('hL_p',p2);     % saturated liquid Enthalpy at pressure 2
hg2 = XSteam('hv_p' , p2);   % Saturated vapour Enthalpy at pressure 2
h2 = hf2 + (x2*(hg2-hf2));   % Enthalpy at state point 2

% Taking data from Xsteam file for state point 3
p3 = p2;	              % Constant Pressure heat removal process
s3=XSteam('sL_p',p3);     % saturated liquid entropy at Pressure 3
h3=XSteam('hL_p',p3);     % saturated liquid Enthalpy at Pressure 3

% Taking data from Xsteam file for State point 4
s4=s3;	% Isentropic Compression process
p4=p1;	% Constant Pressure heat rejection

% Work done in Turbine for the rankine cycle
W_T = h1-h2;

% Work done required for pump
v3 = XSteam ('vl_p' ,p3);  % Saturated Liquid Vapour at pressure 3
W_P = v3*(p4-p3)*100;      % Work supplied to pump
h4 = h3 - W_P;             % Enthalpy at State point 4

% Met work done for Rankine Cycle
W_net = W_T - W_P;

% Heat Addition to System
Q_in = h1-h4;

% Heat Rejection from System
Q_out = h2-h3;

% Thermal Efficiency of Rankine Cycle
T_eff = (W_net/Q_in)*100;


%specific steam consumption = (Mass flow rate / Net work done)
Sp_S =  (3600/W_net);

% Calculation of Temperature at All state Point 2, 3 and 4
T3 = XSteam ('Tsat_p',p3);	  % Saturation Temperature at Pressure 3
T2 =  T3;                     % Becuase of Constant Pressure Heat addition
Cp4 = XSteam('Cp_ps',p4,s4);  % Specific isobaric heat capacity
Cv4 = XSteam('Cv_ps',p4,s4);  % Specific isochoric heat capacity
k =  Cp4/Cv4;                 % Adiabatic index
T4 = T3/((p3/p4)^((k-1)/k));  % Temperature at State point 4

%  Calcula tion  of  Other  constant  for saturated  liquid  and  Vapour
T6=XSteam ('Tsat_p', p1) ;	%  Saturated  Temperature at Pressure 1
s5=XSteam ('sL_p', p1) ;	    %  Saturated  Liquid  entropy  at pressure 1
s6=XSteam ('sV_p', p1) ;	    %  Saturated  Vapour  entropy  at Pressure  1
h5=XSteam ('hL_p', p1) ;	    %  Saturated  Liquid  Enthalpy  at Pressure  1
h6=XSteam ('hV_p', p1) ;	    %  Saturated  Vapour  Enthalpy  at pressure  1
T5=T6;

%Plotting for Saturation Line
T  =  linspace(1,560,1000) ;
for i = 1:length (T)
    sf(i)=XSteam('sL_T',T(i)) ; %  Saturated  Liquid  Entropy
    sg(i)=	XSteam('sV_T',T(i));	%  Saturated  Vapour  Entropy
    hf(i)=XSteam('hL_T',T(i));	%  Saturated  Liquid  Enthalpy
    hg(i)=XSteam('hV_T',T(i));	%  Saturated  Vapour  Enthalpy
end

% Plotting T-S Diagram for Rankine Cycle
figure(1)
hold on
plot(sf,T,'color','b','linewidth',2,'color','r');
plot(sg,T,'color','b','linewidth',2,'color','b');
plot([s1 s2],[T1 T2], 'color', 'g','linewidth',2);
plot([s2 s3],[T2 T3], 'color', 'c', 'linewidth',2);
plot([s3 s4],[T3 T4], 'color', 'm', 'linewidth',2);
plot([s4 s5],[T4 T5], 'color', 'y', 'linewidth',2);
plot([s5 s6],[T5 T6], 'color', 'k', 'linewidth',2);

s_1 = linspace(s6,s1,1000);
for j = 1:length(s_1)
    Tc(j)= XSteam('T_ps',p1,s_1(j));
end

plot(s_1,Tc, 'color','r','linewidth',3.5)
legend('Saturated liquid curve','Saturated vapour curve','Isentropic expantion','Heat rejection','Isentropic compression','Heat addition in subcooled region','Heat addition in wet region','Heat addition in Superhetaed region')
grid on
text(s1+0.1, T1, '1')
text(s2+0.1, T2, '2')
text(s3, T3-20, '3')
text(s4, T4+20, '4')
title ('Temperature Vs Entropy','FontWeight','Bold')
xlabel ('Entropy (Kj/kg-k)', 'FontWeight','Bold')
ylabel ('Temeperature (Deg. Celcius)','FontWeight','Bold')

% Plotting H-S Diagram for Rankine Cycle
figure(2)
hold on
plot(sf,hf,'color','b','linewidth',2,'color','r');
plot(sg,hg ,'color','b','linewidth',2,'color','b');
plot ([s1 s2],[h1 h2],'color','g','linewidth' ,2);
plot ([s2 s3],[h2 h3],'color','c','linewidth' ,2);
plot ([s3 s4],[h3 h4],'color','m','linewidth',2);

hc = linspace(h4,h5,100);
for k = 1:length (hc)
         s_c(k) = XSteam ('s_ph' ,p1,hc (k));
end

plot(s_c ,hc ,'color','r ','linewidth',2)
plot ([s5 s6],[h5 h6],'color','r','linewidth',2)

for l = 1:length(s_1)
    h_c(l) = XSteam('h_ps',p1,s_1(l));
end

plot(s_1,h_c,'color','r','linewidth',3)
legend('Saturated liquid curve','Saturated vapour curve','Isentropic expantion','Heat rejection','Isentropic compression')
text(s1+0.1,h1,'1')
text(s2+0.1,h2,'2')
text(s3,h3-100,'3 ')
text(s4,h4+200,'4')
title('Enthalpy Vs Entropy','FontWeight','Bold')
xlabel('Entropy (Kj/kg-k)','FontWeight','Bold')
ylabel('Enthalpy (KJ /Kg)','FontWeight','Bold')
grid on


%  Displaying  Results  in  Command  window
fprintf('\n--------------Results--------------\n')
fprintf('At state point 1:\n')
fprintf('P1 is : %f Bar\n',p1);
fprintf('T1 is : %f Degree Celcius\n',T1);
fprintf('H1 is : %f kJ/Kg\n',h1);
fprintf('S1 is : %f Kj/Kg.k\r\n',s1);

fprintf('At state point 2:\n')
fprintf('P2 is : %f Bar\n',p2);
fprintf('T2 is : %f Degree Celcius\n',T2);
fprintf('H2 is : %f kJ/Kg\n',h2);
fprintf('S2 is : %f Kj/Kg.k\n',s2);
fprintf('X2 is : %f \r\n',x2);

fprintf('At state point 3:\n')
fprintf('P3 is : %f Bar\n',p3);
fprintf('T3 is : %f Degree Celcius\n',T3);
fprintf('H3 is : %f kJ/Kg\n',h3);
fprintf('S3 is : %f Kj/Kg.k\r\n',s3);

fprintf('At state point 4:\n')
fprintf('P4 is : %f Bar\n',p4);
fprintf('T4 is : %f Degree Celcius\n',T4);
fprintf('H4 is : %f kJ/Kg\n',h4);
fprintf('S4 is : %f Kj/Kg.k\r\n',s4);

% Other calculations
fprintf('\n--------------Other calculations--------------\n')
fprintf ('Work Done By Turbine : %f kJ/kg\n',W_T)
fprintf ('Work supplied to Pump : %f kJ/kg\n',W_P)
fprintf ('Heat Added in The Boiler: %f KJ/kg\n' ,Q_in)
fprintf ('Heat Rejected in The Condenser: %f KJ/kg\n' ,Q_out)
fprintf ('Thermal Efficiency in percentage : %f \n',T_eff)
fprintf ('Specific Steam Consumption : %f KJ/kWh\r\n' ,Sp_S)
Results:
l-2 Isentropic Expansion in Turbine
2-3 Isobaric heat rejection in Condensor
3-4 Isentropic Compression in Compressor
4-1 Isobaric heat addition in Boiler
--------------Results--------------
At state point 1:
P1 is : 30.000000 Bar
T1 is : 400.000000 Degree Celcius
H1 is : 3231.571027 kJ/Kg
S1 is : 6.923259 Kj/Kg.k
At state point 2:
P2 is : 0.050000 Bar
T2 is : 32.875490 Degree Celcius
H2 is : 2110.708212 kJ/Kg
S2 is : 6.923259 Kj/Kg.k
X2 is : 0.814256
At state point 3:
P3 is : 0.050000 Bar
T3 is : 32.875490 Degree Celcius
H3 is : 137.765119 kJ/Kg
S3 is : 0.476254 Kj/Kg.k
At state point 4:
P4 is : 30.000000 Bar
T4 is : 36.935287 Degree Celcius
H4 is : 134.754182 kJ/Kg
S4 is : 0.476254 Kj/Kg.k
--------------Other calculations--------------
Work Done By Turbine : 1120.862815 kJ/kg
Work supplied to Pump : 3.010937 kJ/kg
Heat Added in The Boiler: 3096.816845 KJ/kg
Heat Rejected in The Condenser: 1972.943093 KJ/kg
Thermal Efficiency in percentage : 36.096803
Specific Steam Consumption : 3.220462 KJ/kWh
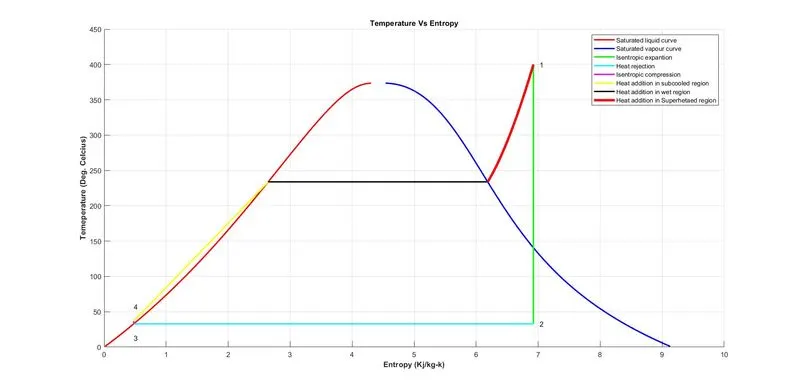
Figure: T-s chart for Rankine cycle
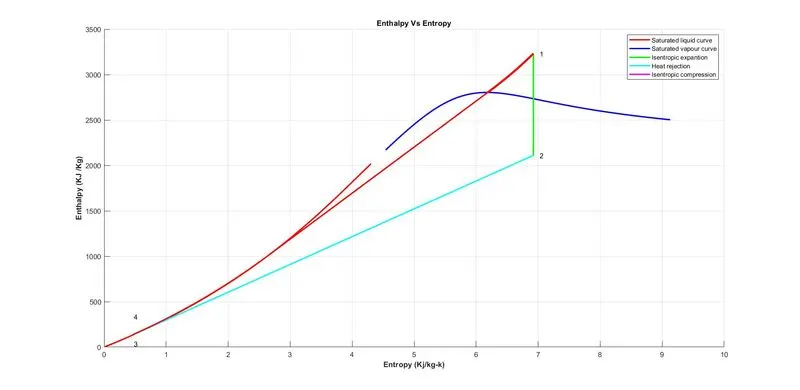
Figure: H-s chart for Rankine cycle
Conclusion
- For given inputs, performance of Rankine cycle is predicted using MATLAB.
- T-s and H-s diagram is plotted for Rankine cycle
- Thermal efficiency is calculated for Rankine cycle
- From Results it is found that, T-s and H-s diagram is correct and Efiiciency is also matching with theoretical values. Hence MATLAB code is working correctly.