Project 2 - Rankine cycle Simulator
AIM - The aim of this project is to write the MATLAB program to calculate the states of the thermodynamic processes and also plot the T-S and the H-S diagram.
THEORY-
The Rankine cycle or Rankine Vapor Cycle is the process widely used by power plants such as coal fired power plants or nuclear reactors. In this mechanism, a fuel is used to produce heat within a boiler, converting water into steam which then expands through a turbine producing useful work. This process was developed in 1859 by Scottish engineer William J.M. Rankine. This is a thermodynamic cycle cycle which converts heat into mechanical energy—which usually gets transformed into electricity by electrical generation.
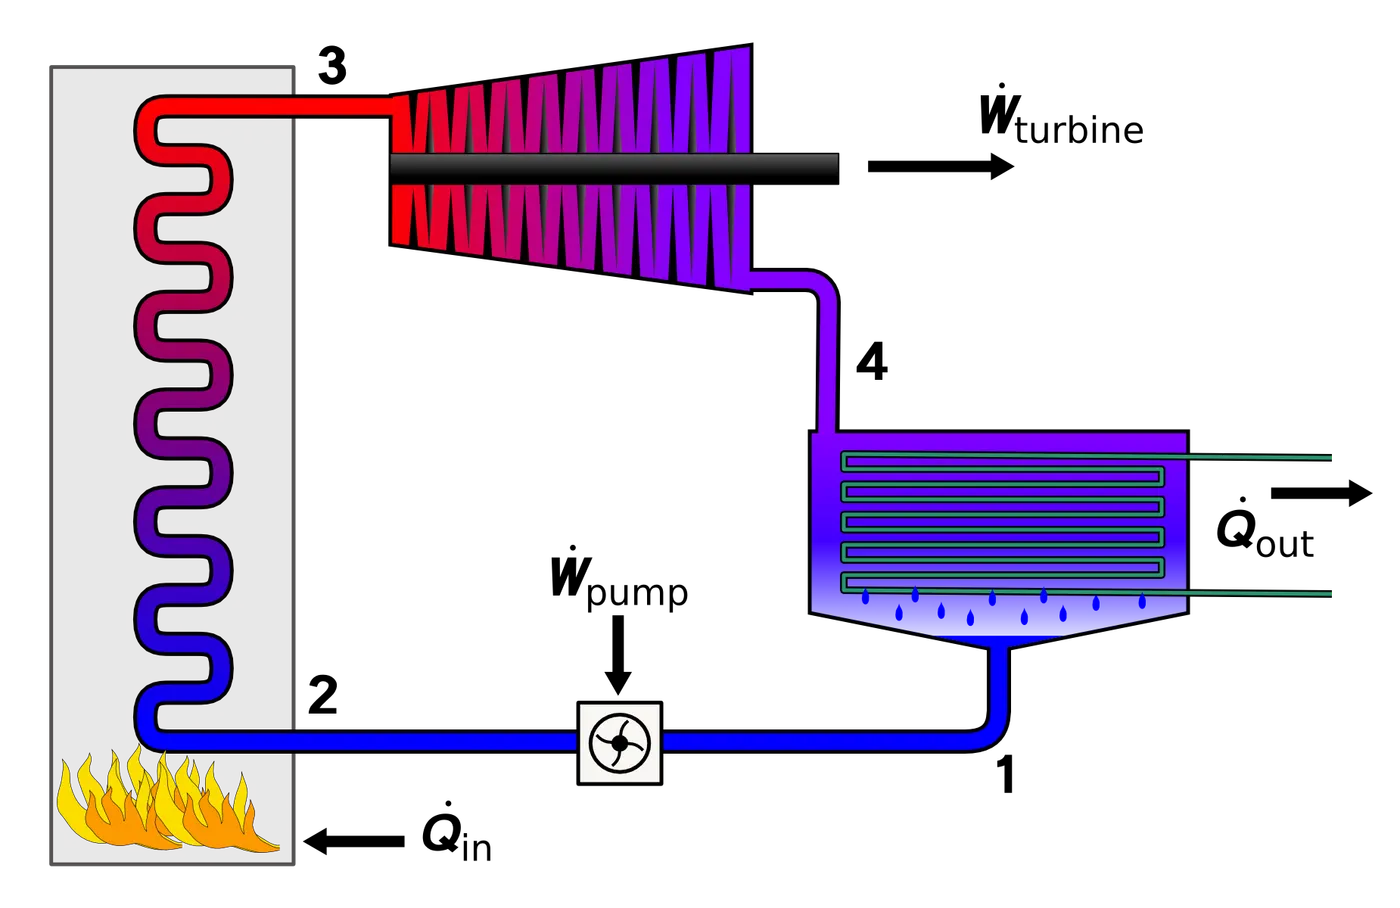
There are four processes in the Rankine cycle.
Process 1–2: [Isentropic compression]The working fluid is pumped from low to high pressure. As the fluid is a liquid at this stage, the pump requires little input energy.
Process 2–3: [Constant pressure heat addition in boiler]The high-pressure liquid enters a boiler, where it is heated at constant pressure by an external heat source to become a dry saturated vapour. The input energy required can be easily calculated graphically, using an enthalpy-entropy chart, or numerically, using steam tables.
Process 3–4: [Isentropic expansion]The dry saturated vapour expands through a turbine, generating power. This decreases the temperature and pressure of the vapour, and some condensation may occur. The output in this process can be easily calculated using the chart or tables noted above.
Process 4–1: [Constant pressure heat rejection in condenser]The wet vapour then enters a condenser, where it is condensed at a constant pressure to become a saturated liquid.
MATLAB CODE-
clear all
close all
clc

disp('Rankine Cycle Simulator');
disp('1-2=isentropic expansion in the turbine');
disp('2-3=constant pressure heat rejection by the condenser');
disp('3-4=isentropic compression in the pump');
disp('4-1=constant pressure of heat addition in the boiler');

%input parameters
P1=input('Enter the inlet pressure at the turbine(in bars):');
T1=input('Enter the inlet temperature at the turbine(in degree celsius):');
P2=input('Enter the pressure at condenser(in bars):');
disp('Results');


%calculation at the state point 1
%s_pT specific entropy as a function of pressure and temperature
s1=XSteam('s_pT',P1,T1);           %entropy(1)

%h_pT specific enyhalpy as a function of pressure and temperature
h1=XSteam('h_pT',P1,T1);            %enthalpy(1)


%calculation at the state point 2
s2=s1;                         %entropy
%sL_p   %saturated liquid entropy
%sV_p   %saturated vapour entropy
sf2=XSteam('sL_p',P2);
sg2=XSteam('sV_p',P2);
sfg2=sg2-sf2;
x2=(s1-sf2)/sfg2;             %dryness factor
T2=XSteam('T_ps',P2,s2);     %temperature(2)
hf2=XSteam('hL_p',P2);
hg2=XSteam('hV_p',P2);
h2=hf2+(x2*(hg2-hf2));        %enthalpy(2)

%Calculation at state point 3
P3=P2;
s3=XSteam('sL_p',P3);        %entropy(3)
h3=XSteam('hL_p',P3);        %enthalpy(3)
T3=XSteam('Tsat_p',P3);      %temperature(3)


%Calculation at statepoint 4
v4=XSteam('vL_p',P3);
P4=P1;
wp=v4*(P4-P3)*100;
s4=s3;                     %entropy
h4=wp+h3;                  %enthaly
cp4=XSteam('cpL_p',P3);
cv4=XSteam('cvL_p',P3);
gamma=(cp4/cv4);
g=(gamma-1)/gamma;
T4=T3*((P4/P3)^g);


%turbine work
wt=h1-h2;

%pump work
wp1=h4-h3;

%net work
w_net=wt-wp;

%Heat in and out of the system
q_in=h1-h4;
q_out=h2-h3;


%calculating thermal efficiency
n=w_net/q_in;
np=n*100;

%calculation of work back ratio
Bw_ratio=wp1/wt;

%Calcution of specific heat consumption
ssc=3600/w_net;

%plotting the thermodynamic processes
figure(1)
plot([s1 s2],[T1 T2],'linewidth',2,'color','r')
hold on
plot([s2 s3],[T2 T3],'linewidth',2,'color','r')
plot([s3 s4],[T3 T4],'linewidth',2,'color','r')

tf=XSteam('Tsat_p',P4);
sf=XSteam('sL_T',tf);
plot([s4,sf],[T4,tf],'linewidth',2,'color','r')

sq=XSteam('sL_T',tf);
plot([sf,sq],[tf,tf],'linewidth',2,'color','r')

sg_sat=XSteam('sV_p',P1);
plot([sq sg_sat],[tf,tf],'linewidth',2,'color','r')
plot([sg_sat s1],[tf,T1],'linewidth',2,'color','r')
grid on

%plotting the vapour and the liquid curve
temp1=linspace(0,400,1000);
for i=1:length(temp1)
    a(i)=XSteam('sL_T',temp1(i));
    b(i)=XSteam('sV_T',temp1(i));

end

plot(a,temp1,'linewidth',4,'linestyle','- -','color','g')
hold on
plot(b,temp1,'linestyle','- -','linewidth',4,'color','g')
xlabel('entropy(KJ/KGK)')
ylabel('temperature(Degree celsius)')
title('T-S diagram for rankine cycle')
text(s1,T1,'1')
text(s2,T2,'2')
text(s3,T3,'3')
text(s4,T4,'4')
text(sf,tf,'4*')
text(sg_sat,tf,'1*')

%plotting the thermodynamic processes for h-s diagram
figure(2)
hold on
plot([s1 s2],[h1 h2],'linewidth',2,'color','r') %process 1-2
plot([s2 s3],[h2 h3],'linewidth',2,'color','r') %process 2-3
plot([s3 s4],[h3 h4],'linewidth',2,'color','r') %process 3-4
plot([s4 s1],[h4 h1],'linewidth',2,'color','r') %process 4-1
grid on

%plotting the liquid and the vapour curve
temp1=linspace(0,400,1000);
for i=1:length(temp1)
    a1(i)=XSteam('hL_T',temp1(i));
    b1(i)=XSteam('hv_T',temp1(i));

end
hold on
plot(a,a1,'linewidth',3,'linestyle','- -','color','b')
plot(b,b1,'linestyle','- -','linewidth',3,'color','b')
xlabel('entropy(KJ/KGK)')
ylabel('enthalpy(KJ/KG')
title('H-S diagram for rankine cycle')
text(s1,h1,'1')
text(s2,h2,'2')
text(s3,h3,'3')
text(s4,h4,'4')

%printing output
fprintf('At state point 1:\n')
fprintf('P1 is : %f(bar)',P1)
fprintf('\nT1 is : %f(degree celsius)',T1)
fprintf('\nH1 is : %f(KJ/KG)',h1)
fprintf('\nS1 is : %f (KJ/KGK)',s1)


fprintf('\nAt state point 2:\n')
fprintf('P2 is : %f(bar)',P2)
fprintf('\nT2 is : %f(degree celsius)',T2)
fprintf('\nH2 is : %f(KJ/KG)',h2)
fprintf('\nS2 is : %f (KJ/KGK)',s2)

fprintf('\nAt state point 3:\n')
fprintf('P3 is : %f(bar)',P3)
fprintf('\nT3 is : %f(degree celsius)',T3)
fprintf('\nH3 is : %f(KJ/KG)',h3)
fprintf('\nS3 is : %f (KJ/KGK)',s3)


fprintf('\nAt state point 4:\n')
fprintf('P4 is : %f(bar)',P4)
fprintf('\nT4 is : %f(degree celsius)',T4)
fprintf('\nH4 is : %f(KJ/KG)',h4)
fprintf('\nS4 is : %f (KJ/KGK)',s4)


fprintf('\nwt is : %f (KJ/KG)',wt)
fprintf('\nwp is : %f(KJ/KG)',wp)
fprintf('\nwnet is : %f(KJ/KG)',w_net)
fprintf('\nNTherm is : %f',np)
fprintf('\nssc is : %f (KJ/KW)',ssc)
fprintf('\nBack work ratio : %f',Bw_ratio)
CODE EXPLANATION
1. XSteam data function was used to extract the steam and the water properties from the file.
2.The program requires the input pressure,temperature at the same point and the temp at the condenser inlet pressure.
3.With the help of the inlets and also the XSteam data the program calculates all the states of the Rankine cycle.
4.the XSteam data works as eg- s1=XSteam('s_pT',P1,T1)
5.sf,sg and hf,hg where the f and the g stands for the saturated liquid and the saturated vapour.
6.net work,work done by turbine and the pump ,heat in and heat out are calculated using the standard thermodynamic relations.
7.Specific steam consumption (ssc) of the rankine cycle is also calculated.
8.Also the saturation curve is plotted for saturated liquid and saturated vapour.
9.The plot for T-S and H-S diagram are also plotted using the plot command.
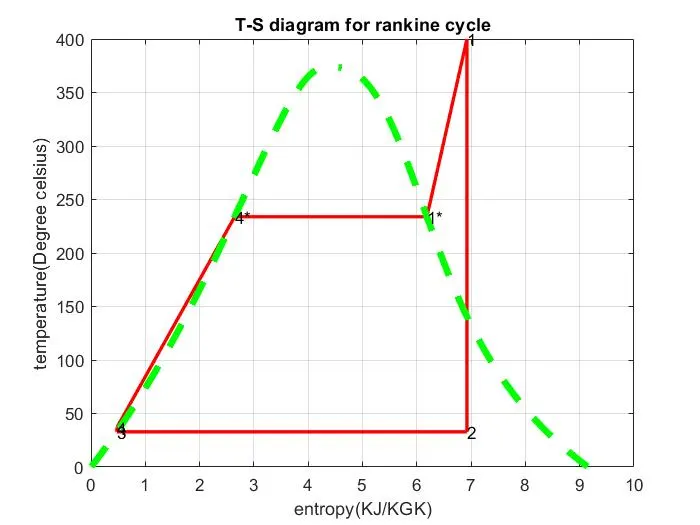
T-S PLOT
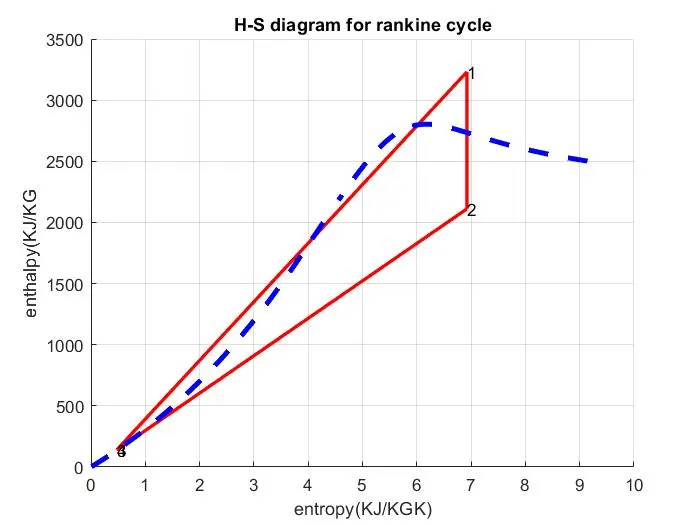
H-S PLOT
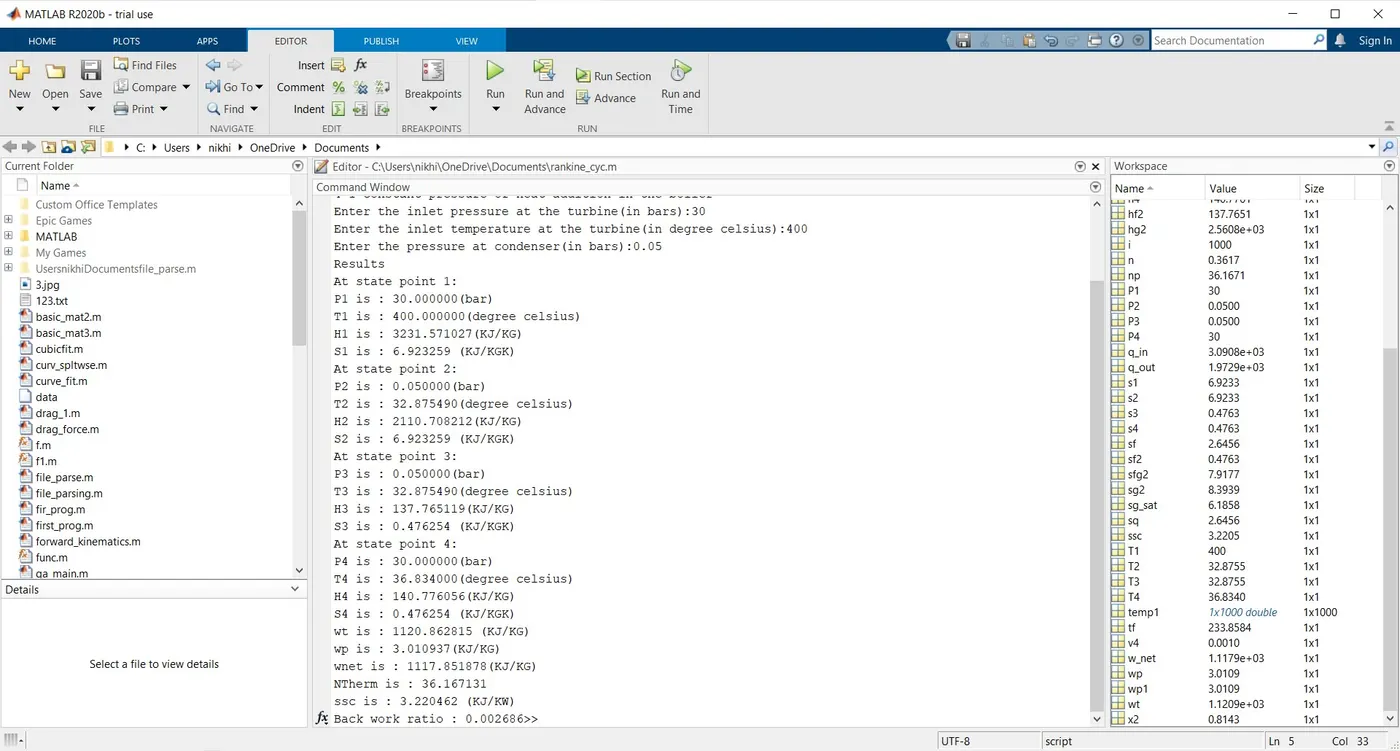
COMMAND WINDOW RESULTS-
CONCLUSION -
All the state points are calculated for rankine cycle and also the plots for T-S and H-S diagram.