Project 2 - Development of TFT Cluster Speedometer Software Component
Project2: Development of TFT Cluster Speedometer Software Component.
Develop the Simulink model based on the given requirements and also create SLDD file and link the same to the model.
Perform the complete V and V workflow for the obtained model
Development of TFT Cluster Speedometer Software Component
Cluster Instrument receives the signals from other ECU via CAN bus interface. It also receives commands from the driver via steering wheel buttons. The signals are then processed by the Cluster ECU, after which the Cluster ECU may send the vehicle information to the LCD or light the LEDs and so forth, according to the results. Therefore, the Cluster ECU can be viewed as a carrier of the information flow.
Requirements:
1.1 Calculating TFT Display Speed
|
Average Vehicle Speed would be displayed only if its between 2 kmph & 250 kmph. Any value outside this range will be discarded by its lower limit & upper limit |
|
When Average Vehicle Speed is < 2 kmph, DisplaySpeed = 2 kmph |
|
When Average Vehicle Speed is in between 2 kmph & 250 kmph, DisplaySpeed = Average Vehicle Speed |
|
When Average Vehicle Speed is > 250 kmph, DisplaySpeed = 250 kmph |
1.2 Main Data Filtering
|
Main Data Filtering subsystem will be activated for every 10th millisecond |
||||||
|
DisplaySpeed1 (t) = ((DisplaySpeed (t) x 0.65)/ Main Filter Speed Value) 0.05 |
1.3 Auxiliary Data Filtering
|
Auxiliary Data Filtering subsystem will be activated for every 10th millisecond |
|||||||
|
DisplaySpeed_Filter (t) = ((DisplaySpeed1 (t) x 0.78)/ Auxillary Filter Speed Value) - 0.03 |
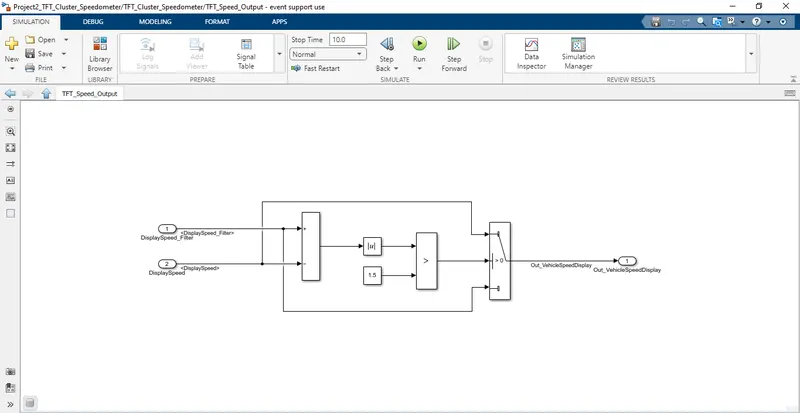
1.4 TFT Speed Output
|
If |(DisplaySpeedFilter - DisplaySpeed)| > 1.5 |
|
{ |
|
Vehicle Speed Display = DisplaySpeed |
|
} |
|
else |
|
{ |
|
Vehicle Speed Display = DisplaySpeed Filter |
|
} |
TFT Cluster Speedometer:
Instrument clusters are the interface with which the system interacts with the driver of a vehicle. Whether it is a four-wheeler or a two-wheeler, the important information about the vehicle such as vehicle speed, engine speed, fuel level, etc are conveyed by the cluster. They help drivers get informed decisions and are as important as any other part of an automobile.
Automotive Instrument clusters, just like any electronic device have been evolving a lot. The newest feature is the support for TFT LCDs with attractive graphics. For a requirement for a major Tier 1, Embien developed and demonstrated the Instrument cluster concept with its Sparklet GUI library optimized for Renesas RH850 series.
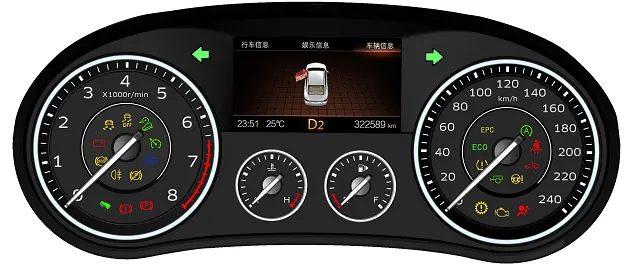
Initially the manufacturers added a limited display – a segmented or graphical type to extend the information availability. Multiple trip meters and odometers were included as part of the functionality. Then with falling LCD prices and cheaper microprocessors, OEMs started adding TFT display. These displays, being highly configurable offered numerous functionalities in a minimal space. Still the electromechanical dials were not ditched completely in favor of TFTs. The TFTs had a rather gradual entry into the space. Some initial configurations had TFT LCD at the center with dials in the sides or a dial in the center with LCDs in the sides.
Nowadays, OEMs and customers are open to have Full TFT displays. Having used to smartphones, the UX expectations from the cluster have increased manifold. TFT based ICs offer a lot of options that were not possible earlier. With the same space, the amount of information that can be displayed has increased. It is possible to have complex menus for configuration. Of the volley of data, only those of interest can be shown based on user preference. Users can also customize the look and feel of the display with the option of selectable themes.
It is also possible have attractive 3D graphics that are highly intuitive. And the contents of the display can be modified based on the current driving mode. Though it is not recommended to have a touch panel, with limited physical buttons, it is possible to interact with such an HMI.
Following are block used for model development :
- Input and Output block: we used for take input signal and give output signal
- Dynamic saturation block: used for upper and lower limit assin
- constant block: used for assign the constant value aacording to req.
- divide block: for used divide the signal
- Gain block:used for multiplication with input
- rem block: for remainder
- compare to zero block: the Compare To Zero block compares an input signal to zero.
- ABS block: Abs block outputs the absolute value of the input. For signed-integer data types,
- Switch block:for....if...else...condition
- Subsystem: used for acc to req for reduce the space
- enable subsystem: used for activate system after 10ms
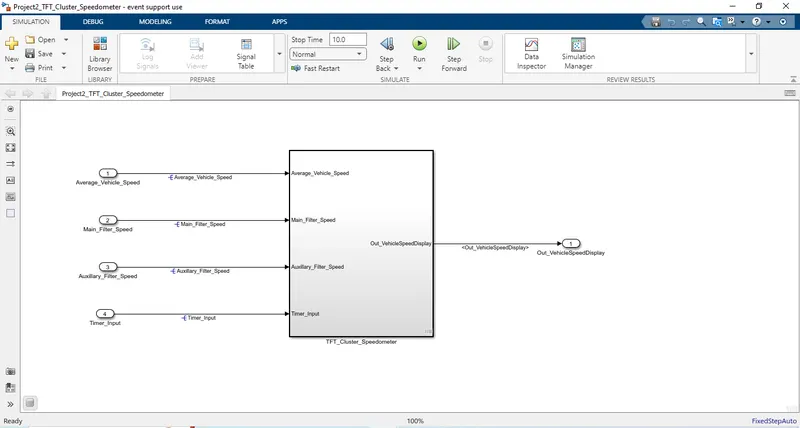
- Main model of Development of TFT Cluster Speedometer Software Component
Workflow of the project:
- simulink model file
- SLDD file
- requirement tagging report
- model advisor JMAAB
- fixed-point tool
- SLDV design error detection report
- functional test MIL,SIL harness,coverage reports
- SLDV test genration report
- Auto code generation report,main,c&h files
- polyspace analysis report/output
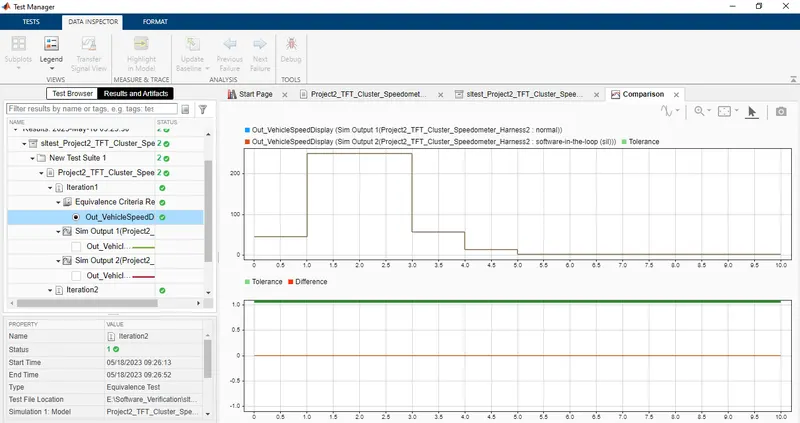
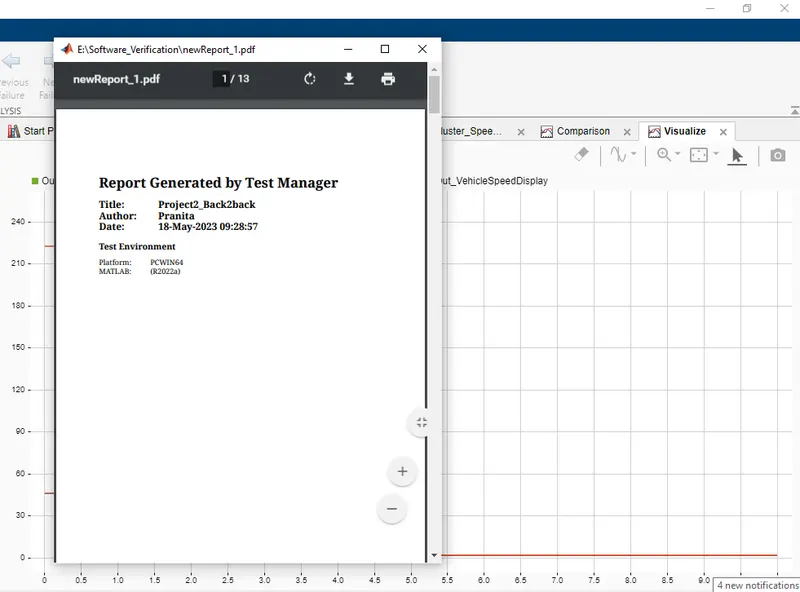
- Test manager report-baseline& back to back testing
Simulink Model:
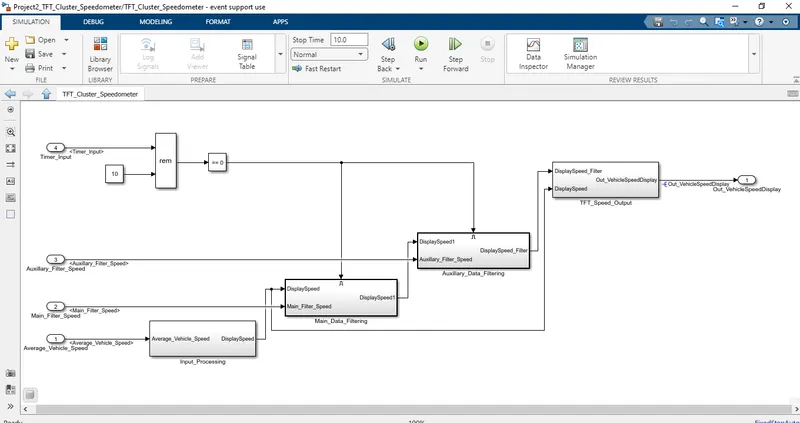
Requirement 1:
1.1 Calculating TFT Display Speed
|
Average Vehicle Speed would be displayed only if its between 2 kmph & 250 kmph. Any value outside this range will be discarded by its lower limit & upper limit |
|
When Average Vehicle Speed is < 2 kmph, DisplaySpeed = 2 kmph |
|
When Average Vehicle Speed is in between 2 kmph & 250 kmph, DisplaySpeed = Average Vehicle Speed |
|
When Average Vehicle Speed is > 250 kmph, DisplaySpeed = 250 kmph |
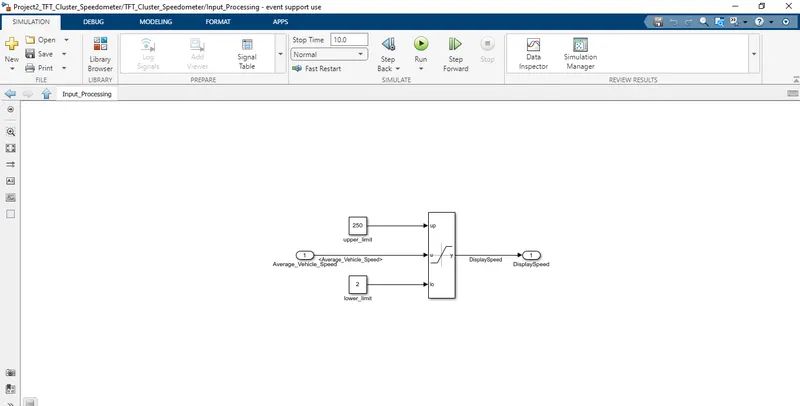
Requirement 2:
1.2 Main Data Filtering
|
Main Data Filtering subsystem will be activated for every 10th millisecond |
||||||
|
DisplaySpeed1 (t) = ((DisplaySpeed (t) x 0.65)/ Main Filter Speed Value) 0.05 |
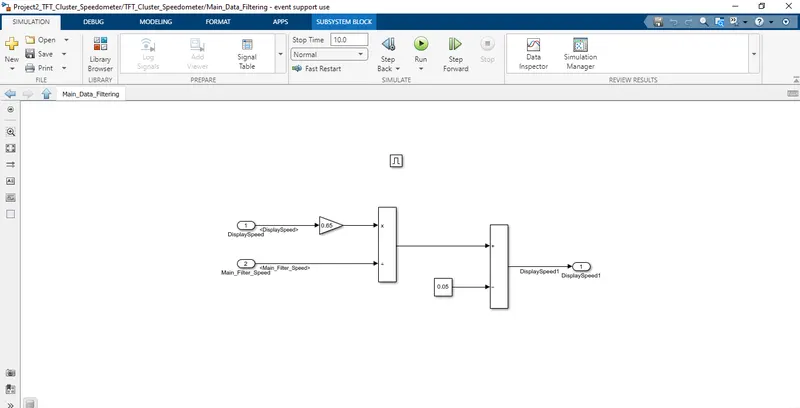
Requirement 3:
1.3 Auxiliary Data Filtering
|
Auxiliary Data Filtering subsystem will be activated for every 10th millisecond |
|||||||
|
DisplaySpeed_Filter (t) = ((DisplaySpeed1 (t) x 0.78)/ Auxillary Filter Speed Value) - 0.03 |
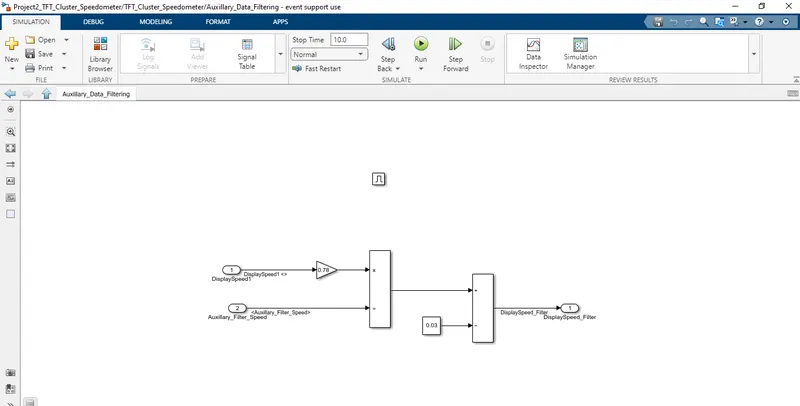
Requirement 4:
1.4 TFT Speed Output
|
If |(DisplaySpeedFilter - DisplaySpeed)| > 1.5 |
|
{ |
|
Vehicle Speed Display = DisplaySpeed |
|
} |
|
else |
|
{ |
|
Vehicle Speed Display = DisplaySpeed Filter |
|
} |
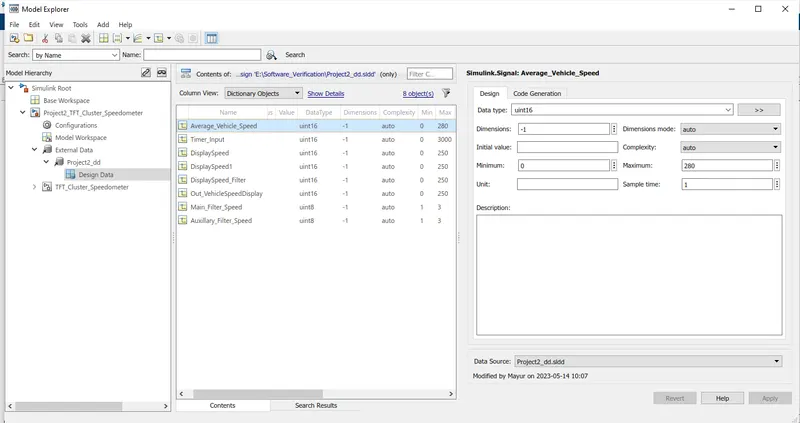
SLDD:
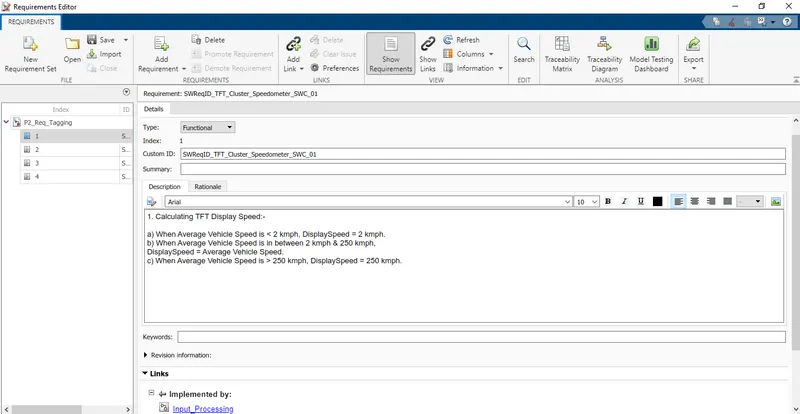
Requirement Tagging:
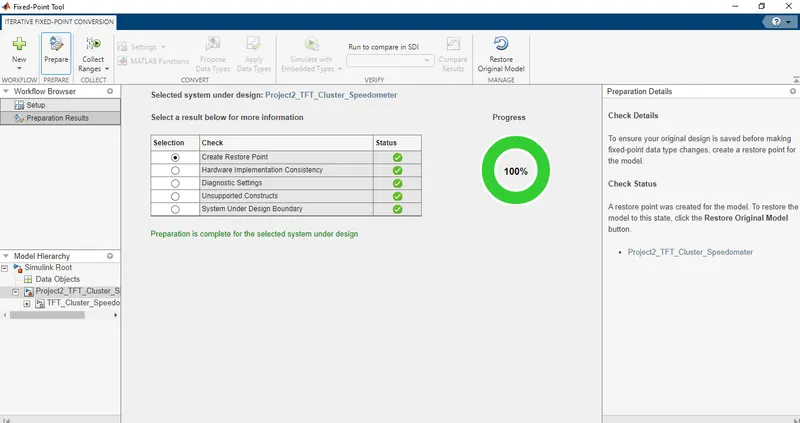
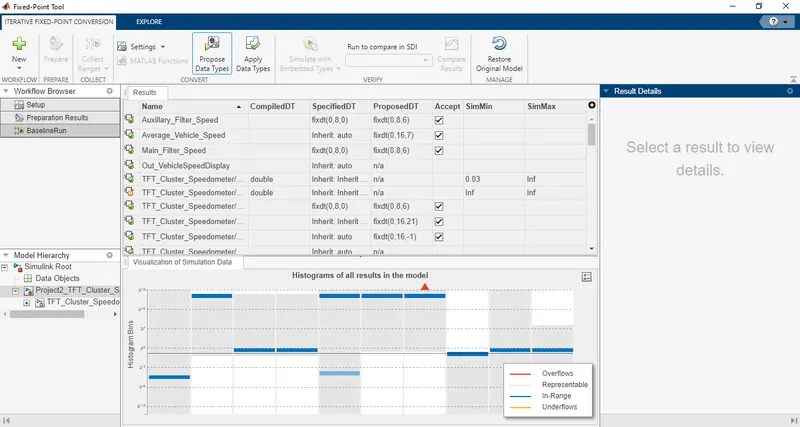
Fixed Point Tool:
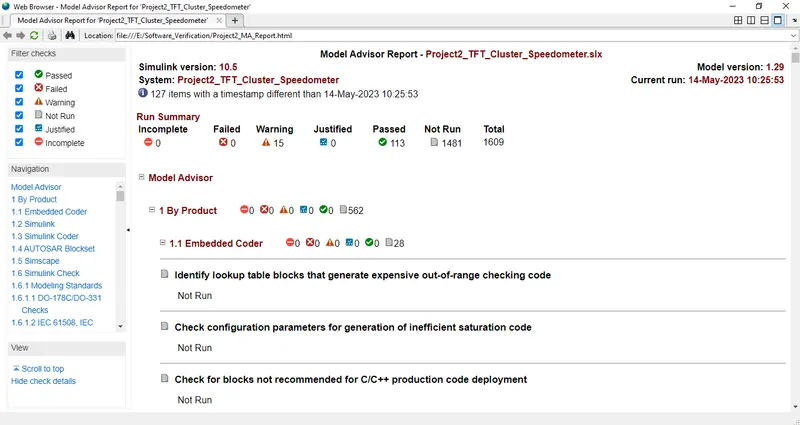
JMAAB Guideline Report:
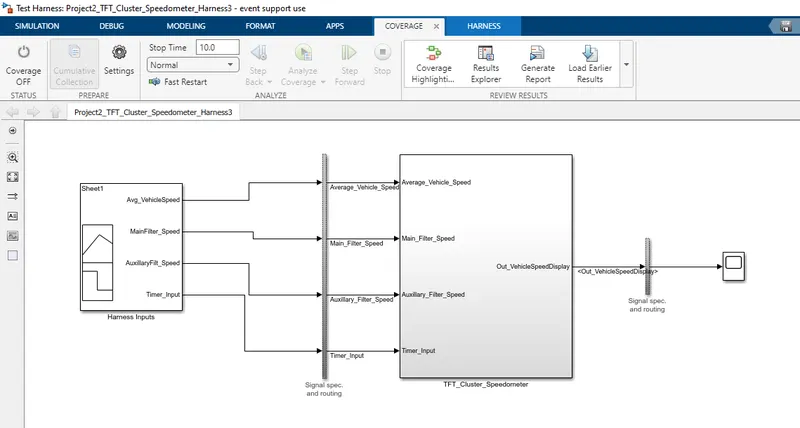
MIL Test Harness:
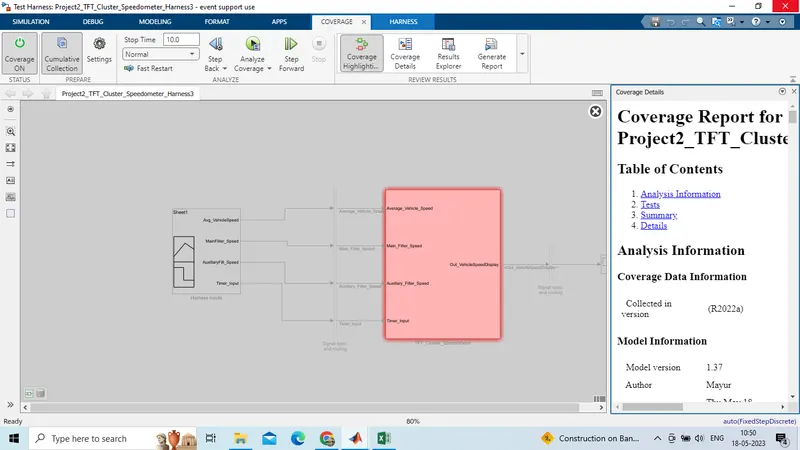
MIL Coverage Analysis:
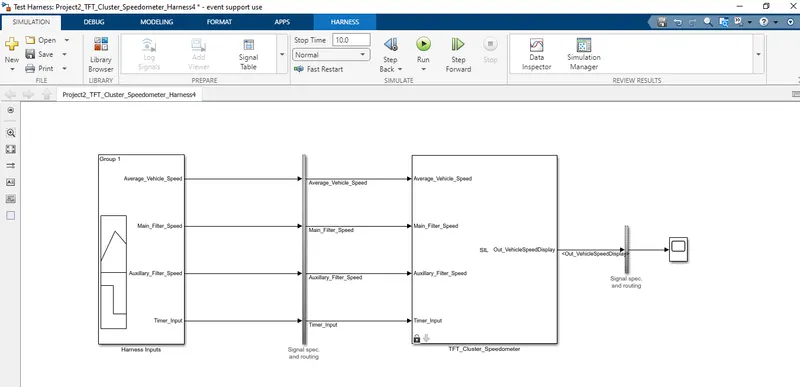
SIL Test Harness:
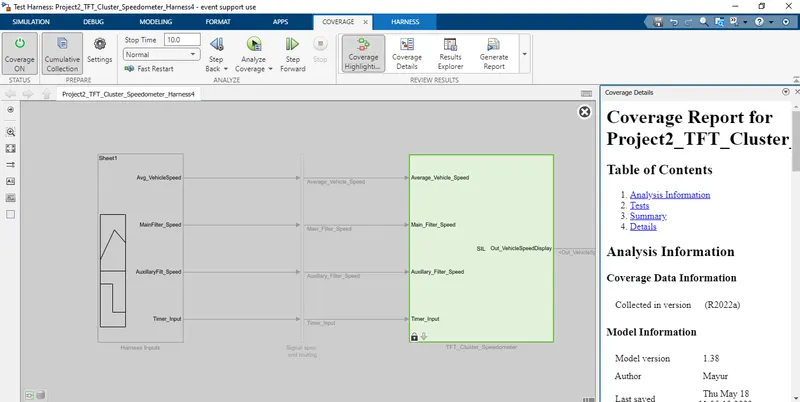
SIL Coverage Analysis:
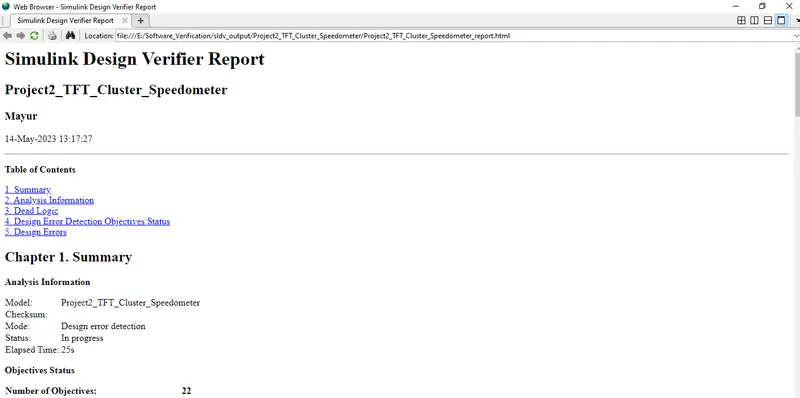
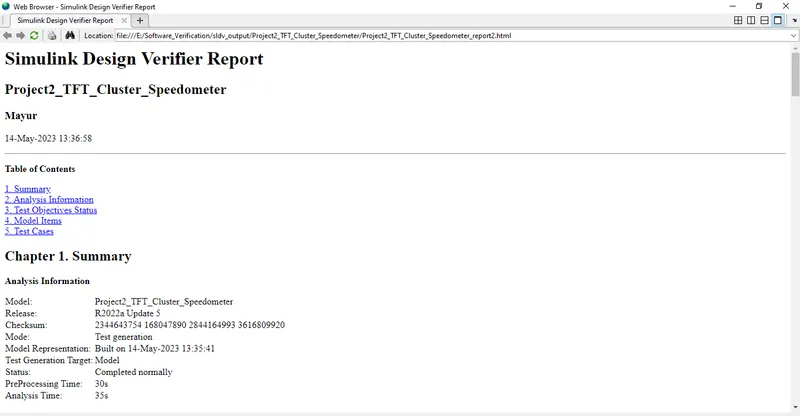
Design Verifier Report:
Test Generation:
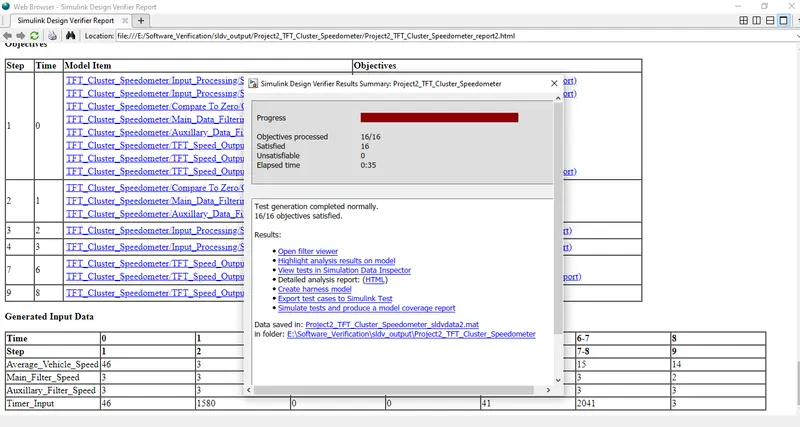
Test Generation Report:
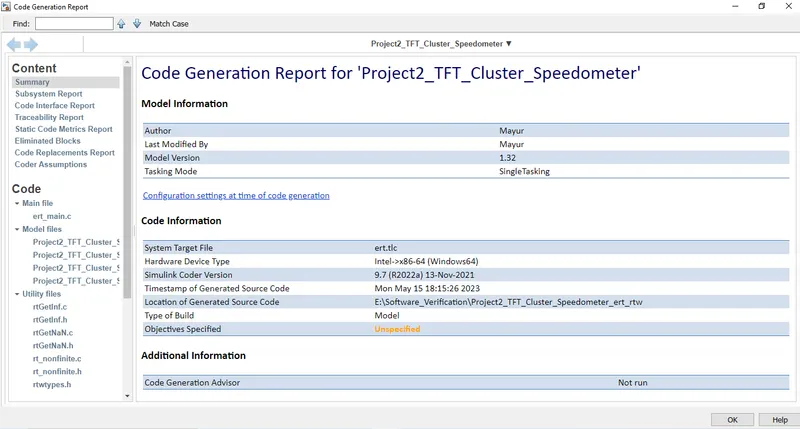
Code Generation Report:
Polyspace Analysis:
Steps to create a Polyspace Report:
- Initially, open the Polyspace in that new project click on start new project.
- The Project Properties dialogue box will open in that give the project name as we saved in the MATLAB,then select the location where it we need to save after that click Next or use the default location.
- Then ,it asks for the Projrct source,click on browserand select the folder where th .c file are generated then optionally we can add the include folder then clock on finish,the polyspace environment will open.
- In the configuraton settings option called Target & compiler select the source code language as c,change the target processor as X86_64.
- In the coding standards & code Metrics in that enable the check MISRA C:2004 also select the calculate the code metrics option
- After that go to bug finder analysis under that select the default one.
- Go to reporting enable the generate report option and ouput formet as PDF or any file we need
- Finally save the polyspace and run the Bug Finder.
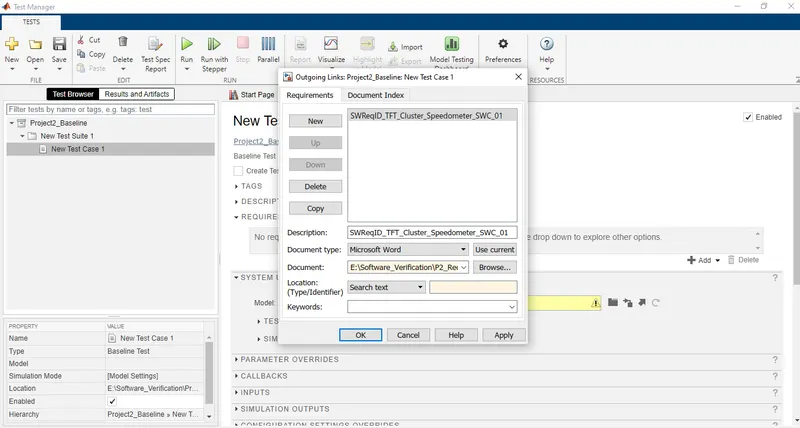
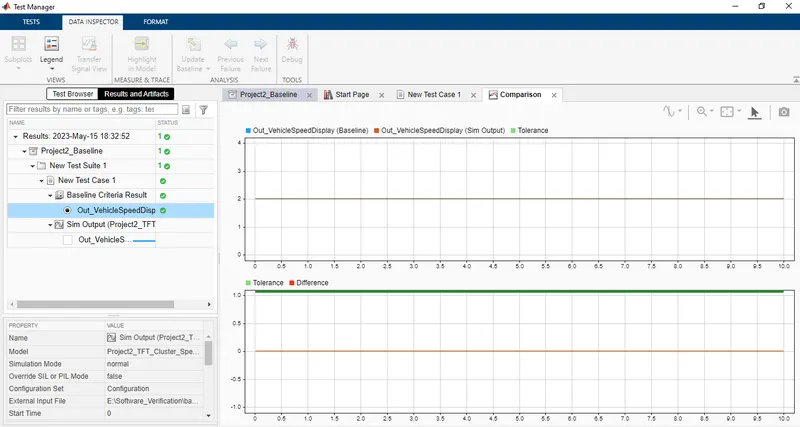
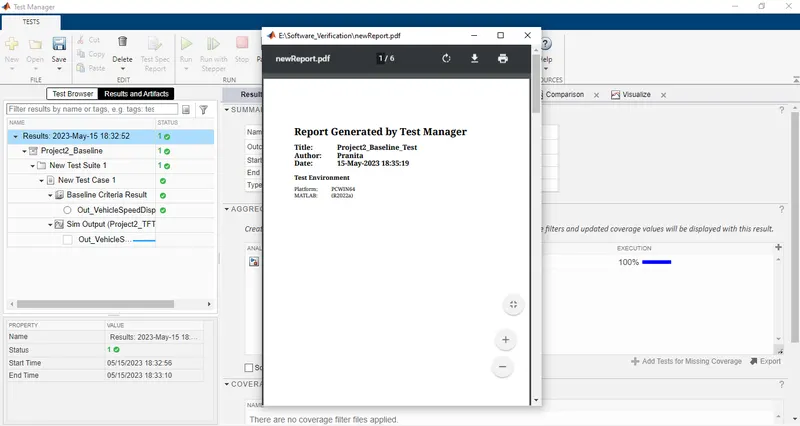
Baseline Testing:
Back to Back Testing: