Fuel cell vehicle system model
AIM:
Build a complete FC (Fuel Cell) vehicle system model with supercapacitors and secondary battery storage. The power distribution between the three energy sources is also compared by EMS (Energy Management Strategy).
Find vehicle H2 consumption, fuel cell current, voltage and SOC of battery, supercapacitor.
Simulink model:
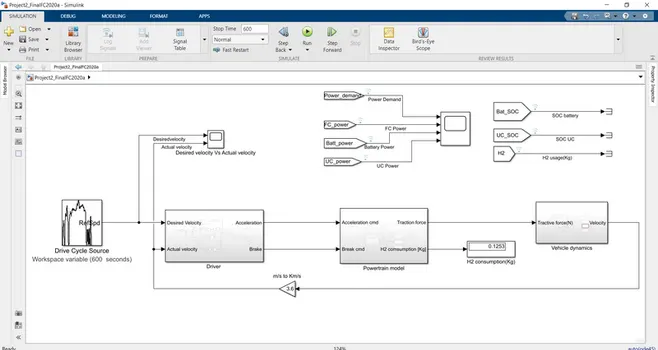
The full vehicle model is shown below.
Vehicle subsystem:
1) Drive cycle source - (desired speed as output).
2) Driver subsystem - (desired and actual speed - input, acceleration and braking commands - output).
3) Powertrain model subsystem - (acceleration and braking commands - input, thrust - output). acceleration/braking to torque demand subsystem.
4) Vehicle dynamics subsystem - (traction force - input, actual speed - output).
Modelling individual systems:
1) Drive cycle source -
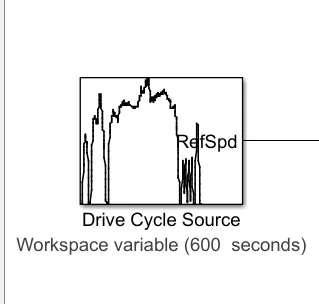
US06 drive cycle data is fed into the drive cycle source block.
The US06 disk cycle data file has been created and loaded into the base workspace. Since the drive cycle time is 600 seconds, we need to set the stop time to 600 seconds.
2) Driver subsystem-
Here is a model of the drive subsystem,
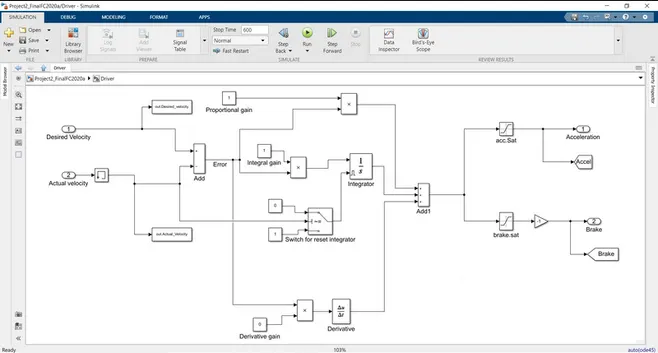
In this block, the inputs are the desired speed from the driving cycle source and the actual speed as feedback from the vehicle dynamics subsystem. The outputs of this subsystem are acceleration and braking commands.
Initially, the desired speed is subtracted from the actual speed of the vehicle and an error (difference) is produced in the speed output. This error output is provided as a proportional, integral, derivative output and added to produce the final acceleration/deceleration command output.
The error is multiplied by the proportional gain value of the proportional action output. The error is multiplied by the value of the integral gain and supplied to the integrator block to make the output of the integral operation. Designed a switch that resets the integrator so that when the vehicle speed goes to 0, the integrator is reset (switch o/p to 1 to reset) to repeat from the original phase. This action helps to correct the integration error value and prevent the integration state from ending.
The error is again multiplied by the derivative gain and fed to the derivative block to produce the output of the derivative operation. These steps are considered PID control of the vehicle speed.
All three Proportional (P), Integral (I) and Derivative (D) outputs are added to the ADD block to produce the final Accel/Brake command output. Saturation is 0 to 1 for acceleration commands and 0 to -1 for saturation multiplied by -1 for braking commands to account for braking commands that are positive. During acceleration, the brakes are disengaged and vice versa. Acceleration and braking do not occur simultaneously.
3) Powertrain model
This subsystem consists of an input acceleration command and braking command as shown in the figure below.
The output of this subsystem is the thrust force, which will be the input of the vehicle dynamics subsystem. This subsystem consists of different subsystems namely acceleration/braking commands for torque, power calculation, thrust, EMS, FC model, UC model and battery model.
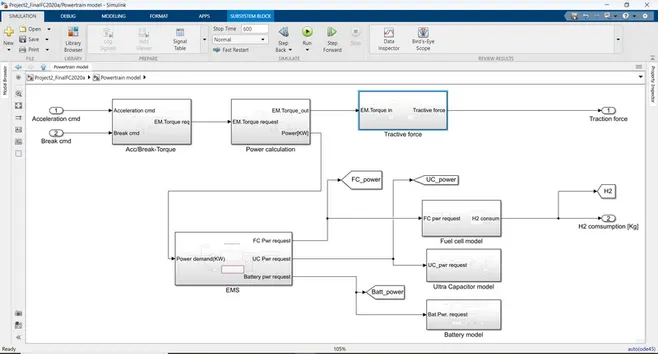
Acceleration and braking commands are initially converted to engine torque requests as output from the ACC/brake torque subsystem. This motor torque demand is then compared to the motor's angular velocity (internal power calculation subsystem) and the output is calculated as the motor's torque output and the power required to produce that motor's torque. From this engine torque as input, the total thrust from the propulsion subsystem can be calculated. This thrust is specified as the output of the entire powertrain unit.
The total power (power demand) calculated by the power calculation subsystem is fed to the EMS (energy management strategy) subsystem to generate the fuel cell (FC) power demand, the ultracapacitor (UC) power demand, and the battery power demand. EMS is used to create power sharing requests for FC, UC and battery models. Power is consumed/charged from these three power sources according to their power requirements. These current requests are provided as input to the associated FC model, UC model, and battery model to calculate their current, SOC, and voltage values. Fuel consumption (H2) is calculated from the fuel cell model subsystem as shown above.
Next, we can learn more about the operation of their subsystem,
Acc / Brake Torque Subsystem
In this subsystem, the inputs are the acceleration and braking commands, and the output is the EM torque request. The acceleration torque request is calculated by multiplying the acceleration command by the maximum torque value of the motor using the maximum block.
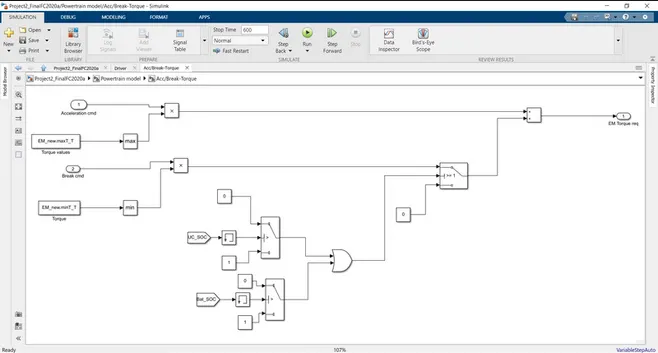
The braking torque demand is calculated by multiplying the braking command by the motor's minimum torque value using the minimum block. But before adding the two torque requests, check that the battery UC and SOC SOC is less than the maximum SOC limit.
When braking, regenerative energy is supplied to the UC or the battery. Therefore, to avoid overcharging the UC and battery beyond the maximum SOC limit, they are controlled by a switch unit. If both switches are 0, the output of the OR gate goes to 0, so that only the mechanical brake does the braking, not the motor.
The output of the OR gate must be 1 to charge the UC/battery. After the SOC check, the two torque requests are added to get the final engine torque request (EM.Torque.req).
These activities are implemented in this subsystem.
Power calculations
This subsystem uses the EM torque request from the ACC/Brake-Torque subsystem as an input and outputs the motor torque output based on the angular velocity of the motor.
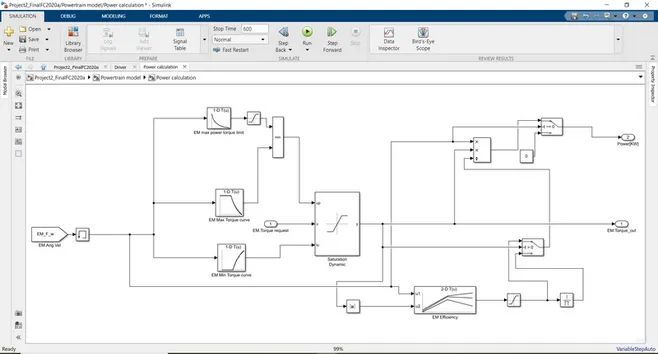
Engine angular velocity (EM_F_w) is provided as another feedback input to the propulsion subsystem. Extract the motor's maximum and minimum torque limits from the 1-D lookup table based on the motor's angular velocity.
The lookup table data is obtained from the data from the drawing table already created in the workspace. Create separate lookup tables for EM.Max torque values and EM.Min torque values.
The dynamic saturation block is used to saturate the variable maximum and minimum limits in the lookup table based on changes in the angular velocity of the motor. The final output of the dynamic saturation block is the final EM torque.
To calculate the power required to produce the torque of this motor, use the following formula:
Motor power = (motor torque * motor angular velocity) / motor efficiency.
The motor efficiency is based on the parameters angular speed and motor torque. Therefore, the efficiency is obtained from the efficiency data in a two-dimensional lookup table, and the angular velocity and motor torque are taken as input to the two-dimensional lookup table.
The required power is calculated by multiplying the angular velocity of the motor and the torque of the motor and dividing by the motor efficiency value. The angular velocity is then checked for 0 velocity, if the angular velocity is not 0, the output power is given as output only.
Tractive force Subsystem
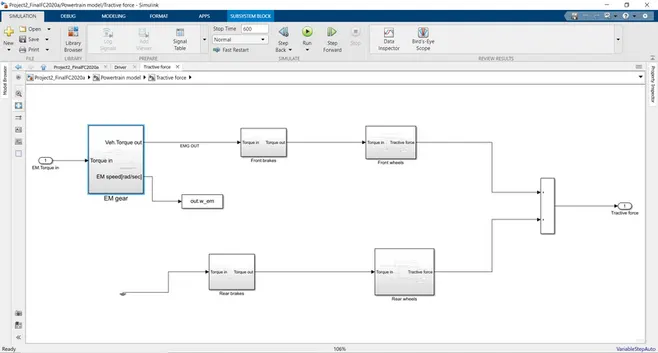
The system consists of various subsystems, viz
- EM gear.
- Front brakes.
- Front wheels.
- Rear brakes.
- Rear wheels.
EM gear
In this block, the input is the torque input from the power calculation subsystem and the output is the torque output of the vehicle.
The EM velocity (EM_F_w) in this subsystem is calculated in rad/s.
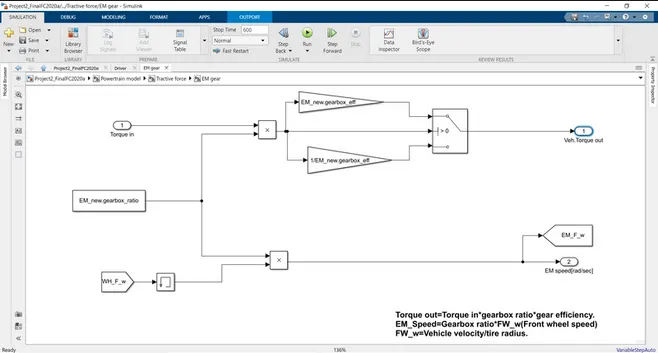
The formulas for calculating these results are as follows:
Output torque = input torque * gearbox ratio * gearbox efficiency.
EM_speed = gearbox speed ratio * FW_w (front wheel speed)
FW_w = vehicle speed/tire radius. The torque value is multiplied by the gear ratio and gearbox efficiency (positive torque), reverse gear efficiency (negative torque) to obtain the vehicle torque.
The angular velocity of the vehicle is multiplied by the gear ratio to obtain the angular velocity of the engine (EM_F_w).
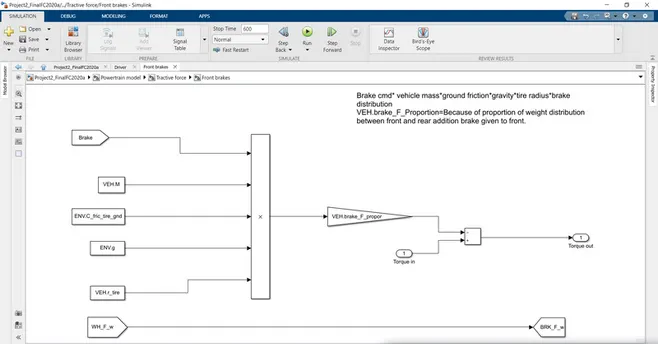
Front brake
In this subsystem, the torque caused by the unbalance of the vehicle weight between the front wheels and the front wheel torques is calculated separately from this subsystem.
It can give a ratio,
[Brake cmd*vehicle mass*ground friction*gravity*tire radius*front braking degree distribution]-[vehicle final torque] = front wheel torque output. T
his relationship is implemented in this subsystem.
Front wheel
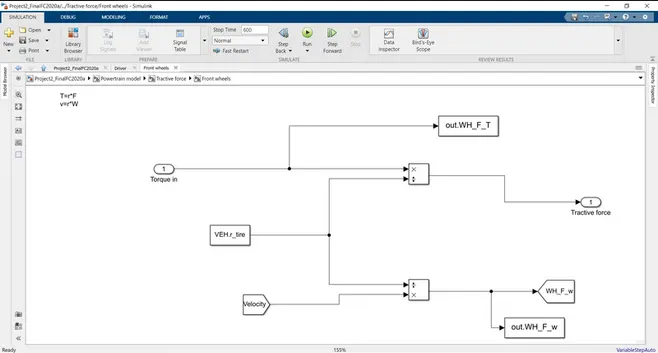
In this subsystem, the torque of the front wheels is converted into front wheel drive. Front wheel traction is obtained by dividing the front wheel torque by the vehicle's tire radius.
The vehicle speed is divided by the vehicle tire radius to obtain the vehicle angular velocity (WH_F_w).
Rear brake
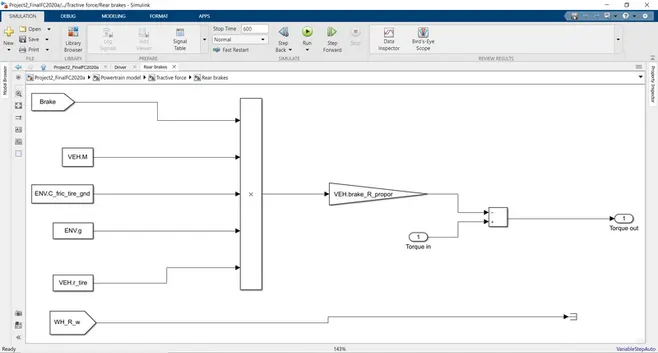
Since the rear wheels are only controlled by the mechanical brakes, the torque is initially fixed.
The rear wheel torque due to the mechanical braking torque is given by the ratio,
[Brake cmd*vehicle mass*ground friction*gravity*tire radius*rear braking degree distribution]-[Torque (Grounded)] = rear wheel torque is out.
This relationship is implemented in this subsystem.
Rear wheel
Rear wheel traction is calculated by dividing the mechanical torque by the vehicle's tire radius. It is implemented in this subsystem.
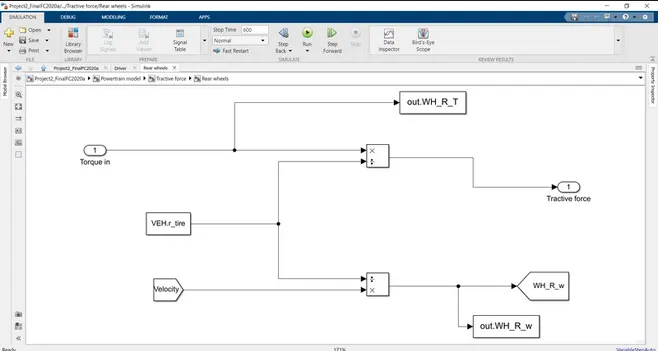
The front and rear traction forces are summed to produce the desired traction force for the final vehicle as output from the traction subsystem.
Energy Management Strategy
EMS processing flow:
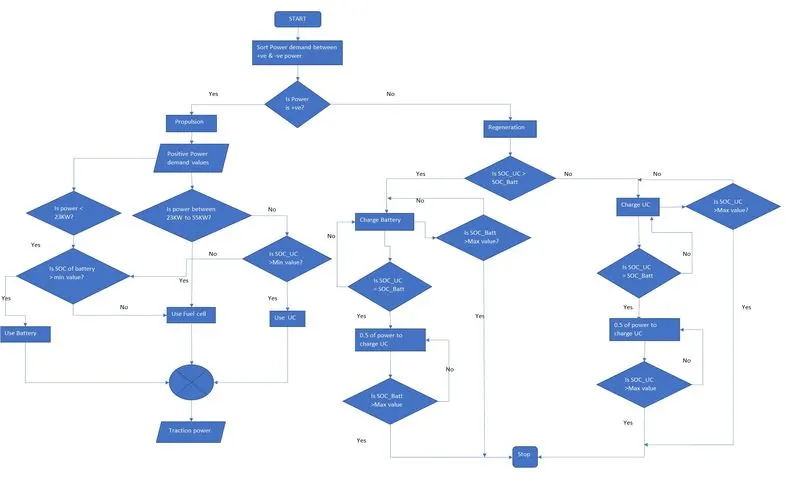
In this subsystem, we separate the power demand (power demand) from the power calculation subsystem as positive power demand (drive) and negative power demand (regeneration).
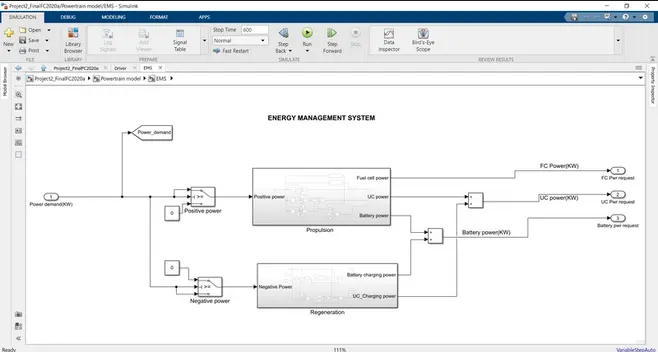
Check the power demand in the switch (positive power), if power >=0, the power demand value is moved to the drive subsystem.
If the power demand is negative, the negative power demand value is transferred to the regenerative subsystem.
Propulsion subsystem
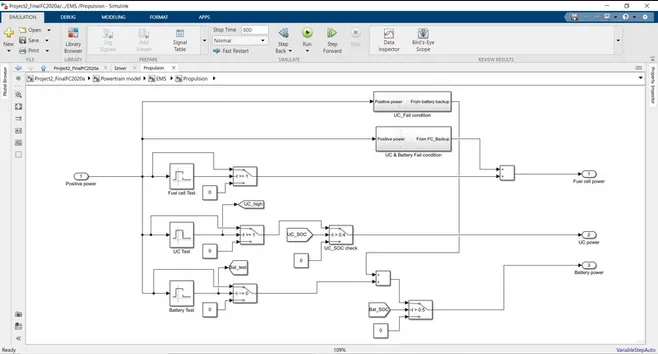
Power sharing:
In this subsystem, the positive energy demand is divided between the three energy sources of the fuel cell, supercapacitor and battery model.
Fuel cells have different operating conditions to generate propulsion power. Here we use fuel cells capable of generating a minimum of 23KW to a maximum of 72KW. But to make better use of the fuel cell effect, it can be seen on the polarization curve that the fuel cell will operate at maximum efficiency in the medium energy production region. Therefore, we are considering reducing the maximum fuel cell production capacity to 55KW.
Batteries are better suited for lower power consumption conditions, while supercapacitors are better suited for peak power requirements.
This gives us the final power distribution between the three components,
- 0 to 23 KW is obtained from the battery cells according to their SOC ratio.
- Above 23 KW to 55 KW, the power will be drawn from the fuel cell. And more than 55KW will be extracted from the supercapacitor according to its SOC state.
- If the UC SOC is not sufficient to meet the required power demand, then the power is taken from the battery as backup.
- If the SOC and UC of the battery are not sufficient to meet the energy demand, the backup energy source in this case can only be the fuel cell. Electricity comes from the fuel cell as a backup to the fuel cell. However, under these operating conditions, the overall efficiency of the vehicle is reduced because the fuel cell cannot meet peak power requirements and lower power requirements with full efficiency.
UC failure condition
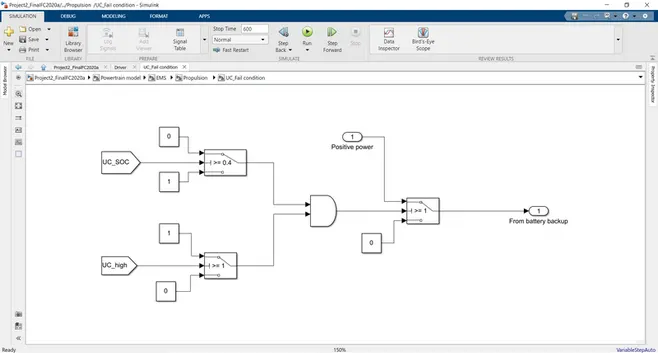
Check the UC SOC for an error using the switch and recheck the UC High test result for the power demand request.
If both AND gate inputs are 1, the UC current demand is compensated by the battery backup current if the battery capacity exceeds the Batt.SOC.min limit.
UC and battery failure condition:
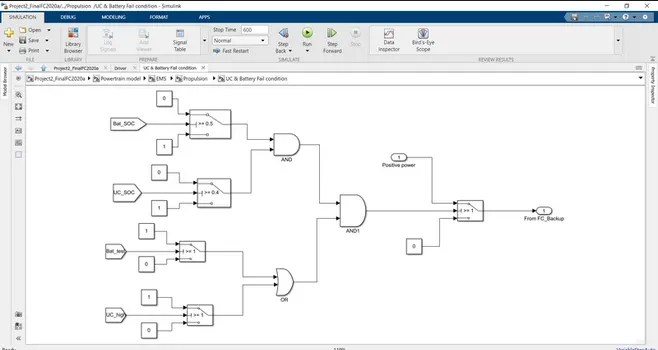
The SOC and UC of the battery are checked for failure via a switch and fed into an AND block because if both inputs are 1, the output is 1.
In addition, the test result of the battery test UC_high is checked again against its range power demand request and supplied to the OR block as long as both conditions are true. Therefore, if the outputs of the AND and OR blocks are both 1, the result of the AND1 block is 1 using the current demand from the UC and battery compensation from the fuel cell (FC) power.
Additional power request:
- The power from the FC test and standby FC power are added to get the final drive FC power.
- The battery test power and backup battery current are added to get the final drive battery power.
- The power from UC_test is used as the final drive UC power.
Regenerative subsystem
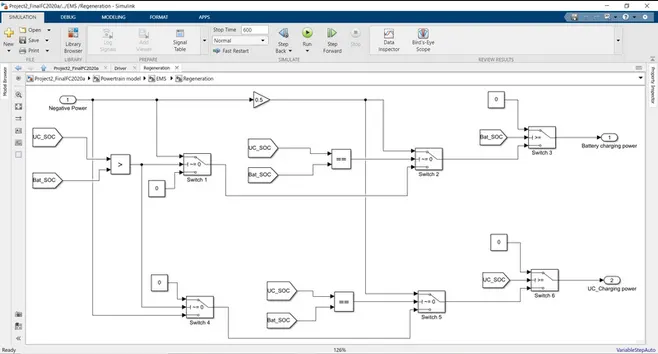
In the subsystem, regenerative power (negative power),
Check UC_SOC > UC_Battery via pin block. If the condition is true (1), the negative power demand is passed as the output of switch 1.
So if UC_SOC==Bat_SOC is checked, half of the negative power is given as battery charging power, and if that fails, the output of switch 1 is given as battery charging power. The charge capacity of this battery is checked in switch 3, as if Bat_SOC >90% charge does not occur, if the condition fails, the charge capacity of this battery from switch 2 is considered as the final charge capacity of the battery.
Check UC_SOC > UC_Battery via pin block. If the condition is false (0), the negative power demand is forwarded as the output of switch 4. So if UC_SOC==Bat_SOC is checked, half of the negative power is given as UC charging power, and failing that, the output of switch 4 is given as UC charging power.
This UC charging power is checked in switch 6, as if UC_SOC >90% charging does not occur, if the condition fails, this UC charging power from switch 5 is considered as the final UC charging power.
Finally, add the power request:
- Add the regenerated UC power and the final UC thrust to get the final output UC power demand.
- The final output battery power demand is obtained by adding the regenerative battery power and the final battery drive power.
- The final drive power is taken as the final output FC power demand.
Fuel cell (FC) model
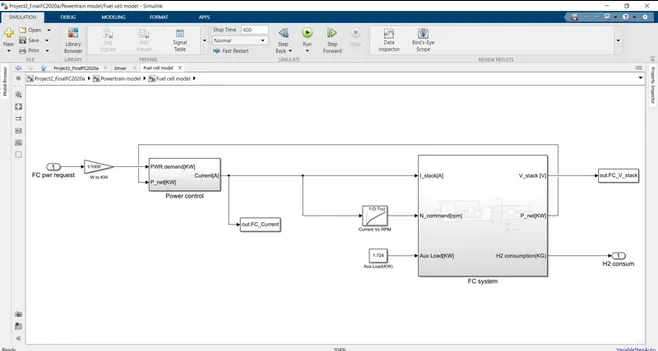
In this subsystem, the FC power demand is initially converted from watts to kilowatts. Then as an input together with the net power (P_net) obtained from the FC as feedback from the FC subsystem to the power control subsystem.
The output of the energy management subsystem is the total stack FC current. The FC compressor speed obtained from the Current Vs rpm lookup table is provided as input to the FC system.
Additional loads in KW are also fed into the FC system. The output of the FC system is H2 consumption (Kg), P_net, FC Stack voltage.
Power control subsystem
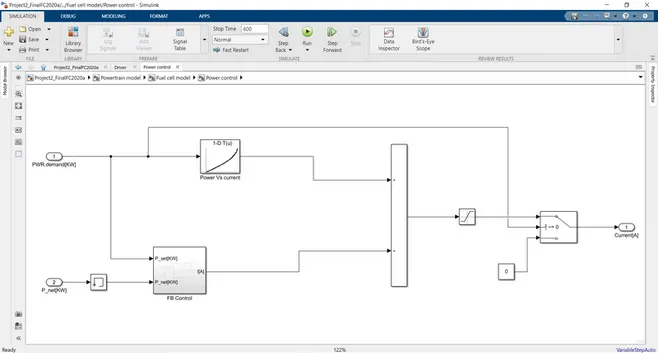
The FC power is obtained from the 1-D lookup table based on the FC power request power request.
FB control:
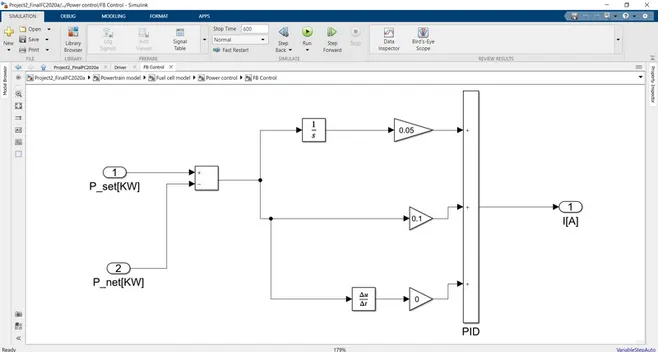
In the FB control subsystem, the power demand is compared to the FC net power to produce an error value that is fed into the proportional gain, integral gain, and derivative gain to obtain FC power demand request.
The current outputs from the lookup table and the FB control are summed and fed to the switches to obtain only positive power requirements to obtain the final FC stack current. This is because FC cannot chemically store energy.
FC system
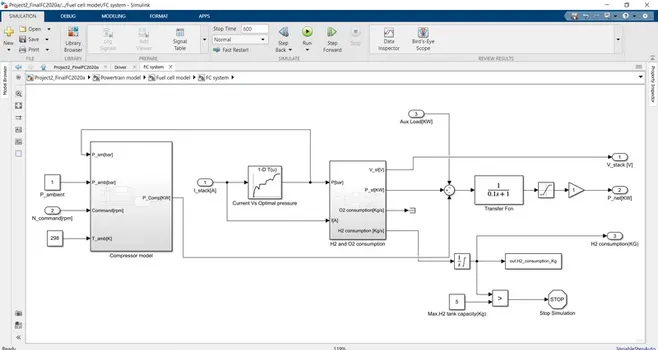
The fuel cell stack current is used to obtain the optimum pressure value from the current Vs optimum pressure lookup table as input to the H2 and O2 consumption subsystem. The stack stream also serves as input to this subsystem. The outputs of this subsystem are H2 consumption (Kg/s), O2 consumption (Kg/s), fuel cell stack power (KW) and stack voltage (V). Optimum pressure (bar) is given as input to the compressor model along with ambient pressure (bar), compressor speed (rpm) and ambient temperature (K) to obtain compressor output power.
Compressor model
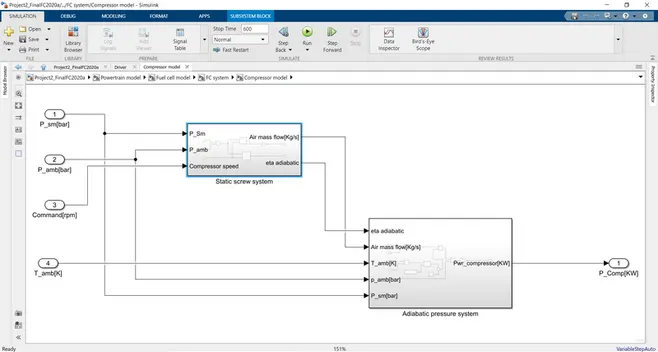
The output of this subsystem is compressor power (KW).
Static screw system:
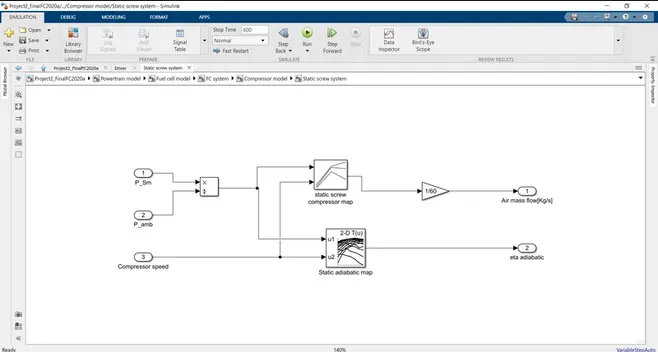
Divide the optimum pressure by the ambient pressure to obtain the pressure ratio used with the compressor speed to obtain the air mass flow value (Kg/s) from the 2D lookup table.
The same input is used to obtain the adiabatic pressure value of eta from the 2D lookup table.
Adiabatic pressure system
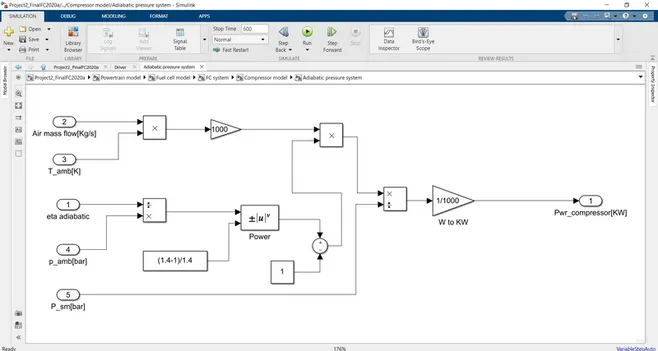
Air mass flow multiplied by ambient pressure multiplied again by [1-(pressure ratio^((1.4-1)/1.4))] and divided by optimum pressure to get compressor power.
H2 and O2 consumption system
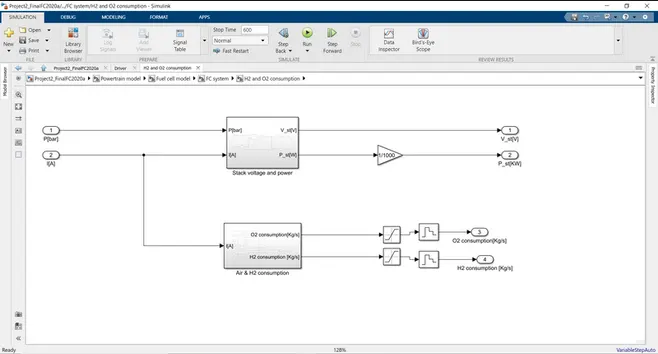
In this subsystem, the inputs are the optimum pressure and the stack current.
The outputs of the stack voltage and current system are the fuel cell stack voltage and the fuel cell stack power. O2 and H2 consumption is calculated in the second subsystem.
Stack voltage system
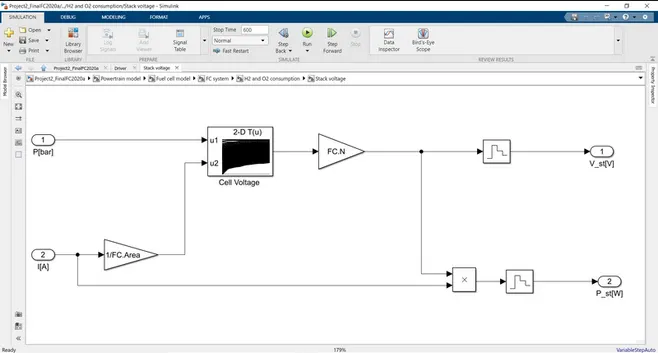
Using the optimum pressure and current density (obtained from the stack current), extract the individual FC voltage values from the 2D lookup table and multiply the number of fuel cells in series (FC.N) to obtain the total output FC stack voltage. . To obtain the output power of the FC stack, the stack current is multiplied by the total stack voltage.
Air and hydrogen consumption system
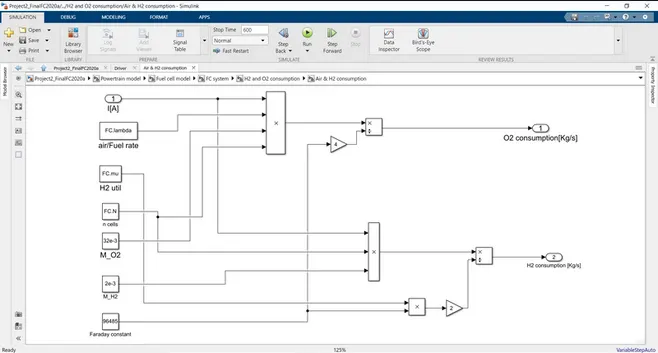
O2 consumption = (I*AFR*n_cell*O2 molar mass)/(4*Faraday constant)
H2 consumption = (I*n_cell molar mass*H2)/(2*H2 utilization factor*Faraday constant)
Based on the above conditions, construct the following subsystem to obtain the consumption values of H2 and O2 in kg/s. Subtracting the compressor power and additional load power values from the stack power gives the final useful power of the fuel cell.
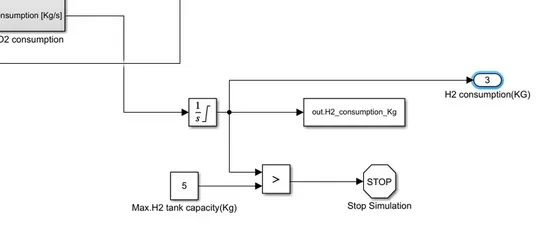
Conversion of H2 consumption from kg/s to kg
The H2 consumption in kg/s is combined with the time interval from 0 to infinity to obtain the synthetic fuel consumption (H2) in kg.
Also simulate the conditions under which the simulation will stop if the fuel consumption reaches more than 5 kg of the tank size.
Ultracapacitor model
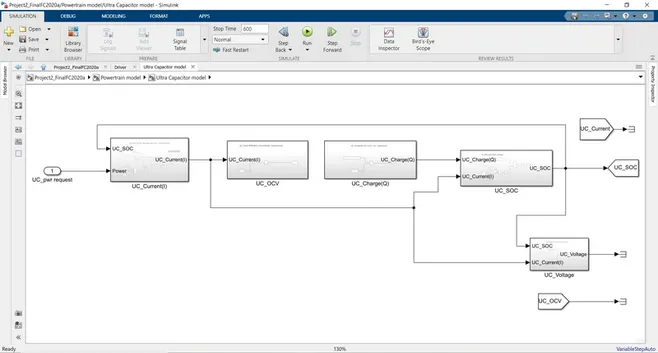
From this subsystem we will get the results of UC SOC, UC voltage and UC current values.
This subsystem consists of various subsystems viz
- UC_current.
- UC_OCV.
- UC_Charge.
- UC_SOC.
UC current
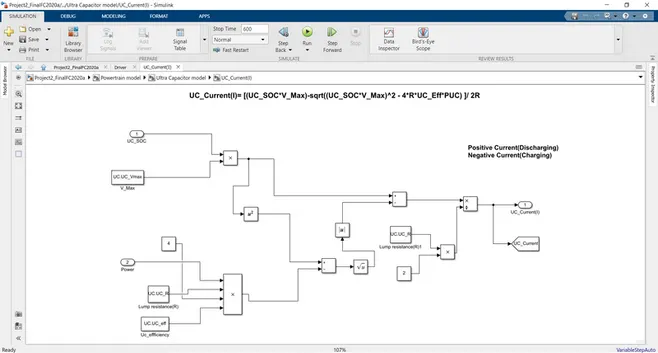
The current value of the supercapacitor is calculated according to the following conditions:

As shown above, this relationship is implemented in this subsystem.
UC OCV
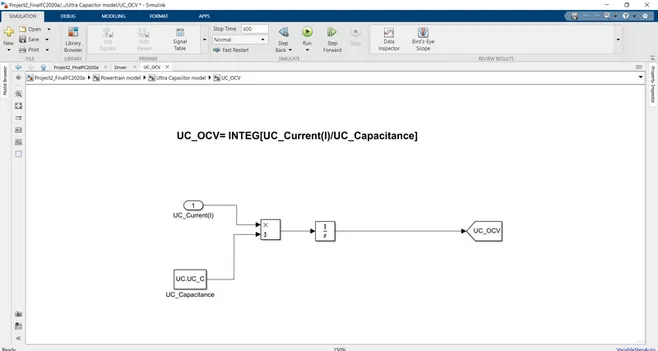
The relation to find the open circuit voltage of UC is
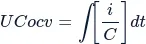
It is implemented in this subsystem.
UC_Charge
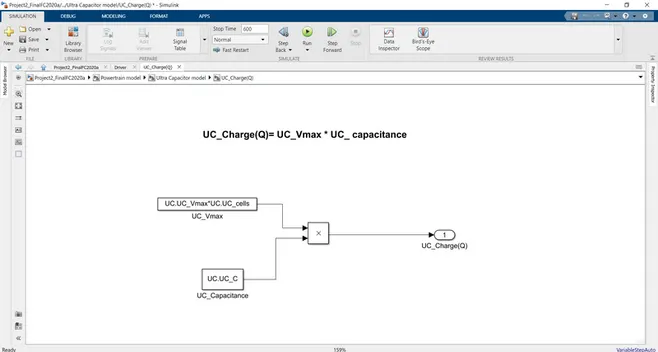
The net voltage of the supercap is multiplied by the UC capacitance to obtain the UC_charge value.
UC_SOC
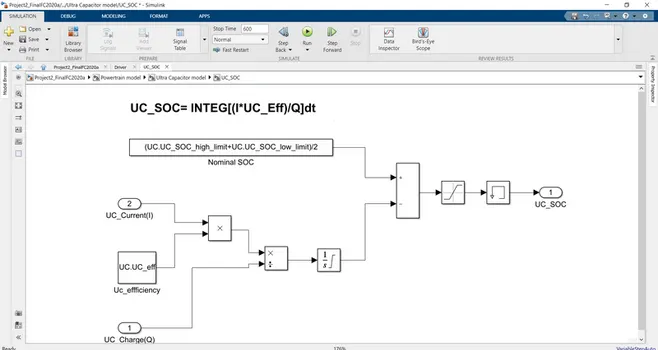
Calculate UC SOC based on the ratio below.
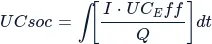
Subtract this composite SOC value from the UC nominal SOC value to obtain the final UC SOC value.
UC_Voltage
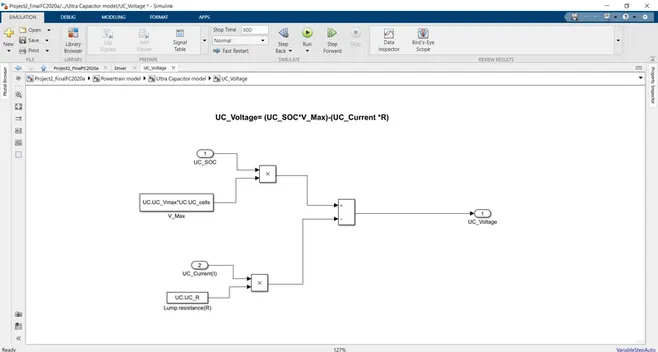
Find the relationship between UC voltage as,
UC(voltage)=(SOC*V_max)-(i*R)
As shown above, these relationships are created within this subsystem.
Based on the change in UC_SOC value, the voltage also changes with UC_Current value and UC resistance value (voltage drop due to internal capacitor resistance).
Battery model:
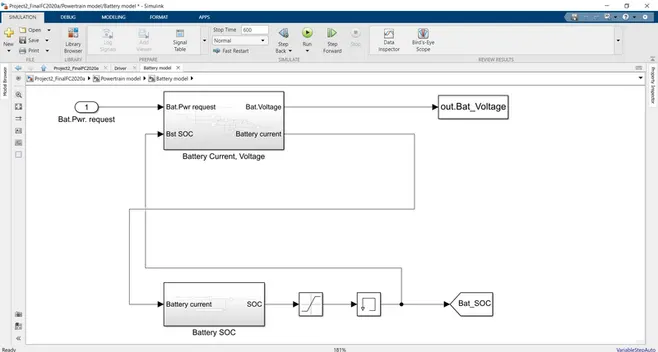
In this subsystem, the input is battery current demand, from this input we can calculate battery SOC value, battery current, voltage value.
Two subsystems are created, viz
- Battery current, voltage.
- Battery SOC.
Battery current, voltage
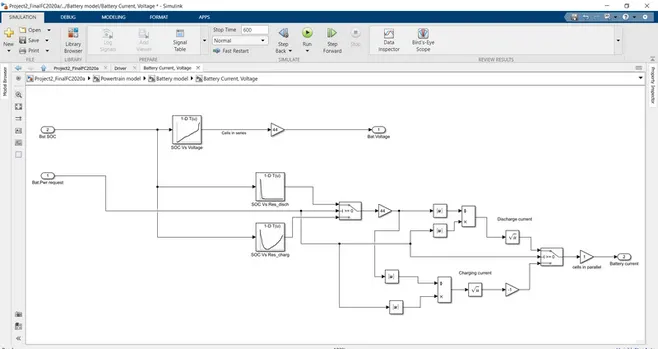
In this subsystem, the inputs are the battery current demand and the battery SOC as feedback from the SOC subsystem. Based on the battery SOC value, take the battery voltage value from the SOC Vs Voltage 1D lookup table and multiply it by the number of batteries in series (44) to get the battery pack voltage.
Based on the SOC value, the charge and discharge resistance values of the battery cells are obtained from a 1D lookup table multiplied by the number of cells in series (44), divided by the battery current demand, and squared to obtain the battery charge and discharge rate. current values. It's from a relationship

Here, the battery charge and discharge current through the switch is multiplied by the number of batteries connected in parallel to obtain the final battery current value.
Battery SOC
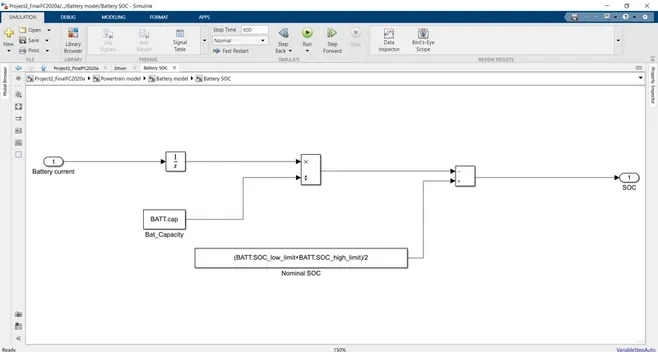
The battery current from the battery current, voltage subsystem is integrated and divided by the battery capacity and subtracted from the nominal battery SOC value to obtain the final battery SOC value.

where
discharges the positive current
charge negative current.
This relationship is reflected in this subsystem, where charging is indicated when the battery current is -ve because the SOC is added to the nominal SOC value, and discharging is indicated when the battery current is +ve because the SOC is subtracted from the nominal SOC value.
4) vehicle dynamics
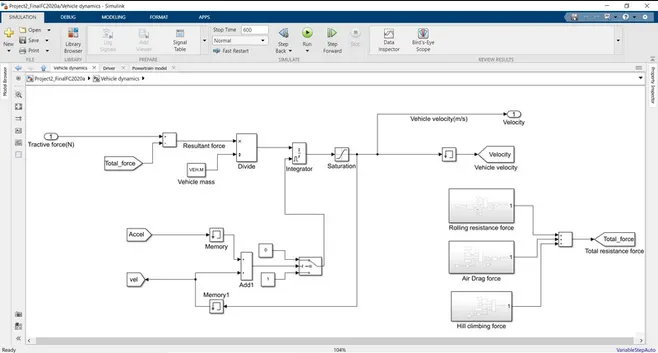
In this subsystem, the input is the total thrust force on the vehicle produced by the drive subsystem.
Subtract the total drag from the rolling resistance, drag and climb resistance from the total drag to get the resulting power. The resulting force is divided by the mass to obtain the acceleration value.
This acceleration value is integrated using an integrator block to obtain the vehicle velocity output. The output of the integrator block is provided to the saturation block to process speed values from 0 to infinity as the vehicle speed output.
When the vehicle speed reaches 0, the integrator block is reset. This is done because using an integrator block creates a wind-up.
Discontinuity means that when the actual speed matches the desired speed, sometimes the correction signal increases, which in turn causes the next decreased signal to reach the desired steady state speed. To avoid such a situation where the vehicle speed drops to zero, the integration unit must be reset.
This allows the integrator to resume work from its initial position after the vehicle has moved from its location. This action will avoid saturation conditions.
This can be achieved in the model by checking that the acceleration and velocity signals reach zero velocity. When the acceleration signal crosses 0, it means that the output of the memory block is 0, because the output of the memory block is a valuable input. This will delay the step.
As with the speed signal, a 0 crossing means that the output of the memory block goes to 0. The two values are added and delivered to the state of the contact.
If the summed value is greater than 0, the offset condition is met. Therefore, the integrator for positive values is not reset. If the accumulated value becomes 0, the switch condition fails. This resets the integrator.
rolling resistance
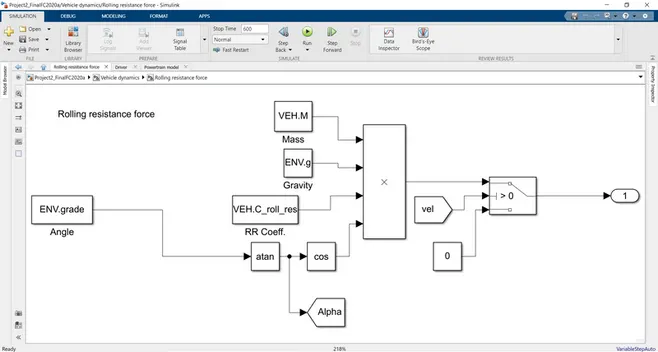
To determine the rolling resistance, we need to multiply the mass of the vehicle (Kg), the acceleration of gravity (m/s^2), the coefficient of rolling resistance and the cosine of the slope angle in radians. This can be expressed as the ratio,
Frr=mass*g*RR*cos(alpha)
Mass, g, RR values and tilt angles are given in the basic workspace.
The elevation angle in degrees is converted to radians by the trigger block atan. The transformed rad values are fed into the cosine block and multiplied by the other parameters as shown. Check the final RR force in the speed mode switch. If the velocity is positive, the RR force is specified as the output of this block.
Air resistance
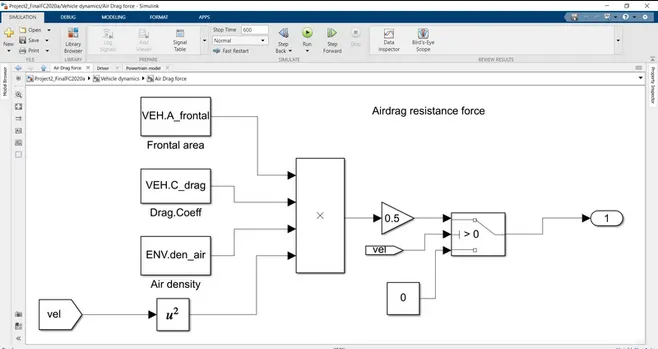
To determine air resistance, multiply the frontal area of the vehicle (m2), drag coefficient, air density (kg/m3) and vehicle speed squared (m/s). This can be expressed as
Faroe Islands=0.5*FA*ADcoef*Airden* (vehicle speed^2)
FA, ADcoef, Airden values are assigned from the base working area.
The vehicle speed is taken from the From block (output of the model) and squared by the block. All these parameters are multiplied by the product block and then multiplied again by an increment of 0.5 according to the above relation. This output is aerodynamic drag.
Hill climbing resistance
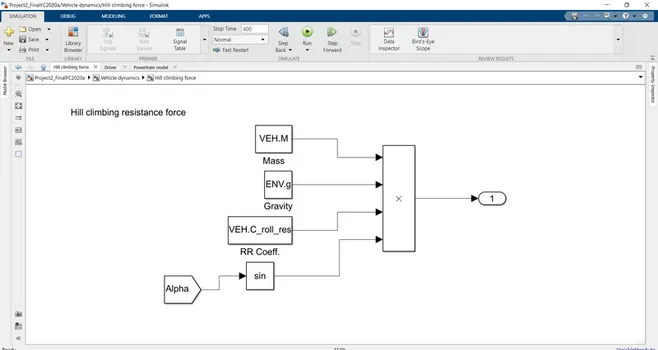
Climb resistance can be obtained by multiplying the mass of the vehicle (Kg), the acceleration of gravity (m/s^2), the coefficient of rolling resistance and the sine value of the elevation angle (unit rad).
This can be expressed as the ratio,
Fhc=mass*g*RR*sin(alpha)
Mass, g, RR values are assigned from the base workspace. The Sin of the pitch angle is obtained by the From block because the angle has been converted to radians in the rolling resistance calculation.
All the parameters are multiplied together in the product block to get the climb resistance as shown above. Finally, as we saw earlier, all these pulls are added and subtracted from the total pull to get the resulting pull.
Once the vehicle speed value is calculated, this speed is returned to the driver subsystem to compare with the desired speed from the drive cycle source. Initialization of workspace parameters: Using the script file attached to this project, all parameters are initialized as follows
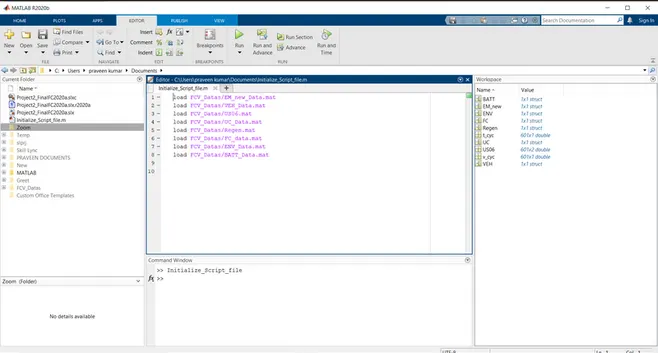
When we run this script file, all the data loaded in the workspace will be reflected in the model.
Result:
Since the duration of the driving cycle is 600 seconds, set the dwell time to 600 seconds and run the model.
Desired speed versus actual vehicle speed
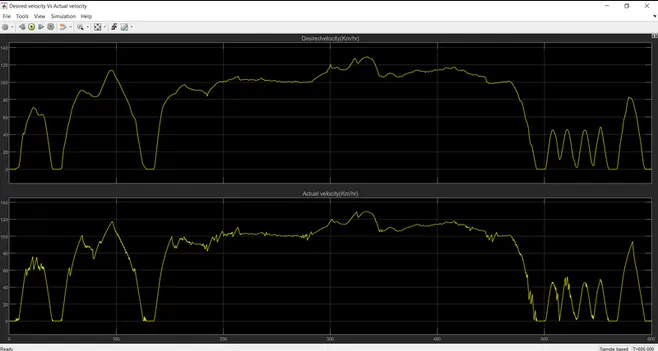
It can be understood from the figure that both the desired speed and the actual speed of the vehicle are controlled and matched.
Power sharing
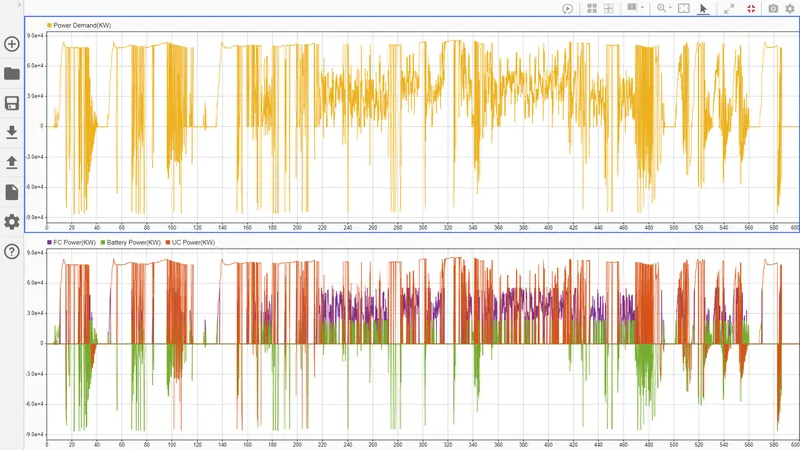
The figure above shows that the total energy demand is split between the battery, UC and fuel cell.
The power requirement above 55KW is realized with a supercapacitor. The power requirement of 0-23KW is realized by the battery.
Power requirements from 23KW to 55KW are all realized with fuel cells.
SOC and H2 consumption
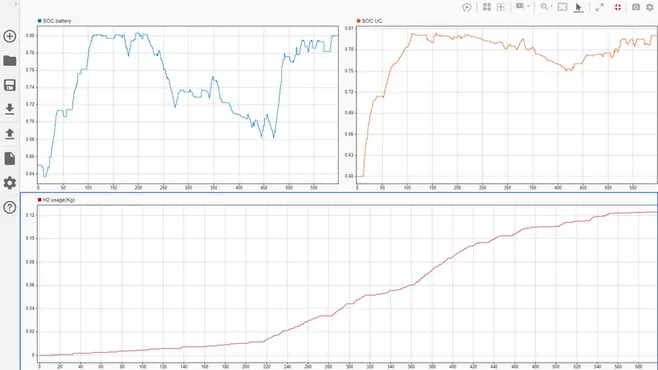
In these graphs, the first graph represents the SOC of the battery and the second graph represents the SOC of the UC. The SOC of the battery is charged and discharged according to the current demand. It starts at 65% of the SOC and we set the initial SOC as the nominal SOC(0.8+0.5)/2=0.65.
The SOC for UC charging and discharging starts from 60% SOC and we set the initial SOC as the nominal SOC (0.8+0.4)/2=0.6.
The hydrogen consumption is shown as 0.1228 kg and is shown in the model and its diagram as shown above.
FC Stack current
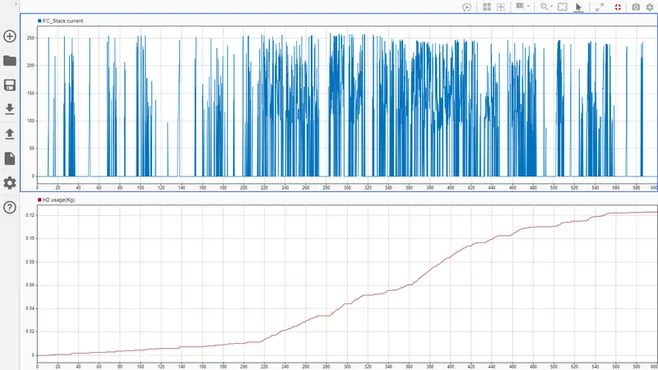
From this graph it can be understood that the power consumption from FC is more and hence the consumption of H2 fuel is also more.