Project 2
P1 Hybrid Vehicle architecture:
Positioned between the engine and transmission, the P1 hybrid architecture and High Voltage Integrated Starter Generators (HV ISG) enable high-efficiency power generation while featuring regenerative braking and acceleration assist.
High Voltage Integrated Starter Generators (HV ISG)
This hybrid technology enables high-efficiency power generation and motoring capability in a highly flexible package designed to fit between the engine and transmission.
FEATURES AND BENEFITS:
- Permanent magnet rotor
- BorgWarner S-wind stator technology
- Air/oil/WEG cooling options available
- Highly adaptable to different voltage, torque, and power requirements
The below image shows the functions of the hybrid system from P0, P1, P2, P3, P4, and P5.
The image below shows the vehicle hybrid architecture from P0, P1, P2, P3, P4, and P5.
The powertrain configuration of the MHEV system has a significant impact on the performance and characteristics of the vehicle, in terms of the:
- integration cost
- fuel efficiency
- dynamic performance (powertrain torque enhancement)
Automotive OEMs and automotive Tier 1 system suppliers are currently analyzing and evaluating several major powertrain architectures for MHEVs. The electric machine can be positioned, relative to the other powertrain components, in five major points:

Image: MHEV powertrain architectures
A brief description of the electric machine connection points is done in the table below.
| P0 | The electric machine is connected to the internal combustion engine through a belt, on the front-end accessory drive (FEAD) |
| P1 | The electric machine is connected directly to the crankshaft of the internal combustion engine |
| P2 | The electric machine is side-attached (through a belt) or integrated between the internal combustion engine and the transmission; the electric machine is decoupled from the ICE and it has the same speed as the ICE (or multiple of it) |
| P3 | The electric machine is connected through a gear mesh with the transmission; the electric machine is decoupled from the ICE and its speed is a multiple of the wheel speed |
| P4 | The electric machine is connected through a gear mesh on the rear axle of the vehicle; the electric machine is decoupled from the ICE and it’s located in the rear axle drive or in the hub of the wheel |
Crankshaft-mounted electric machine (P1)
The P1 architecture, with the electric machine connected directly to the crankshaft, is the solution adopted by Honda on their first generation Integrated Motor Assist (IMA) technology. The electric motor functions as a generator, during vehicle deceleration, as an engine starter, and as a motor (to assist the engine) during vehicle accelerations.

Image: MHEV P1 architecture – Integrated Starter Generator (ISG)
One of the biggest advantages of this solution is that the electric motor can provide higher torque than the BiSG since there is no belt limitation (due to slip). However, since there is no speed/torque ratio between the electric machine and the crankshaft, the torque requirements on the electric motor can be quite demanding.
Two examples of P1 MHEV architectures are:
- Honda Insight Hybrid 2009 (with Integrated Motor Assist technology)
- Mercedes Benz S400 Bluehybrid 2010

Image: Integrated Motor Assist (IMA) for mild hybrid
Credit: Honda
For example, the main characteristics of the crankshaft-mounted electric machine for mild hybrid Honda Insight 2009 are summarized in the table below.
| Electric machine performance | Maximum torque (at the crankshaft): up to 34 Nm Maximum power: 10 kW Efficiency: up to 94% |
| Hybrid modes (functions) | Idle Stop & Start Moving Stop & Start Engine load shift Torque assist (fill) Torque boost Sailing / Coasting Energy recuperation Brake regeneration |
| Advantages | Higher efficiency The 12V starter can be removed |
| Disadvantages | Output torque is limited by the size of the electric machine Energy recuperation affected by engine friction losses High impact on existing vehicle architecture The higher overall cost of the electrical components Air cooling is not possible for the electric machine |
| Overall characteristics | Torque Boosting Capability: High (if the electric machine is capable) Electrical Energy Recuperation: Medium (due to engine losses) Driveability Improvements: Medium (depending on the torque capability of the electric machine) Electrical Creep / Drive: Possible (depending on the torque capability of the e-machine) Packaging: Difficult components integration (powertrain specially designed for this architecture) System Efficiency: High (no gear mesh or belt losses) |
Initial Matlab script execution:
The vehicle, powertrain, and drive parameters are defined in the matlab script and it is used to load all the variables in the workspace to run the Simulink model and for post-processing. And also the drive cycle selection is done here. This m-file is simulated before executing the Simulink vehicle model.
The image below shows the m-script file defined with all the vehicle, powertrain, and drive parameters.
The vehicle, powertrain, and drive parameters are loaded in the workspace as shown in the image below.
Simulink Model setup and execution:
The vehicle model is simplified into blocks defining systems and subsystems. The below image shows the driver, controller, and powertrain system built using Simulink blocks.
Driver:
The driver subsystem model is built using various Simulink blocks as shown in the figure below.
Controller:
The controller subsystem model is built using various Simulink blocks such as mode selection state flow chart, Engine control unit, Transmission control unit, Electric motor control unit and Break control unit defined as system as shown in the figure below.
The vehicle operating mode selection logic model is built using various state flow features as shown in the figure below.
The Engine control unit subsystem model is built using various Simulink blocks as shown in the figure below.
Under Engine control unit system Idle speed controller subsystem model is built using various Simulink blocks as shown in the figure below.
The transmission control unit subsystem model is built using various simulink block and state flow features as shown in the figure below.
The transmission shift control logic model is built using various state flow features as shown in the figure below.
The Electric Motor control unit subsystem model is built using various Simulink blocks as shown in the figure below.
The Break control unit subsystem model is built using various Simulink blocks as shown in the figure below.
Powertrain:
The powertrain subsystem model is built using various Simulink blocks as shown in the figure below.
The Engine subsystem model is built using various Simulink blocks as shown in the figure below.
The Crank hub subsystem model is built using various Simulink blocks as shown in the figure below.
The Electric Machine subsystem model is built using various Simulink blocks as shown in the figure below.
The Transmission subsystem model is built using various Simulink blocks as shown in the figure below.
The Torque converter subsystem model is built using various Simulink blocks as shown in the figure below.
The differential subsystem model is built using various Simulink blocks as shown in the figure below.
The wheel subsystem model is built using various Simulink blocks as shown in the figure below.
The Vehicle subsystem model is built using various Simulink blocks as shown in the figure below.
Battery:
The battery pack subsystem model is built using various Simulink blocks as shown in the figure below.
Under battery system SOC Estimation subsystem model is built using various Simulink blocks as shown in the figure below.
Under battery system Voltage Estimation subsystem model is built using various Simulink blocks as shown in the figure below.
Postprocessing of Matlab script execution:
After executing the Simulink model the results are interpreted by defining the new variables and accessing the results obtained from the workspace. The below image shows the m-script defined and executed for result interpretation.
UDDS Drive Cycle:
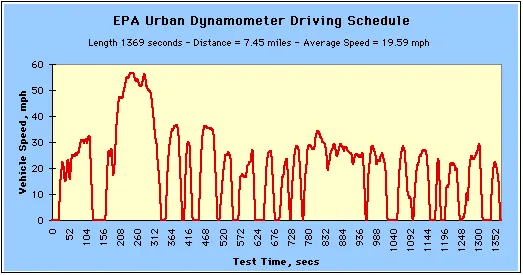
The EPA Urban Dynamometer Driving Schedule (UDDS) is commonly called the "LA4" or "the city test" and represents city driving conditions. It is used for light-duty vehicle testing. The UN/ECE Regulation 53 refers to the EPA UDDS as the "Test Equivalent to the Type 1 Test (verifying emissions after a cold start)."
Time Trace:
The below image shows the plot of an engine speed, transmission input, transmission output, and wheel speed performance while operating using the UDDS drive cycle.
Engine operating point:
The below image shows the plot of an engine operating point on the engine fuel map and torque curve while operating using the UDDS drive cycle.
Engine performance:
The below image shows the plot of engine torque, engine power, fuel rate, and fuel consumption performance while operating using the UDDS drive cycle.
Vehicle parameter:
The below image shows the plot of an accelerator and brake pedal, gear command, vehicle desired and actual speed, and vehicle distance travelled while operating using the UDDS drive cycle.
Motor performance:
The below image shows the plot of motor speed, motor torque, motor input power as a motor performance while operating using the UDDS drive cycle.
Battery performance:
The below image shows the plot of battery pack voltage, battery pack current, soc as a battery performance while operating using the UDDS drive cycle.
Motor operating point:
The below image shows the plot of an electric motor operating point on the energy map and torque curve while operating using the UDDS drive cycle.
HWFET Drive Cycle:
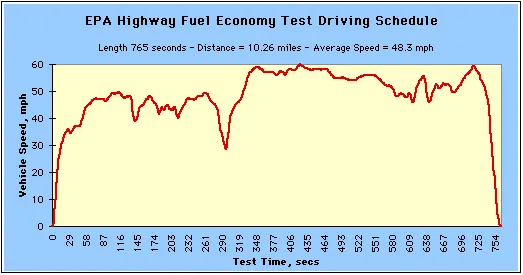
The Highway Fuel Economy Test (HWFET or HFET) cycle is a chassis dynamometer driving schedule developed by the US EPA for the determination of the fuel economy of light-duty vehicles [40 CFR 600, subpart B]. The HWFET is used to determine the highway fuel economy rating, while the city rating is based on the FTP-75 test.
Time Trace:
The below image shows the plot of an engine speed, transmission input, transmission output, and wheel speed performance while operating using the HWFET drive cycle.
Engine operating point:
The below image shows the plot of an engine operating point on the engine fuel map and torque curve while operating using the HWFET drive cycle.
Engine performance:
The below image shows the plot of engine torque, engine power, fuel rate, and fuel consumption performance while operating using the HWFET drive cycle.
Vehicle parameter:
The below image shows the plot of an accelerator and brake pedal, gear command, vehicle desired and actual speed, and vehicle distance travelled while operating using the HWFET drive cycle.
Motor performance:
The below image shows the plot of motor speed, motor torque, motor input power as a motor performance while operating using the HWFET drive cycle.
Battery performance:
The below image shows the plot of battery pack voltage, battery pack current, soc as a battery performance while operating using the HWFET drive cycle.
Motor operating point:
The below image shows the plot of an electric motor operating point on the energy map and torque curve while operating using the HWFET drive cycle.
Fuel Economy Numbers (kmpl) comparison of these numbers with the baseline numbers for the conventional vehicle model from Project 1 for both UDDS and HWFET cycle.
m-script has been written and executed to obtain the Fuel Economy Numbers (kmpl). The below image shows the m-script for fuel economy number.
UDDS
HWFET
| Fuel Economy Number (kmpl) | UDDS Drive Cycle | HWFET Drive Cycle |
| Conventional Vehicle | 16.853 | 21.204 |
| P1 Hybrid Vehicle | 25.386 | 37.018 |
| Percentage Improvement | 33.61 % | 42.72 % |
Conclusion and observation:
Following are the conclusion and observations made while working on the above projects:
1) Vehicle parameters have been assigned and the drive cycles are chosen to check the vehicle performance parameters using the m-script file in Matlab.
2) Simulink model has been built for the P1 hybrid vehicle by defining various systems and subsystems with the appropriate Simulink blocks and connected to obtain the relavent signals.
3) To analyze the performance of a given P1 hybrid vehicle parameter and the output obtained after completing the simulations is utilized to analyze the vehicle performance and behavior of vehicle due to the varying input conditions by defining and executing it in Matlab m-script file.
4) From the obtained results for both UDDS and HWFET drive cycles the vehicle performance trends are discussed as follows:
Fuel Economy Numbers (kmpl): Has been obtained for both UDDS and HWFET drive cycle. It can be seen that HWFET drive cycle has better performance than UDDS drive cycle. It can be seen that when comparing P1 hybrid vehicle fuel economy number with the baseline numbers (the conventional vehicle model from Project 1) for both UDDS and HWFET drive cycle are found to perform better and much effective.
Engine, transmission input, transmission output, and wheel speed output: Engine available and required torque is almost same for both UDDS and HWFET drive cycles. Transmission input and output trend remains the same and the magnitudes are changing between transmission input and output for both UDDS and HWFET drive cycles. The wheel speed is following the drive cycle trend for both UDDS and HWFET drive cycles.
Engine torque, engine power, fuel rate, and fuel consumption: Engine torque, power and fuel rate trend is same but the magnitude are different for both UDDS and HWFET drive cycles. Fuel consumption rate changes linearly for both UDDS and HWFET drive cycles.
Accelerator and brake pedal, gear command, vehicle desired and actual speed, vehicle distance: From the plot we can find that more frequent operation of break pedal is found in UDDS drive cycle than in HWFET drive cycle. And also the gear shift pattern changes more frequently in UDDS drive cycle than in HWFET drive cycle. Vehicle desired and actual speed matches the drive cycle trends and it can be observed in both the UDDS and HWFET drive cycles. Vehicle distance changes linearly as the vehicle continues to travel further until the simulation stops and it remains same for both UDDS and HWFET drive cycles.
Engine operating points on the engine fuel map: The dotted line between the two extrems of the engine operating range is the engine operating point and the fuel consumption is shown as a contour plot for both UDDS and HWFET drive cycles. And the maximum torque curve is plotted which indicate the available maximum torque at various opeating speed along with the fuel consumption. In UDDS drive cycle the operating point plotted are between the speed rang of 1200 to 2500 rpm at an effeciency around 0.1 to 0.3. In HWFET drive cycle the operating point plotted are between the speed rang of 1400 to 2500 rpm at an effeciency around 0.1 to 0.3.
Motor speed, motor torque, motor input power: Motor is operated in the speed range of around 50 - 450 rpm in UDDS drive cycle and around 0 - 380 rpm in HWFET drive cycle. Initially the motor torque remains constant around 40 Nm in UDDS drive cycle and around 45 Nm in HWFET drive cycle. Accordingly the motor input power varies in both UDDS and HWFET drive cycles.
Battery pack voltage, battery pack current, soc: Initially the voltage delivered from the battery is high and it remains constant for the complete drive cycle in both UDDS and HWFET drive cycles. And the peak current tries to vary based on the motor input response in both UDDS and HWFET drive cycles.
Motor Operating point: The dotted line between the two extrems of the energy map is a motor operating point shows the contour plot along with the efficiency for both UDDS and HWFET drive cycles.It can be seen that the motor is operating in low speed range between 0 to 500 rpm at the effiecieny range of around 0.6 to 0.65. And also certain amount of energy is recupurated back can also be seen in both UDDS and HWFET drive cycles.
Finally the hybrid vehicle has many advantages in terms of utilization of the available energy resources and use it in optimized manner during the working/operation of the vehicle.
Source:
https://x-engineer.org/mild-hybrid-electric-vehicles-mhev-types/