Project - Data Handling and Interpolation
OPEN THE SCRIPT FILE :
clc
d= xlsread('expriment_data.xlsx');
v = d(:,1);
i = d(:,2);
plot(v,i,'--');
xlabel('v volt');
ylabel('i amp');
v1=[-17.3;0.1;0.9];
i1=interp1(v,i1,v1);
hold;
plot(v1,i1,'r');
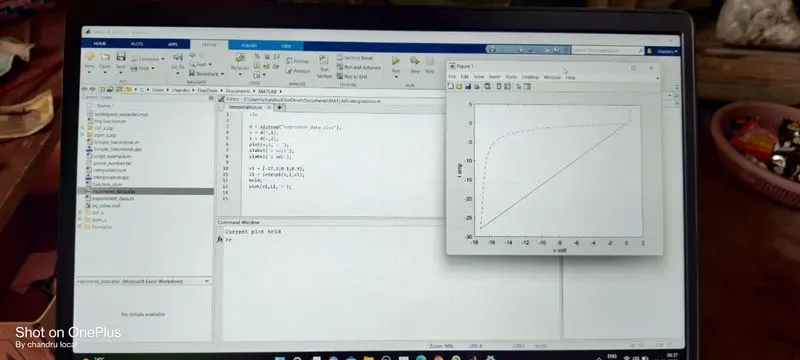
we run the command the plot will be shown on the top
clc
d= xlsread('expriment_data.xlsx');
v = d(:,1);
i = d(:,2);
plot(v,i,'--');
xlabel('v volt');
ylabel('i amp');
v1=[-17.3;0.1;0.9];
i1=interp1(v,i1,v1);
hold;
plot(v1,i1,'r');
v2=[-17.2,13,11,-9,-6,-1,0.1100,0.2500,0.5000,0.6100,0.6600
i2=interp1(v,i,v2);
plot(v2,i2);
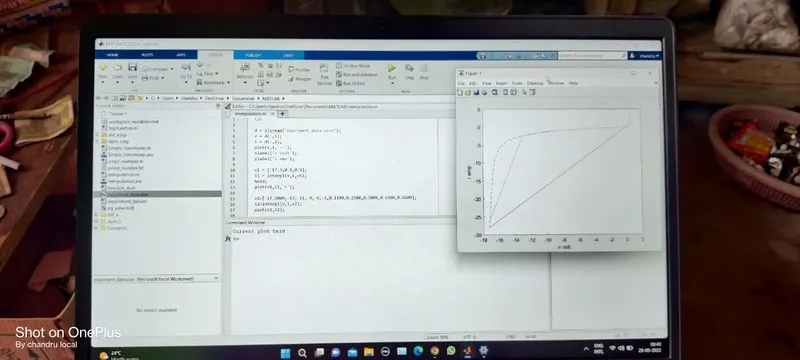
the interpolation range fron the excel sheet we plot this figure