Theory
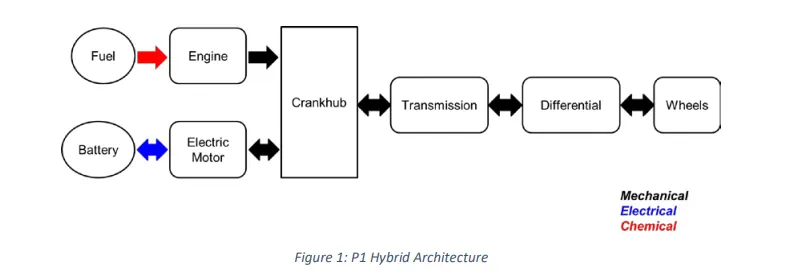
In the model a P1 hybrid vehicle is made. The P1 architecture, with the electric machine connected directly to the crankshaft, is the solution adopted by Honda on their first generation Integrated Motor Assist (IMA) technology. The electric motor functions as a generator, during vehicle deceleration, as an engine starter, and as a motor (to assist the engine) during vehicle accelerations. One of the biggest advantage of this solution is that the electric motor can provide higher torque than the BiSG, since there is no belt limitation (due to slip). However, since there is no speed / torque ratio between the electric machine and crankshaft, the torque requirements on the electric motor can be quite demanding.
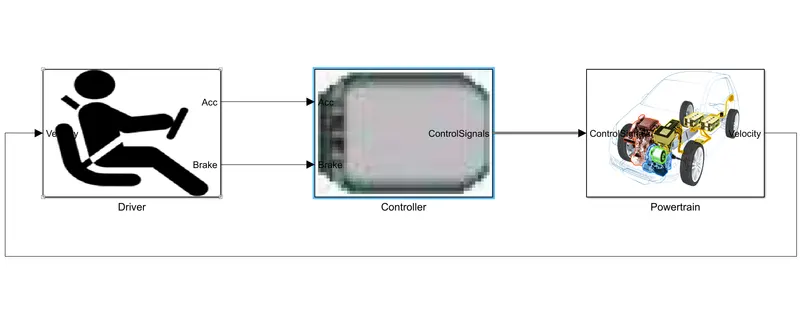
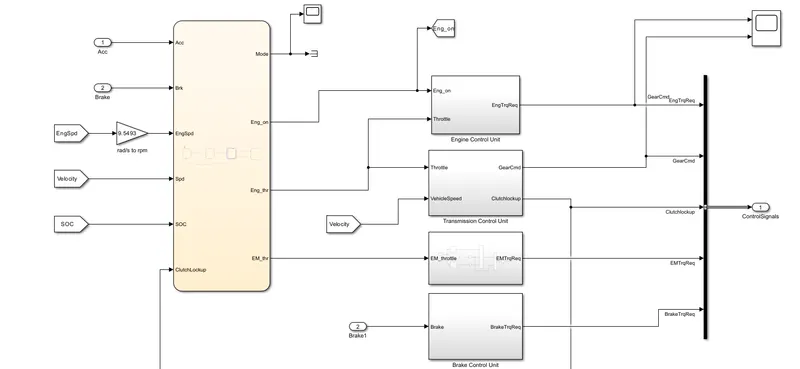
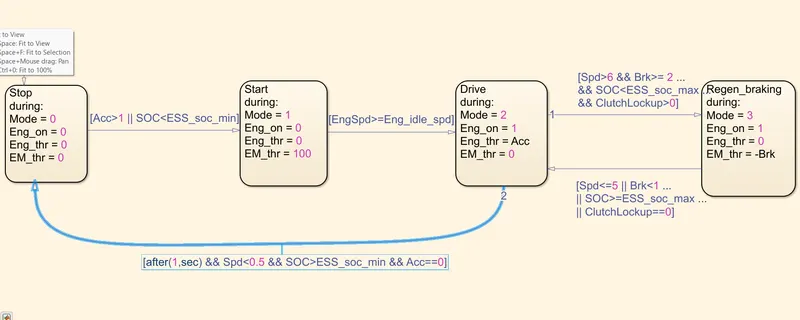
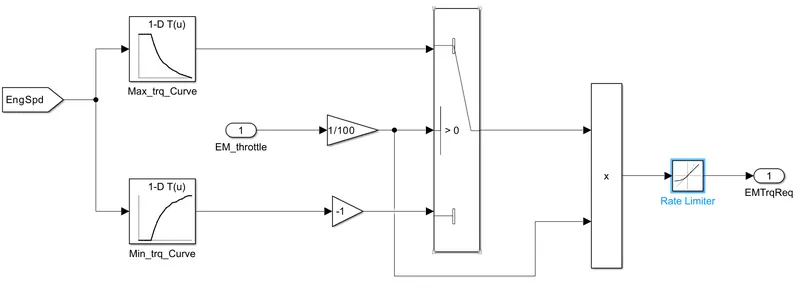
In P1 model the electric machine is connected directly with the crankshaft of the internal combustion engine. The signal from the driver is transferd to the controller as acceleration and braking. In the contoller the acceleration and brake pedal application along with other input are fed to state flow of controller and as output we get mode, engine On/Off condition, engine trottle and electrical motor throttle.
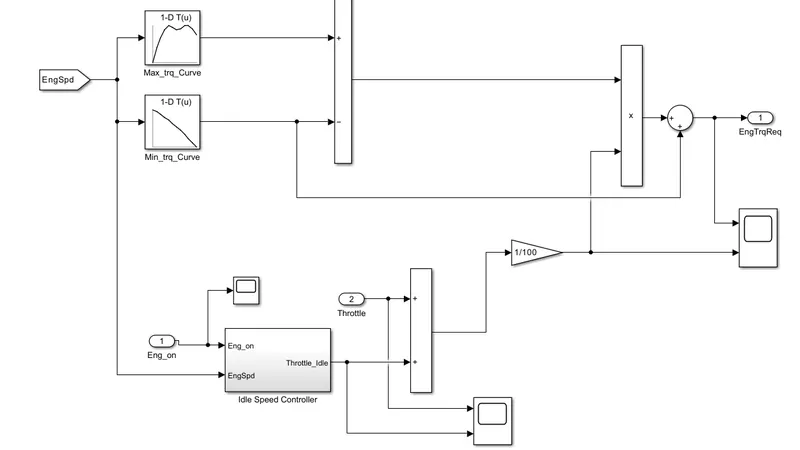
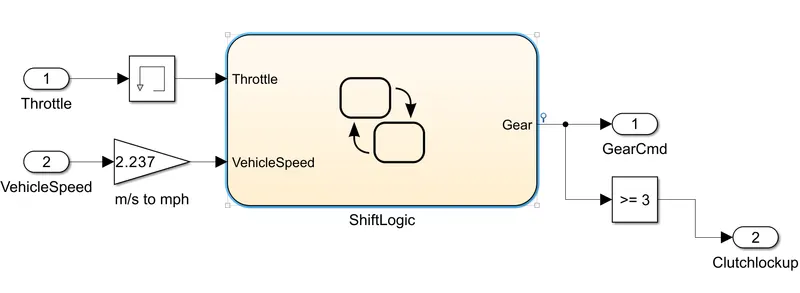
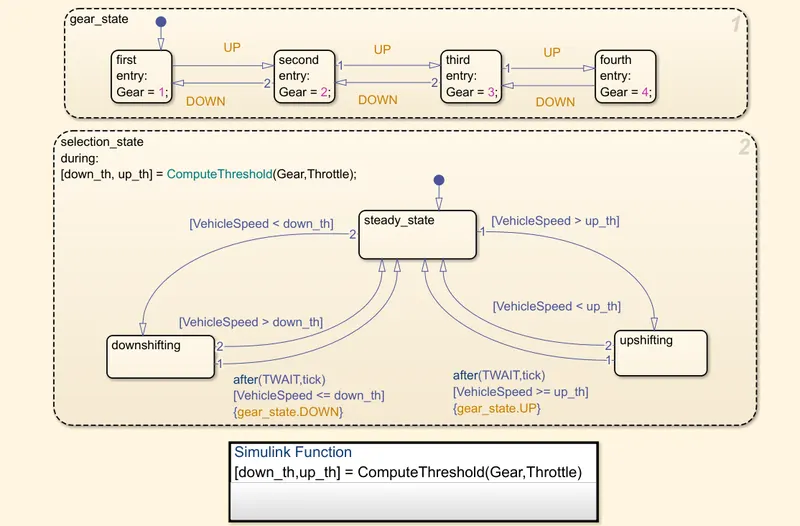
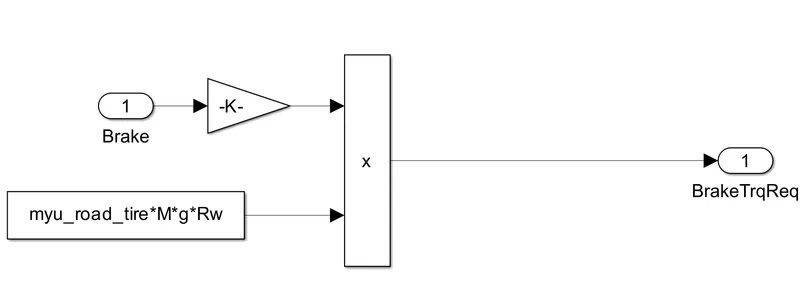
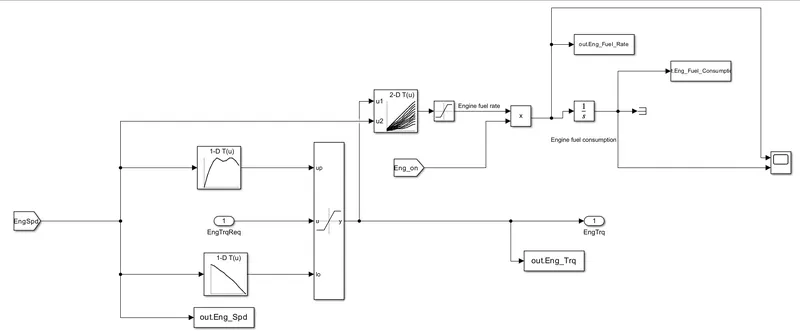
In the controller other blocks present are engine control unit, Transmission contol unit, Electric motor control unit and brake control unit. In transmission control unit a shift logic is present. From the output of the controller we get engine torque required, gear command, clutchlockup, electric motor torque required and brake toruqe required. All of these data is fed to powertrain.
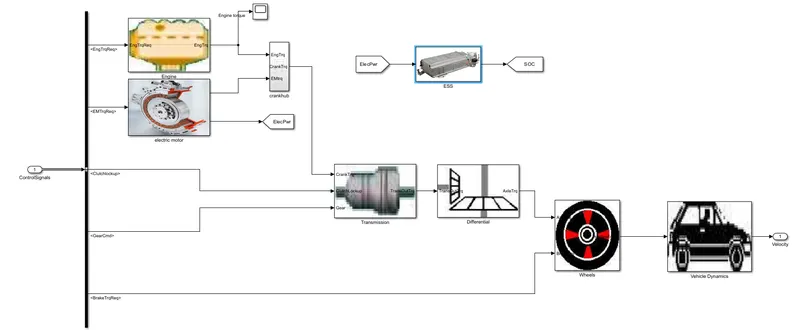
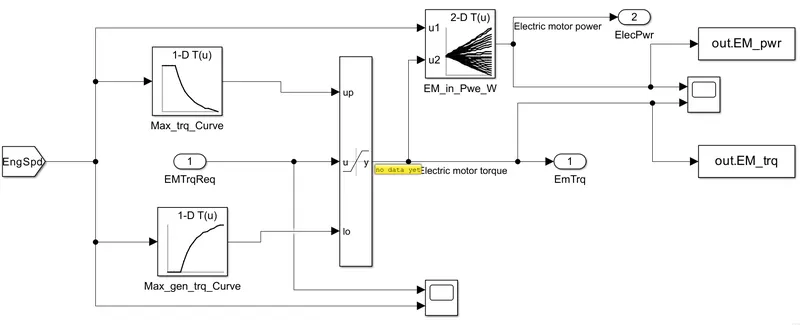
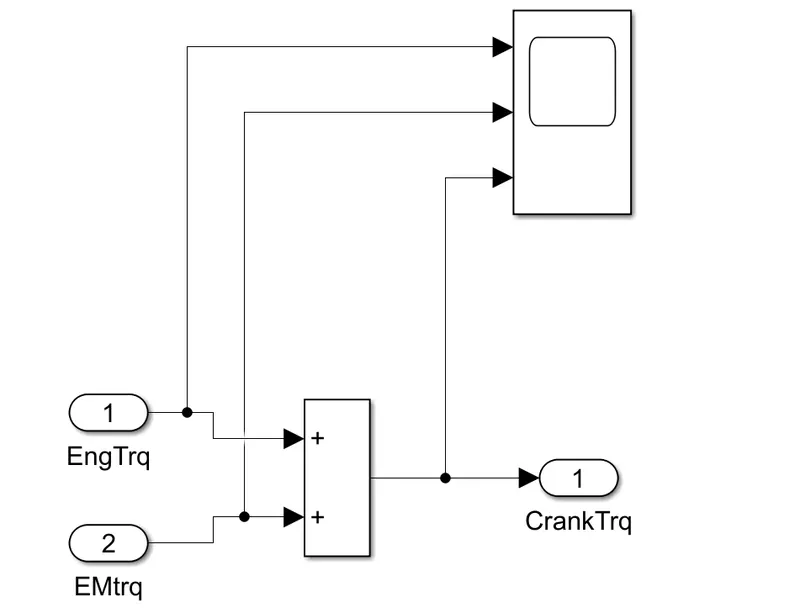
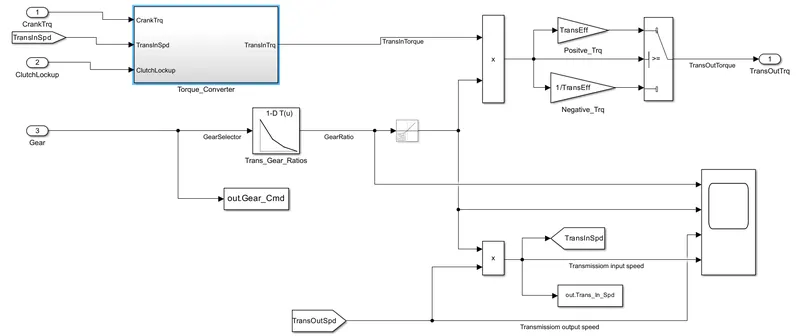
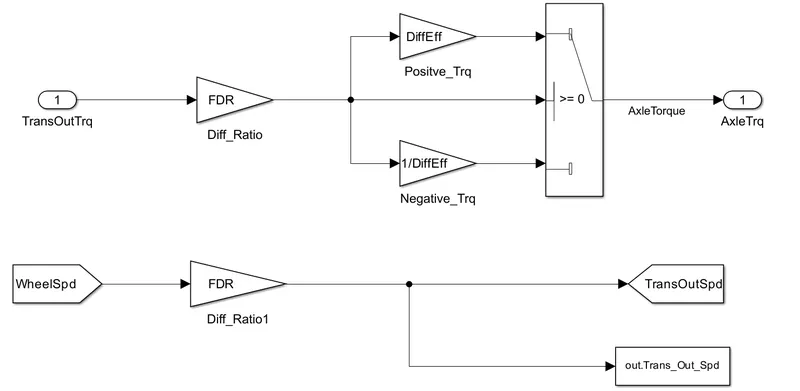
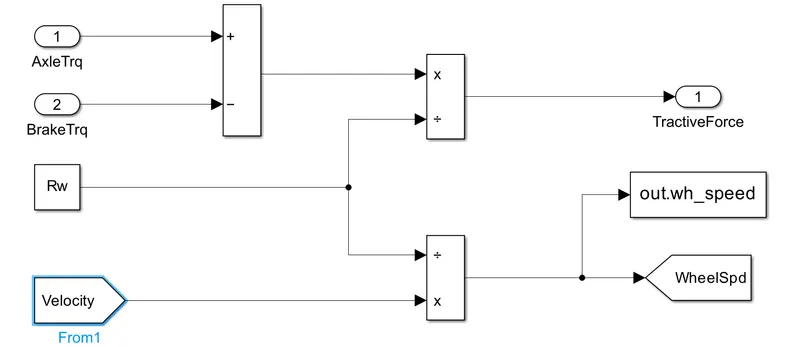
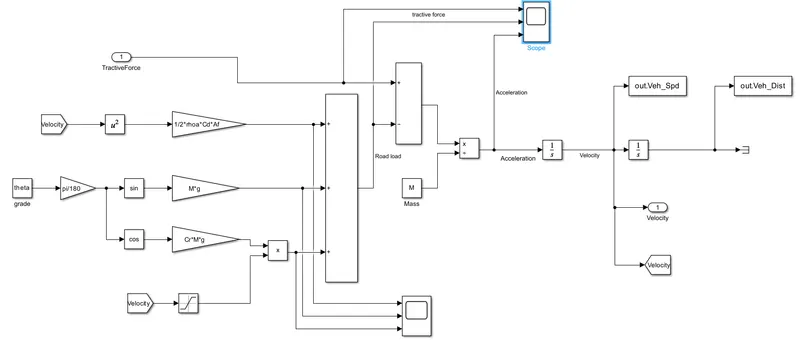
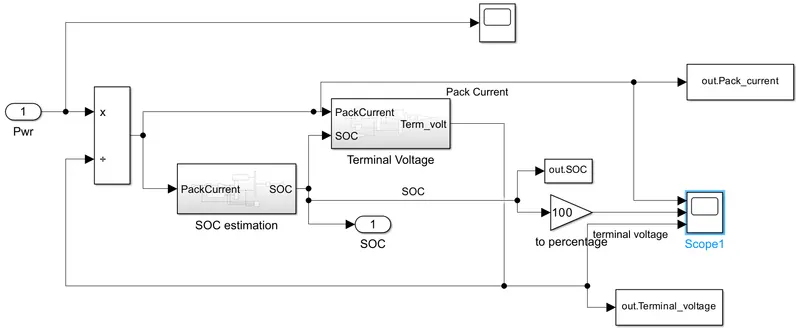
In powertrain the blocks present are engine, electric motor, crack hub to connect engine and electric motor, transmission unit, differential, wheels, vehicle dynamics and battery. The output from the engine and electric motor if fed to crankhub. It is them fed to transmision and through differential it reaches wheels and the vehicle dynamics from where we get velocity as output which is the fed as feedback to the driver. A separate battery pack is present which provides power for the electric motor to work. When braking the battery get charged by regenerative braking and since it is a P1 hybrid the electric motor rotates as a result the battery charges when rotating.
%%%%%%%%%%%%%%%%%%%%%%%%%%%%%%%%%%%%%%%%%%%%%%%%%%%%%%%%%%%%%%%%%%%%%
%% Skill-Lync -> Hybrid Drives Development
% Project 2 - Hybrid Vehicle Model
% By - Nithin P
% Description:
%% Initialization File
% Initialization file for loading the variables for the Conventional vehicle simulation model
%% Vehicle Parameters
M = 1500; % Vehicle weight [kg]
Cr = 0.015; % Rolling resistance coefficient
Rw = 0.35; % Rolling radius [m]
Cd = 0.33; % Drag coefficient
Af = 2; % Frontal area [m2]
rhoa = 1.225; % Air density [kg/m3]
Vwind = 0; % Wind velocity [kmph]
g = 9.81; % Gravitational acceleration [m/s2]
theta = 0; % Slope [deg]
myu_road_tire = 1; % Coefficient of friction between tire - road interface
%% Powertrain Parameters
FDR = 3.73; % Final Drive Ratio / Diff Ratio
DiffEff = 0.99; % Differential efficiency (assumed independent of operating conditions)
NumGear = 4; % Number of gears in transmission
TransGear = [1:NumGear]; % Transmission Gears
TransRatio = [3.06, 1.62, 1, 0.7]; % Corresponding Transmission ratios
TransEff = 0.90; % Transmission efficiency (assumed independent of operating conditions)
TC_SR = [0, .5, .6, .7, .8, .87, .92, .94, .96, .97, 1]; % Torque Converter Speed Ratio (Matlab default) -> TurbSpd/PumpSpd
TC_TR = [2.232, 1.5462, 1.4058, 1.2746, 1.1528, 1.0732, 1.0192, 1, 1, 1, 1]; % Torque Converter Torque Ratio (Matlab default) -> TurbTrq/PumpTrq
TC_Cf = 1e-4 * [.72558, .66322, .63463, .59042, .51331, .4144, .29287, .22444, .12186, .04386, 0]; % Torque Converter Capacity Factor (Matlab default) -> PumpTrq/PumpSpd^2 [Nm/rpm^2]
load Vehicle_Data/Engine_data_1_9L_Saturn_95kW
load Vehicle_Data/Trans_Shift_map
load Vehicle_Data/EM_Honda_Insight_10kW
load Vehicle_Data/ESS_NiMH6
ESS_init_soc = 0.8;
ESS_soc_max = 0.9;
ESS_soc_min = 0.6;
%% Driver Parameters
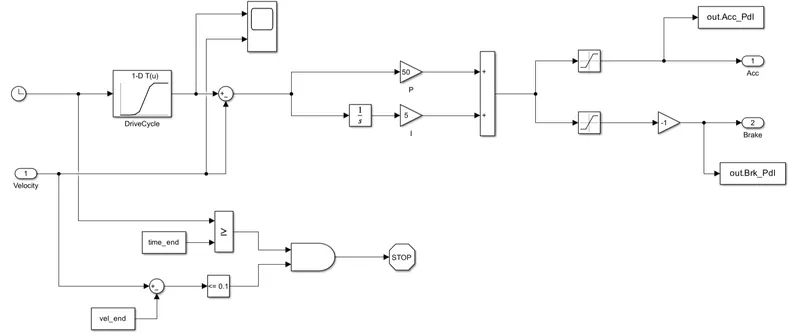
Kp = 10; % P gain for driver PI model
Ki = 1; % I gain for driver PI model
Drive_Cycle_Select = 2; % Drive cycle selection
% Drive cycle values in m/s
if Drive_Cycle_Select == 1
load DriveCycles/UDDS;
elseif Drive_Cycle_Select == 2
load DriveCycles/HWFET;
elseif Drive_Cycle_Select == 3
load DriveCycles/FTP;
elseif Drive_Cycle_Select == 4
load DriveCycles/US06;
elseif Drive_Cycle_Select == 5
load DriveCycles/NEDC;
elseif Drive_Cycle_Select == 6
load DriveCycles/WLTP;
end
time_end = cyc_time(end);
vel_end = cyc_vel(end);
Model
Driver
Controller
Mode selection
Engine control unit
Transmission control unit
Shiftlogic
Electrical motor control unit
Brake contorl unit
Powertrain
Engine
Electrical motor
Crank hub
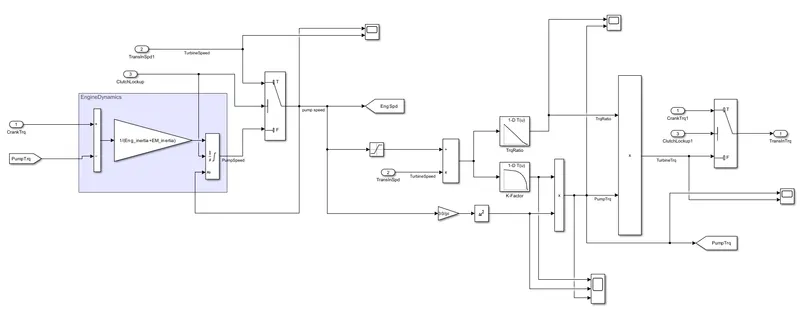
Transmission
Torque converter
Differential
Wheels
Vehicle dynamics
Battery pack
SOC estimation
Terminal voltage
Scope plot
UDDS drive cycle
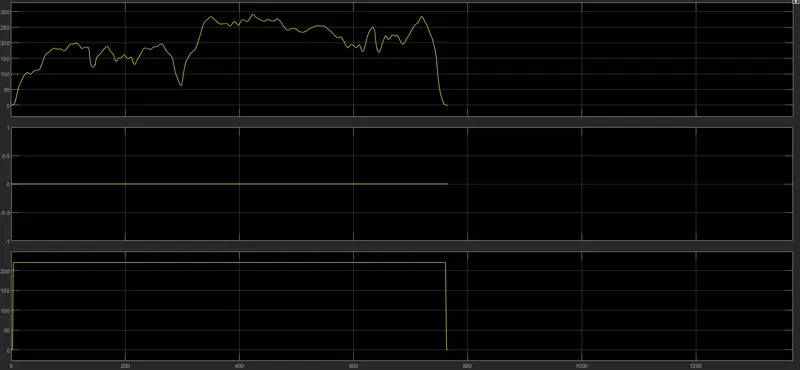
HWFET drive cycle
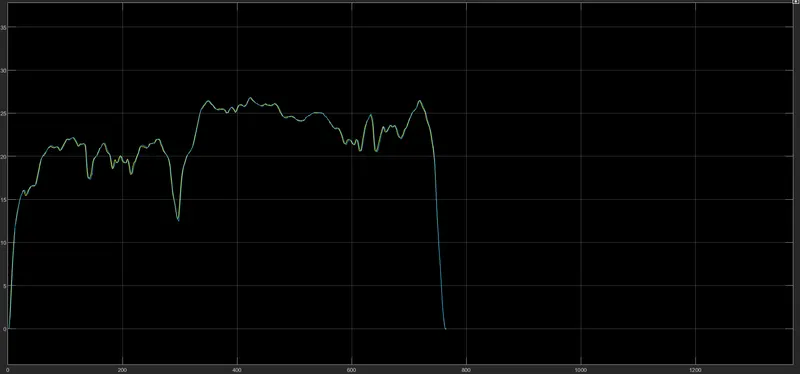
UDDS Driving mode
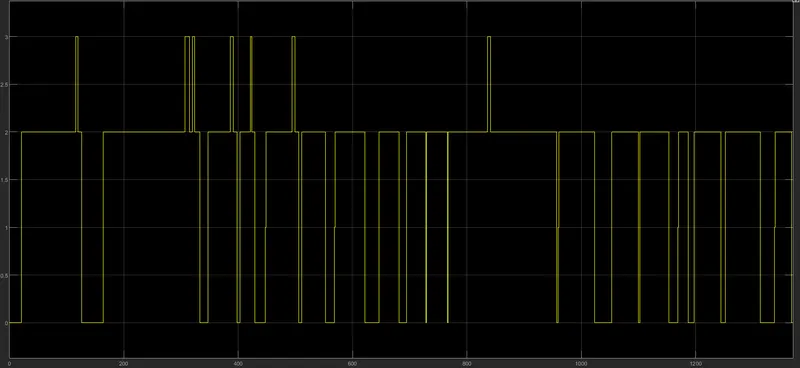
HWFET Driving mode
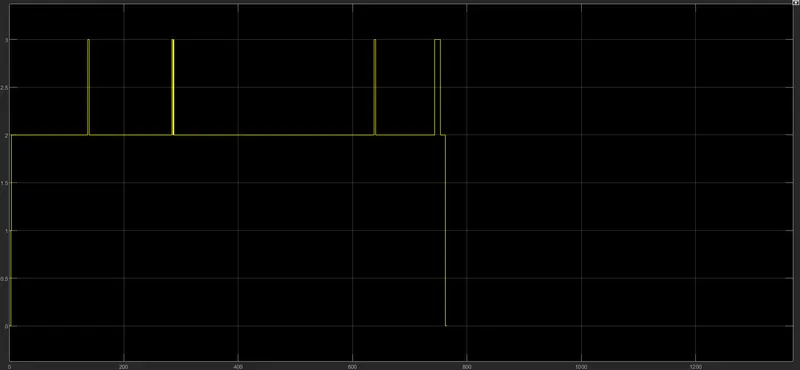
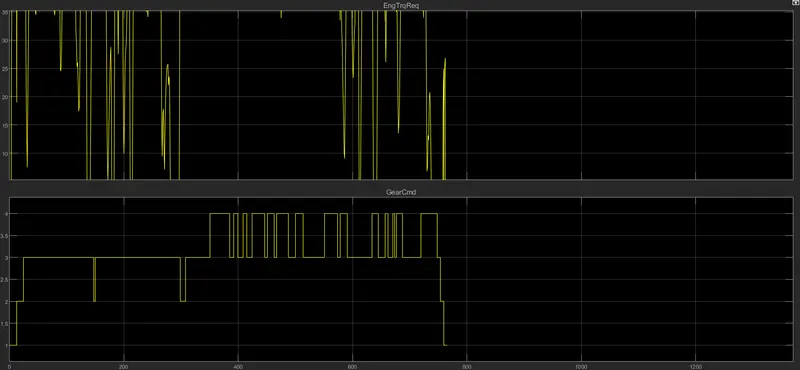
UDDS Engine torque req / gear command
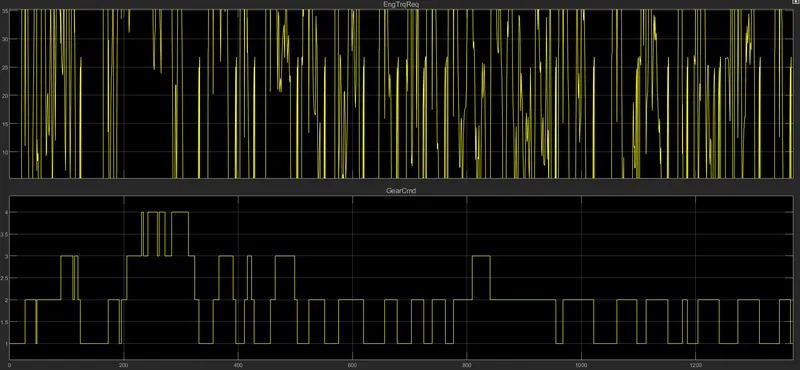
HWEFT Engine torque req / gear command
UDDS engine Fuel consumption/ Fuel rate
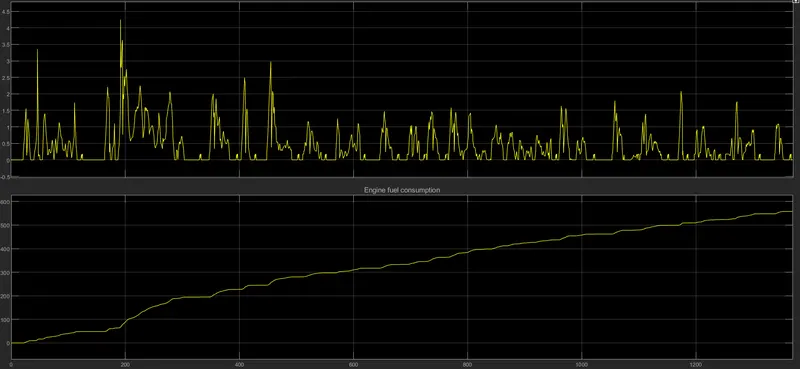
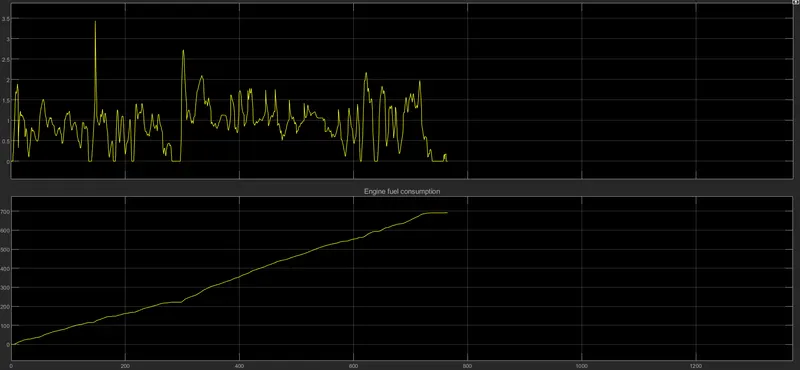
HWEFT engine Fuel consumption/ Fuel rate
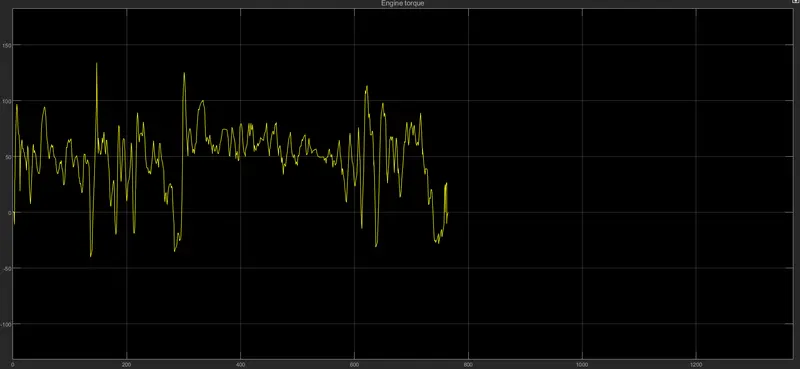
UDDS Engine torque
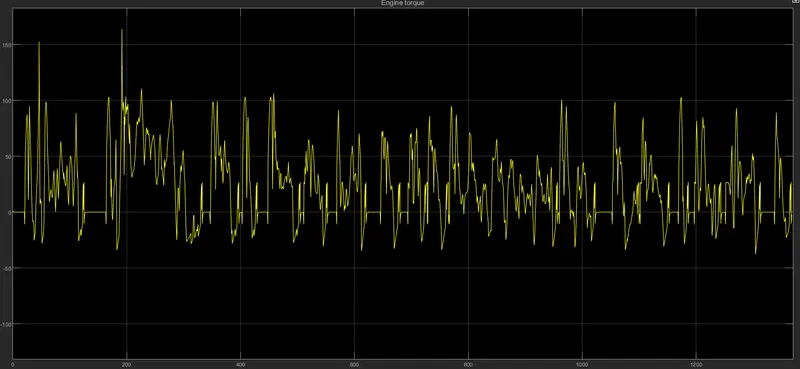
UDDS Engine torque
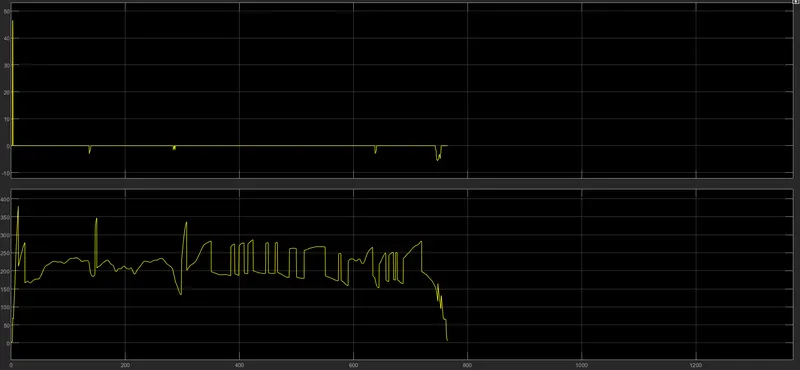
UDDS Electric motor torque required/ Engine speed
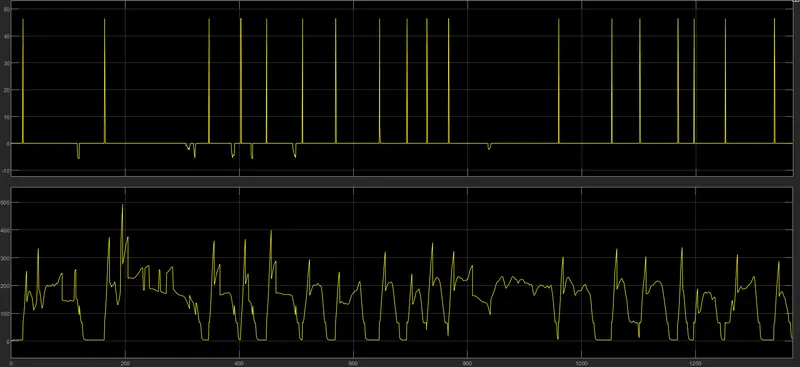
HWEFT Electric motor torque required/ Engine speed
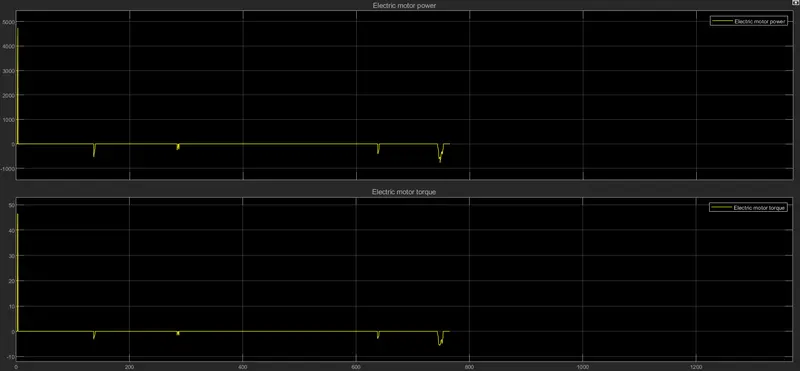
UDDS Electric motor power / torque
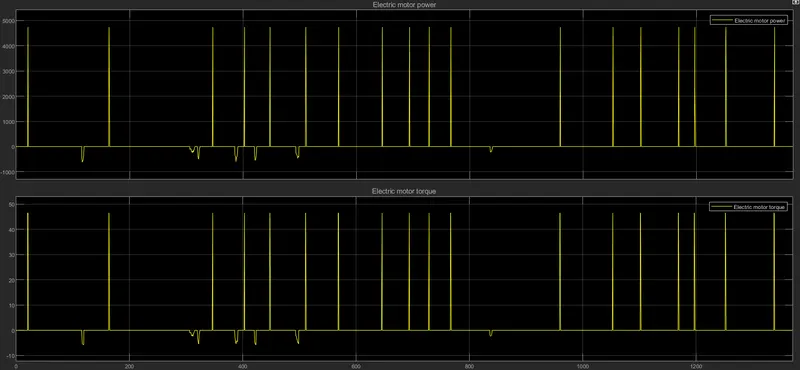
HWEFT Electric motor power / torque
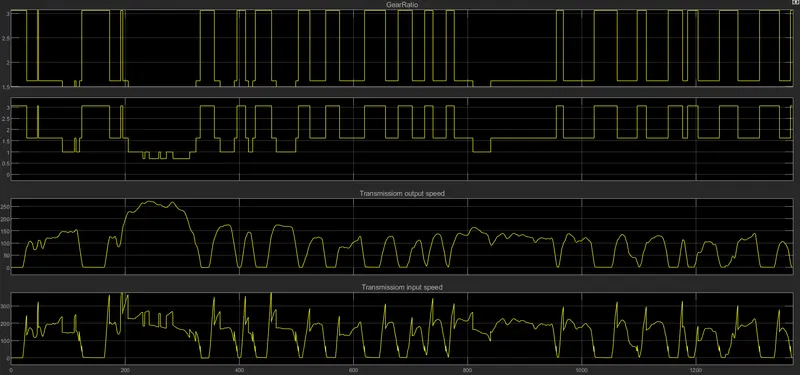
UDDS Gear ratio, Gear, Transmission output speed, Transmission input speed
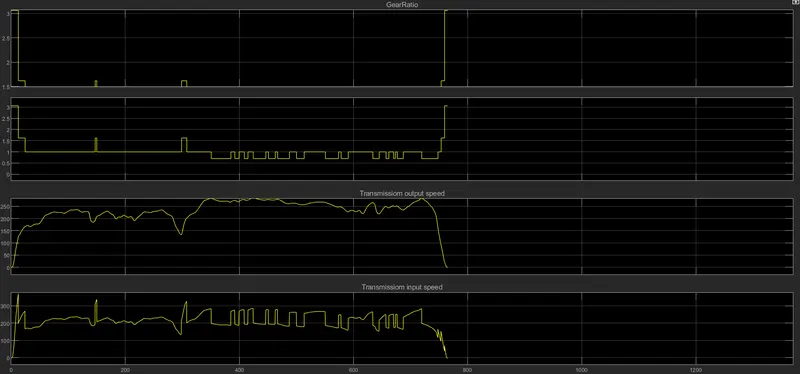
HWEFT Gear ratio, Gear, Transmission output speed, Transmission input speed
UDDS vehicle dynamics
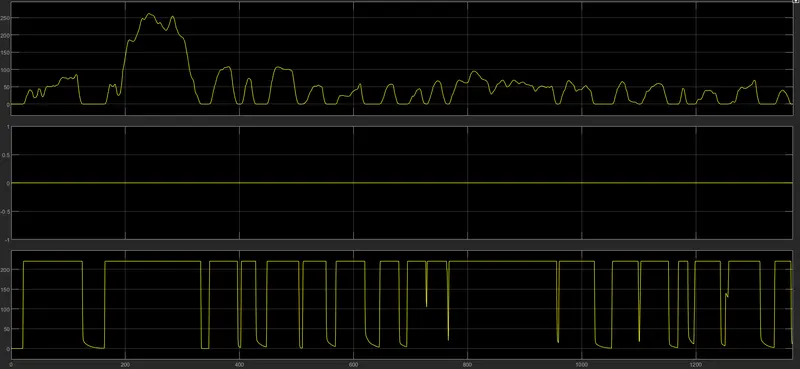
HWEFT vehicle dynamics
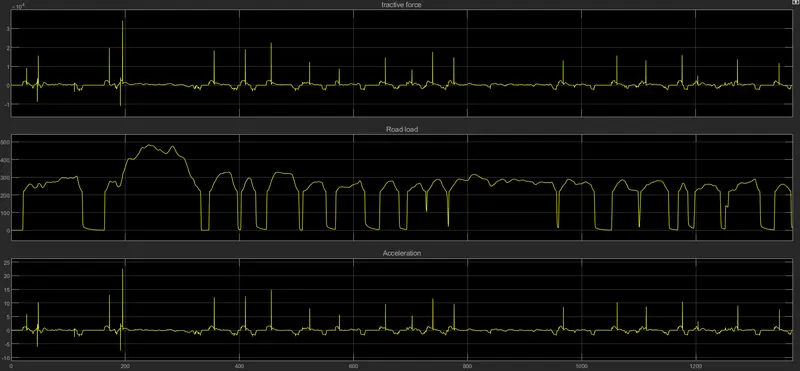
UDDS Tractive force, Road load, Acceleration
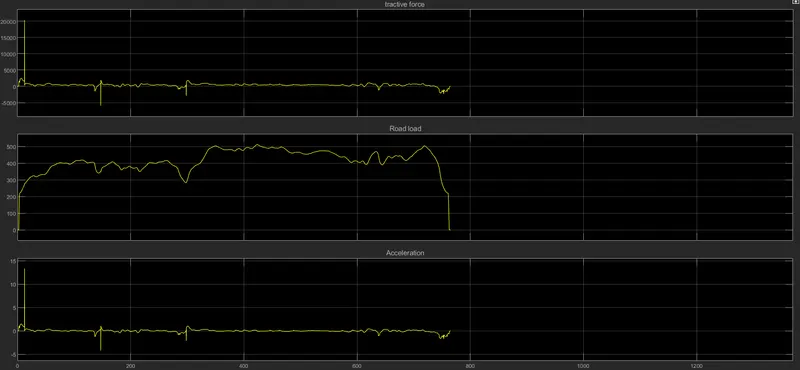
HWEFT Tractive force, Road load, Acceleration
Plot command
%%%%%%%%%%%%%%%%%%%%%%%%%%%%%%%%%%%%%%%%%%%%%%%%%%%%%%%%%%%%%%%%%%%%%
%% Skill-Lync -> Hybrid Drives Development
% Project 2 - Hybrid Vehicle Model
% By - Nithin p
% Description:
% The following file is to used with the Initialization file and Simulink
% results for post-processing of the data.
% The file is incomplete, has some examples of how the data is imported
% into a readable format, data analysis and plotting examples.
% Based on the project task, use commands in a similar format as given
% below, to analyse the data and generate required plots.
% You can change variable names if desired
%% Post-Processing File
% File for post-processing the Conventional vehicle simulation model data
%% Renaming variables
Time = out.tout;
Acc_Pdl = out.Acc_Pdl; % Accelerator pedal [%]
Brk_Pdl = out.Brk_Pdl; % Brake pedal [%]
Gear_Cmd = out.Gear_Cmd; % Transmission gear
Trans_In_Spd = out.Trans_In_Spd*30/pi; % Transmission input speed [rpm]
Trans_Out_Spd = out.Trans_Out_Spd*30/pi;% Transmission output speed [rpm]
Eng_Trq = out.Eng_Trq; % Engine brake torque [Nm]
Eng_Spd = out.Eng_Spd*30/pi; % Engine speed [rpm]
Eng_Fuel_Consump = out.Eng_Fuel_Consumption; % Engine fuel consumption [g]
Veh_Dist = out.Veh_Dist/1000; % Distance traveled by vehicle [km]
Veh_Spd = out.Veh_Spd*18/5; % Vehicle speed [kmph]
Wheel_Speed = out.wh_speed; % Wheel speed [kmph]
Eng_Fuel_Rate = out.Eng_Fuel_Rate; % Engine fuel rate [%]
EM_trq = out.EM_trq; % Electric motor torque
EM_pwr = out.EM_pwr; % Electric motor power
Terminal_voltage = out.Terminal_voltage; % Battery voltage
Current = out.Pack_current; % Battery current
SOC = out.SOC; % battery SOC
%% Data Analysis
Eng_Pwr = Eng_Spd.*pi/30.*Eng_Trq/1000; % Engine brake power [kW]
rho_petrol = 0.7197; % Density of petrol [kg/L]
kmpl = Veh_Dist(end)/(Eng_Fuel_Consump(end)/1000/rho_petrol); % Fuel economy [kmpl]
%% Plotting vehicle characteristics time trace
figure(1)
subplot(3,1,1)
hold on
grid on
plot(Time, Acc_Pdl, 'linewidth', 1, 'Color', 'black');
plot(Time, Brk_Pdl, 'linewidth', 1, 'Color', 'red');
ylabel('Pedal [%]')
xlim([0, Time(end)]);
legend('Accel','Brake');
subplot(3,1,2)
hold on
grid on
plot(Time, Trans_In_Spd, 'linewidth', 1, 'Color', 'black');
plot(Time, Trans_Out_Spd, 'linewidth', 1, 'Color', 'red');
ylabel('Speed [rpm]')
xlim([0, Time(end)]);
ylim([0, 6000]);
legend('Trans Input','Trans Output');
subplot(3,1,3)
hold on
grid on
plot(Time, Gear_Cmd, 'linewidth', 1, 'Color', 'black');
xlim([0, Time(end)]);
xlabel('Time [s]');
ylabel('Gear');
%% Plotting vehicle characteristics time trace transmission IN/OUT and Wheel Speed
figure(2 )
hold on
grid on
plot(Time, Trans_In_Spd, 'linewidth', 1, 'Color', 'black');
plot(Time, Trans_Out_Spd, 'linewidth', 1, 'Color', 'red');
plot(Time, Wheel_Speed, 'linewidth',1, 'color', 'blue')
ylabel('Speed [rpm]')
xlabel('Timem [s]')
xlim([0, Time(end)]);
ylim([0, 6000]);
legend('Trans Input','Trans Output','Wheel Speed');
%% Plotting Engine speed, Engine Torque, Engine Power,Engine fuel rate,Engine fuel consumption wrt Time
figure(3)
subplot(2,2,1)
plot(Time,Eng_Trq,'linewidth',1,'color','black')
xlabel('Time [s]')
ylabel('Torque [Nm]')
legend('Engine Torque')
grid on
subplot(2,2,2)
plot(Time,Eng_Pwr,'linewidth',1,'color','blue')
xlabel('Time [s]')
ylabel('Power [KW]')
legend('Engine Power')
grid on
subplot(2,2,3)
plot(Time,Eng_Fuel_Rate,'linewidth',1,'color','red')
xlabel('Time [s]')
ylabel('Fuel Rate [%]')
legend('Engine Fuel Rate')
grid on
subplot(2,2,4)
plot(Time,Eng_Fuel_Consump,'linewidth',1,'color','green')
xlabel('Time [s]')
ylabel('Fuel Consumption')
legend('Engine Fuel Consumption')
grid on
%% Potting Accelerator pedal, Brake pedal and gear command with respect to time
figure(4)
subplot(2,1,1)
hold on
plot(Time, Acc_Pdl, 'linewidth', 1, 'Color', 'black');
plot(Time, Brk_Pdl, 'linewidth', 1, 'Color', 'red');
ylabel('Pedal [%]')
xlabel('Time [s]');
xlim([0, Time(end)]);
grid on
legend('Accel','Brake');
title('Acceleration & Brake Pedal wrt Time')
subplot(2,1,2)
plot(Time, Gear_Cmd, 'linewidth', 1, 'Color', 'black');
xlim([0, Time(end)]);
xlabel('Time [s]');
ylabel('Gear');
grid on
title('Gear command wrt Time')
%% Plotting fuel economy Vs Engine Fuel consumption
figure(5)
plot(Eng_Fuel_Consump,Eng_Fuel_Rate,'color','r')
xlabel('Fuel consumption')
ylabel('Fuel Rate [%]')
title('Fuel economy Vs Fuel Consumption')
grid on
%% Plotting engine operating points on engine fuel map
figure('Name','Engine Operating Points');
hold on
grid on
title('Engine Operating Points','fontsize',12);
p1=plot(Eng_map_spd*30/pi,Eng_max_trq,'linewidth',2,'color','r');
p2=line([Eng_map_spd(end)*30/pi Eng_map_spd(end)*30/pi],[0 Eng_max_trq(end)]);
set(p2,'linewidth',1,'linestyle','--','color','k');
p3=line([Eng_map_spd(1)*30/pi Eng_map_spd(1)*30/pi],[0 Eng_max_trq(1)]);
set(p3,'linewidth',1,'linestyle','--','color','k');
[c,h] = contour(Eng_map_spd'*30/pi,Eng_map_trq,Eng_fuel_map');
clabel(c,h);
xlabel('Engine Speed [rpm]');
ylabel('Engine Torque [Nm]');
title('Engine Fuel Consumption Map [g/s]');
legend([p1 p3],{'Max Curve','Operating Points'});
axis([Eng_map_spd(1)*30/pi Eng_map_spd(end)*30/pi 0 Eng_map_trq(end)]);
%% Ploting Electric motor power and torque
figure(7)
subplot(2,1,1)
plot(Time,EM_trq,'c');
grid on
xlabel('time');ylabel('Electric motor torque');
subplot(2,1,2)
plot(Time,EM_pwr,'m');
grid on
xlabel('time');ylabel('Electric motor power');
%% Ploting battery voltage current soc
figure(8)
subplot(3,1,1)
plot(Time,Terminal_voltage,'b');
grid; xlabel('time');ylabel('terminal voltage');
subplot(3,1,2)
plot(Time,Current,'c');
grid; xlabel('time');ylabel('Battery current');
subplot(3,1,3)
plot(Time,SOC,'g');
grid; xlabel('time');ylabel('Battery SOC');
RESULTS
Plotting vehicle characteristics time trace
UDDS
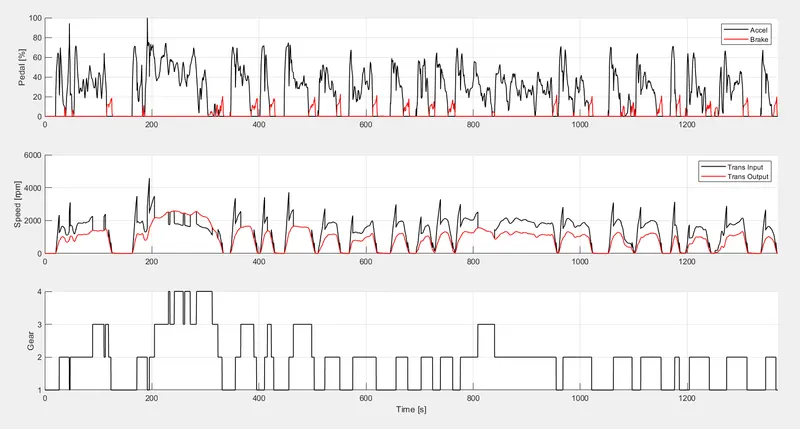
HWEFT
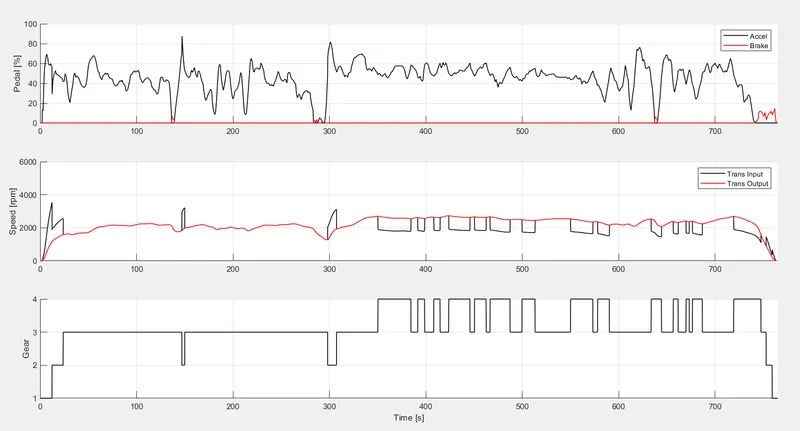
In the plot above its seen that in UDDS the break was used continuously compared to HWEFT When comparing the transmission output and input in UDDS the flactuating is more than in HWEFT In UDDS the vehicle runs most of the time in lower gears but in HWEFT Vehicle runs in higher gears only
Plotting vehicle characteristics time trace transmission IN/OUT and Wheel Speed
UDDS
HWEFT
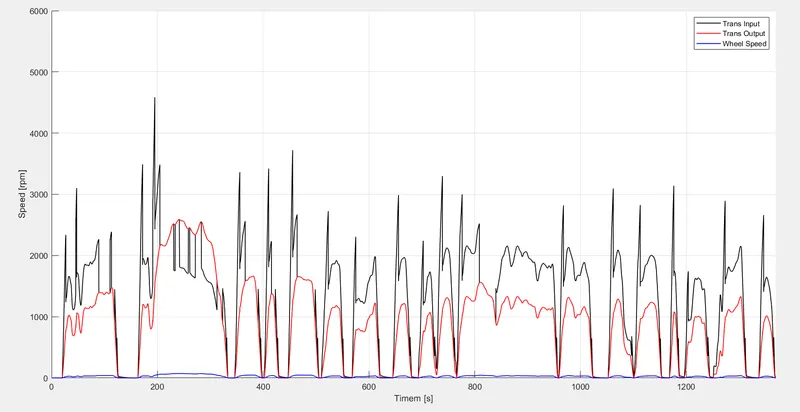
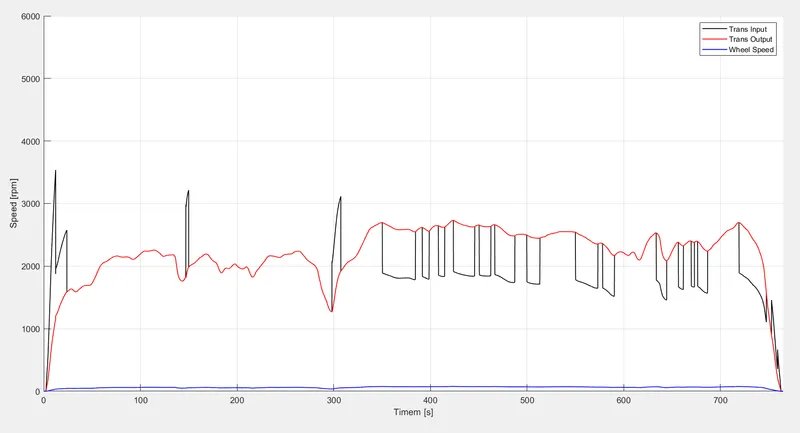
Transmission input and output flactuates more in UDDS than in HWEFT
Plotting Engine speed, Engine Torque, Engine Power,Engine fuel rate,Engine fuel consumption wrt Time
UDDS
HWEFT
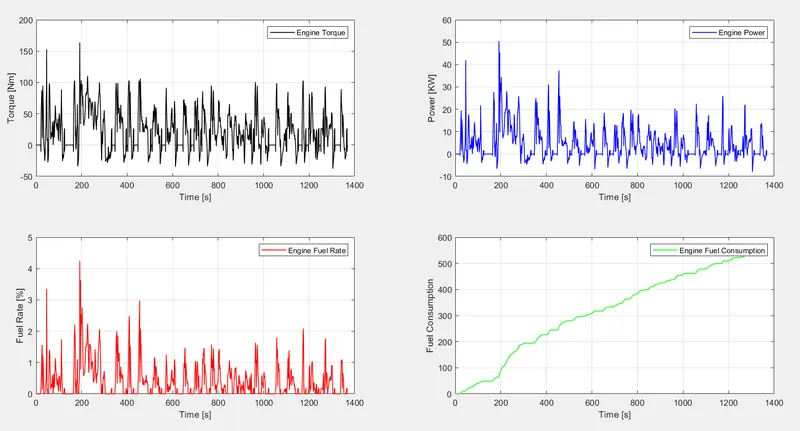
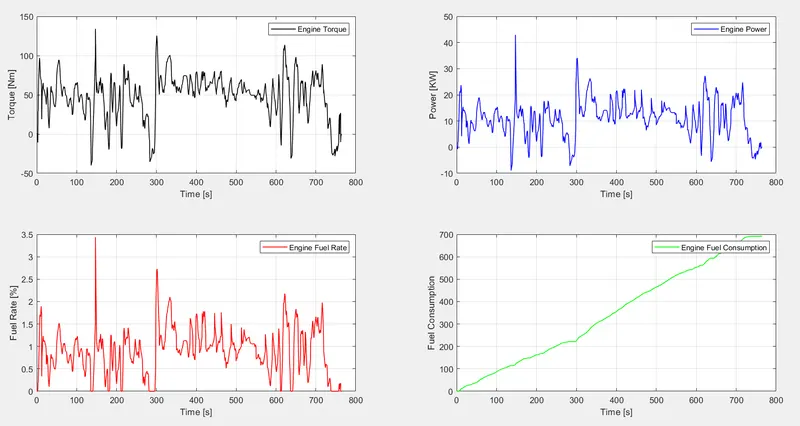
In UDDS the power and torque is more and there is more fuel consumption but in HWEFT the power at the start is more and shows somewhat static behaviour. Fuel consumption is more in UDDS than HWEFT
Potting Accelerator pedal, Brake pedal and gear command with respect to time
UDDS
HWEFT
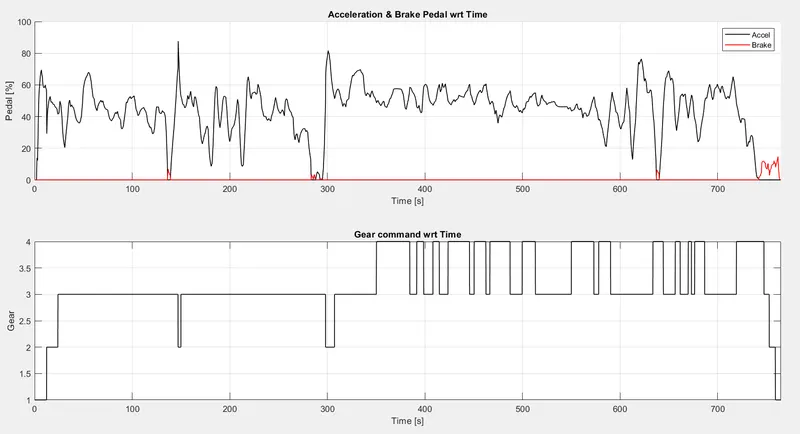
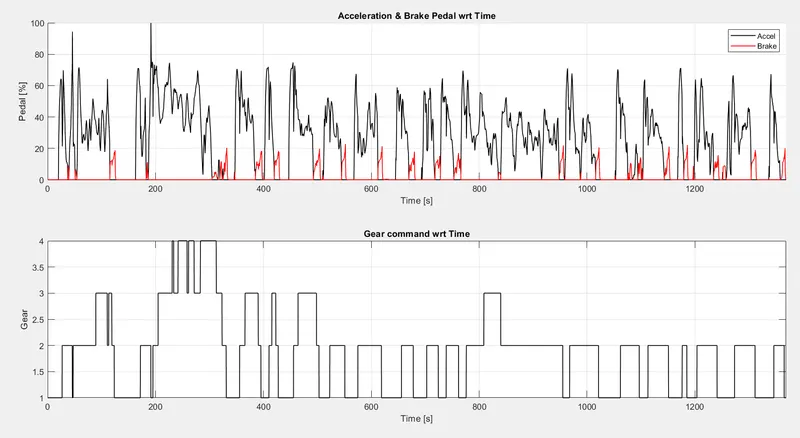
Frequent acceleration and brake in UDDS causes the continuous usage of acceleration pedal and brake pedal. But in HWEFT the break pedal is used very less and a less flactuating acceleration curve can be observed.
Use of brakes is less in HWEFT and there is a regular braking pattern in UDDS and the acceleration is more flactuating in UDDS.
In HWEFT the vehicle runs at higher gear ( 3rd and 4th ) and downshit to lower gears occurs only at end when vehicle stops. In UDDS the gear is continuously changed and most of the time vehicle runs at lower gear ( 1st and 2nd )
Plotting fuel economy Vs Engine Fuel consumption
UDDS
HWEFT
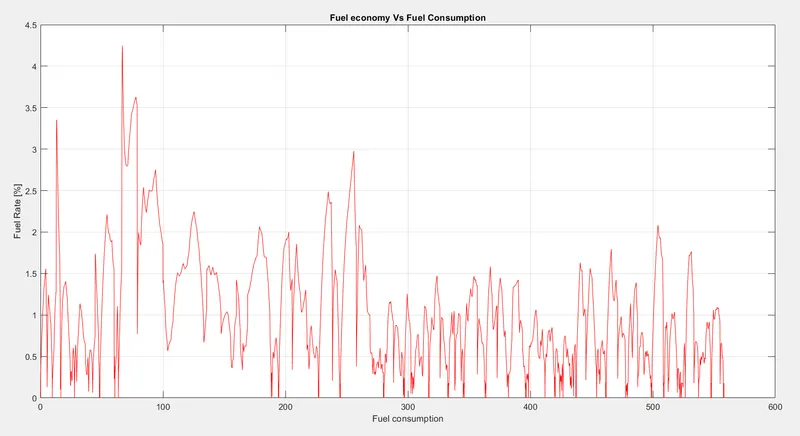
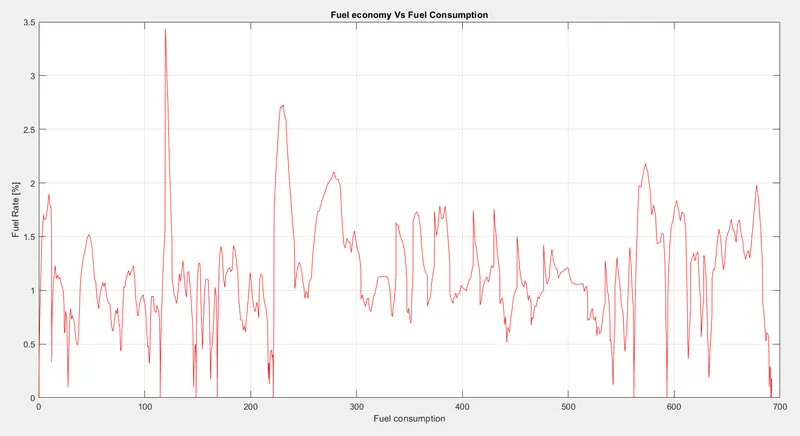
Fuel consumption flactuats more in UDDS than in HWEFT but HWEFT consumes more fuel than UDDS as in HWEFT the engine runs continuously. also there is a high fuel economy in HWEFT because of less braking more output can be obtained.
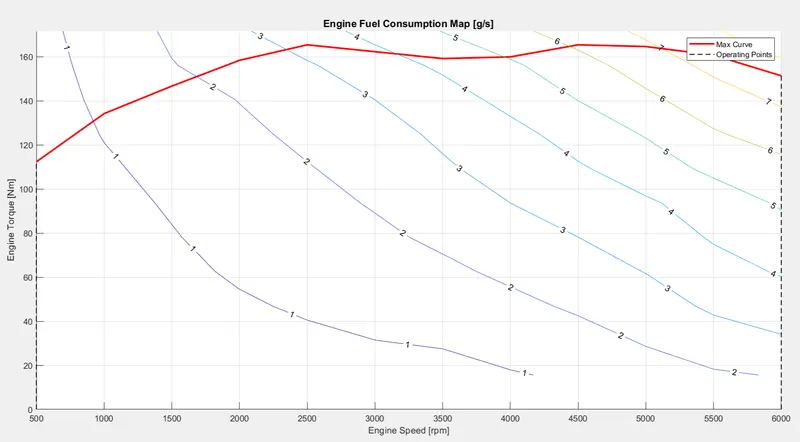
Plotting engine operating points on engine fuel map
UDDS
HWEFT
Ploting Electric motor power and torque
UDDS
HWEFT
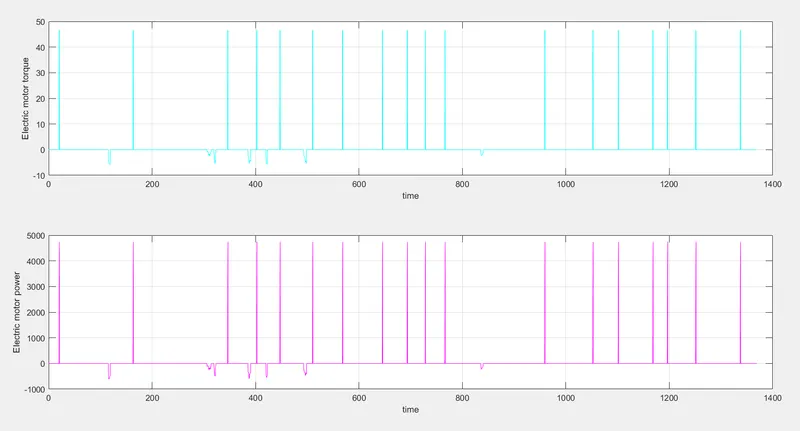
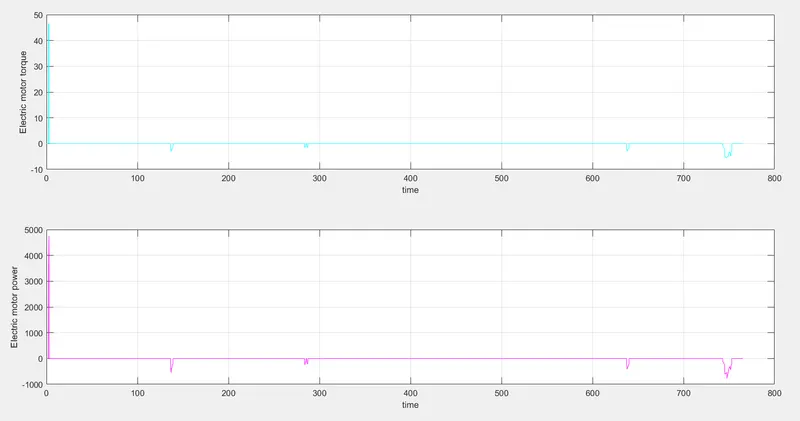
In UDDS the electric motor is used ofet compared to HWEFT. UDDS has a changing motor torque and power but in HWEFT the motor power and torque is zero most of the time
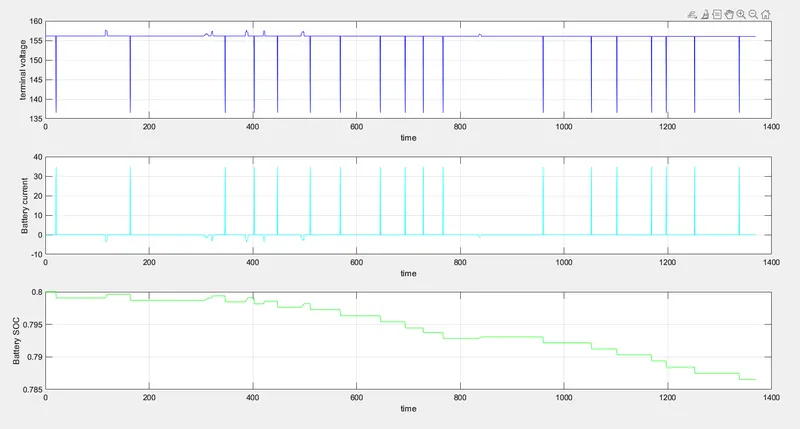
Ploting battery voltage current soc
UDDS
HWEFT
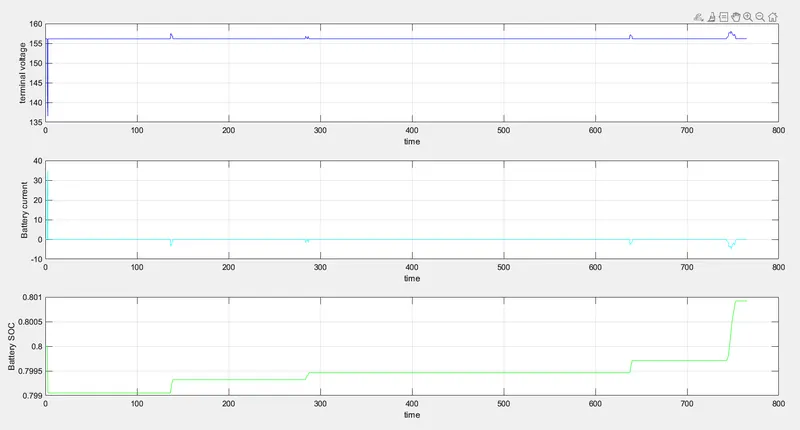
In UDDS the current and voltage varies often and the soc is reduced and on the other hand in case of HWEFT the current is constant most of the time and voltage is zero .in case of SOC in HWEFT the soc is increased .