Project 2
Electric vehicles (EVs) are quickly becoming a realistic transportation option of the future as a means to minimise our reliance on oil and other high-carbon-discharge transportation fuels. In this analysis, we discussed the numerous components of a BEV model run in MATLAB-Simulink. Moreover, the equations required for confirming the electrical system's components were located. What's more, each and every simulated consequence was carefully considered. This research provides a foundation for further exploration.
INTRODUCTION:
One of the most urgent issues facing the planet today is improving energy efficiency. Our global energy system faces a number of obstacles. Nobody can say for sure what the future of energy will be like, but we know that transportation will be vital to protecting it.
To wit, the widespread availability of electric vehicles is a direct result of technological progress that has helped and is helping to make our lives easier and safer (EVs). Considering that EVs not only consume but also produce, store, and transfer energy, it is clear that EVs have a significant impact on the energy grid. This makes them a practical replacement for fossil fuels in automobiles. They are more economical than gasoline or diesel-powered vehicles and less hazardous to the environment because of their reversible energy storage technology.
By using MATLAB-Simulink, we can model the BEV's construction and assembly process from start to finish. In addition, the tool may simulate the BEV model and associated equations. We will investigate the BEV's electrical system components, run a simulation of the system, and validate the system's equation with the help of MATLAB. The results of every simulation run are examined, too. There are many parts that make up a BEV, including the chassis, gearbox, electric motor, battery charge controller, driving cycle, driver model, and longitudinal vehicle.
Simulation in MATLAB:
In order to foresee how a system or product will function, this tool is crucial. Engineers and scientists all over the world rely on MATLAB, a simulation programme. It provides an abundance of resources and pre-built models for usage in a wide range of engineering and scientific disciplines. In this application, the simulation model of the vehicle and motor is being developed using a very basic library of MATLAB called "Simulink." If you do this, you'll have an easier time grasping the concepts behind the electric vehicle simulation.
Question: Design and Develop a simulink model to understand Energy analysis of EVs on different driving cycles.
Why Electric Vehicles?
Electrical current drives an electric car. Battery electric vehicles (BEVs), plug-in hybrids, and fuel cell electric vehicles are all part of this category. Electricity from the battery powers an electric motor, which in turn rotates the wheels and propels the vehicle forward; thus, there are no exhaust emissions.
Efficiency is a fundamental driver of cleaning up the transportation sector, just as it has brought down emissions in the power sector. In comparison to internal combustion engines, electric motors greatly improve fuel economy (ICEs). Compared to a gas combustion engine, which converts less than 40% of the fuel it receives into mechanical energy, electric motors are over twice as efficient. In addition to heat losses in the drivetrain (the set of parts that transfers power from an electric motor or combustion engine to the wheels), these efficiencies drop even further. The Department of Energy (DOE) estimates that between 59 and 62% of the energy input into an EV is converted into wheel rotation, while only about 17 to 21% of the energy input into a gasoline combustion vehicle is converted into wheel rotation. Because of this, electric vehicles are far more efficient than internal combustion engine vehicles.
BLOCK DIAGRAM OF EV MODEL:
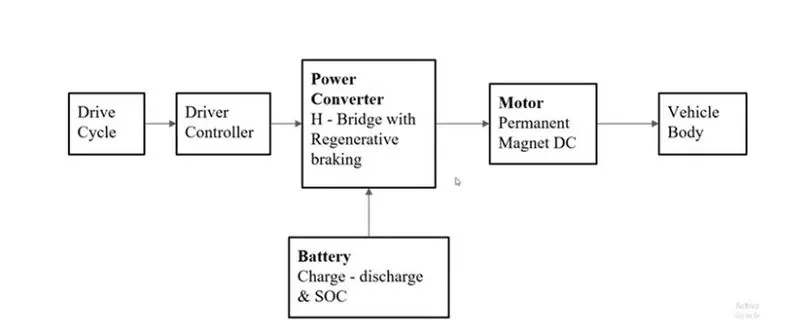
Fig. Electric vehicle architecture
Types of Vehicles:
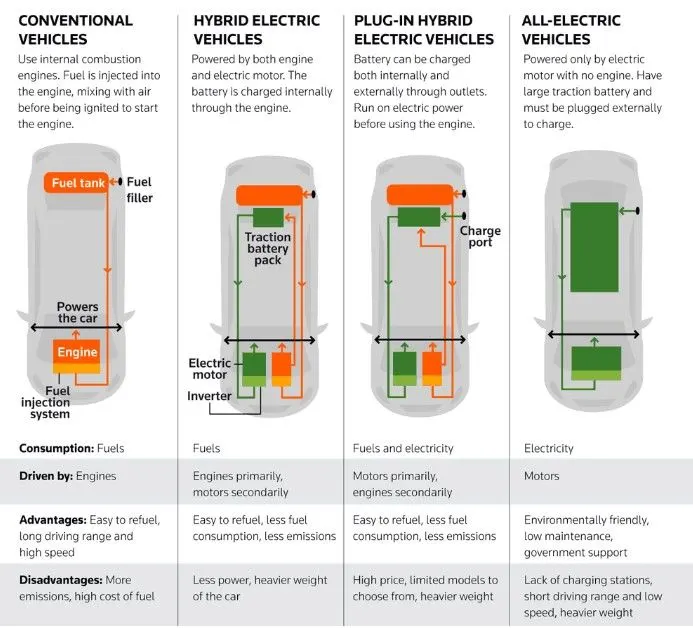
>>System Level Configurations:
The Vehicle Model Mainly consists of :
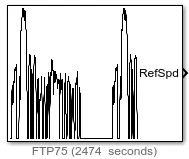
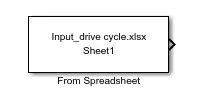
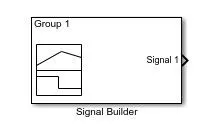
1) Drive Cycle Source:
2) Motor and Controller:
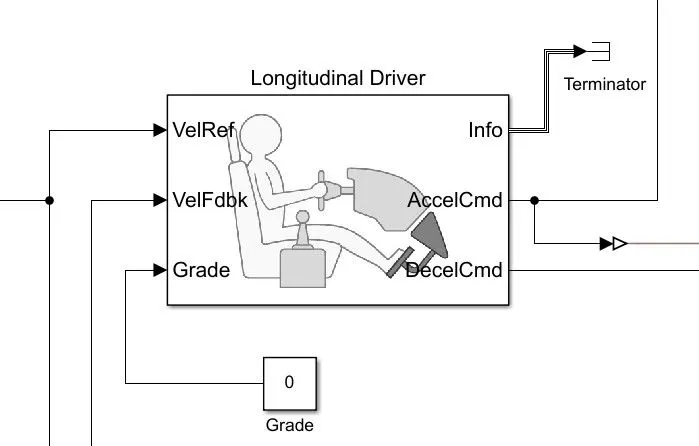
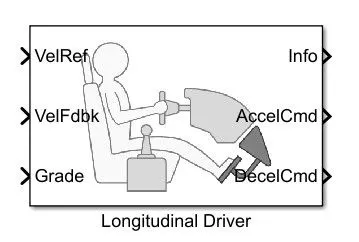
3) Battery Pack and Power Converter:
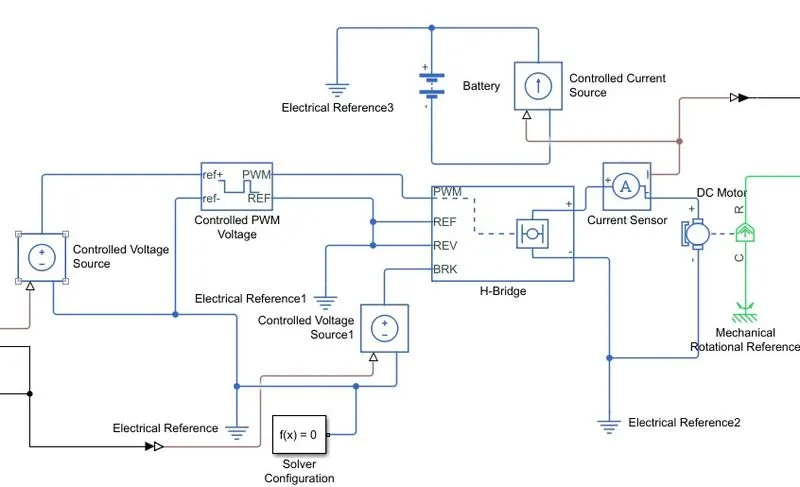
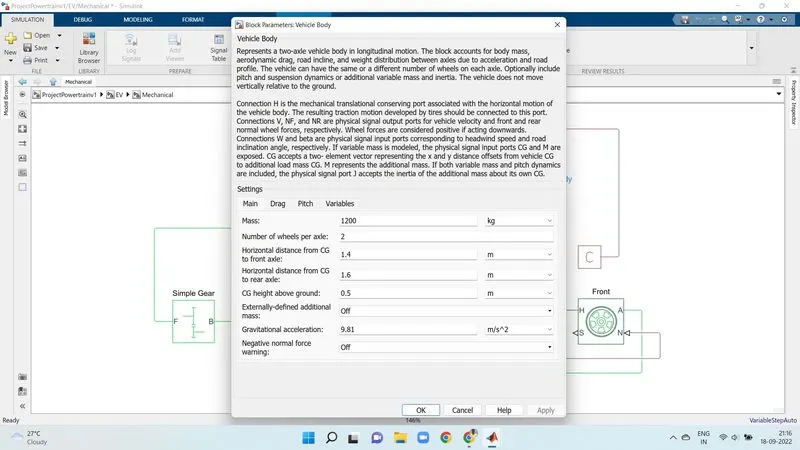
4) Vehicle Block
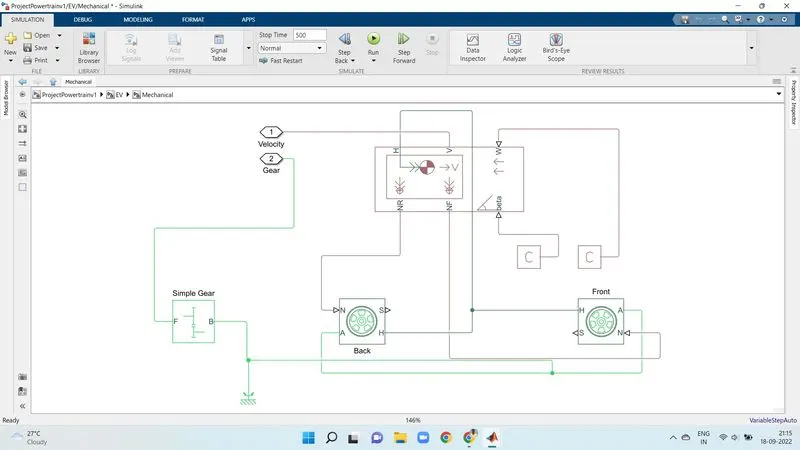
Vehicle Block Parameters:
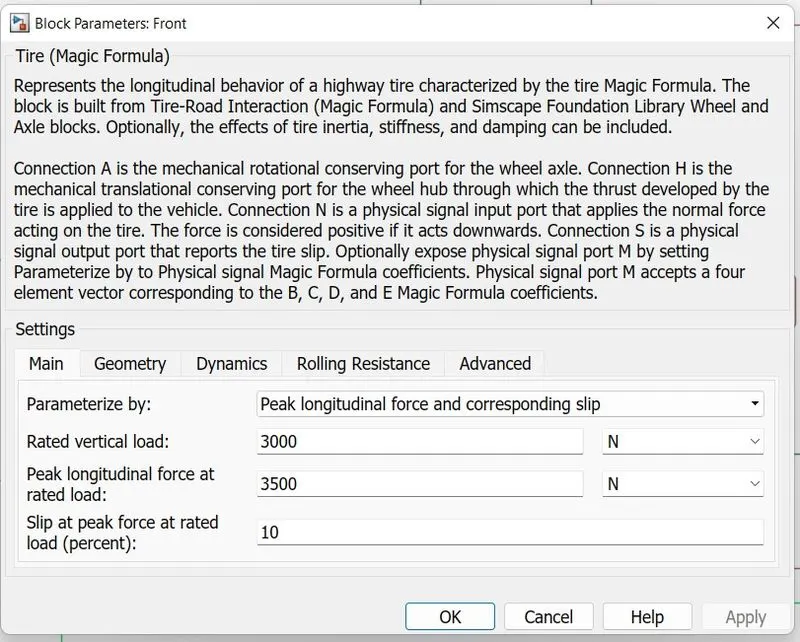
Fornt Wheel:
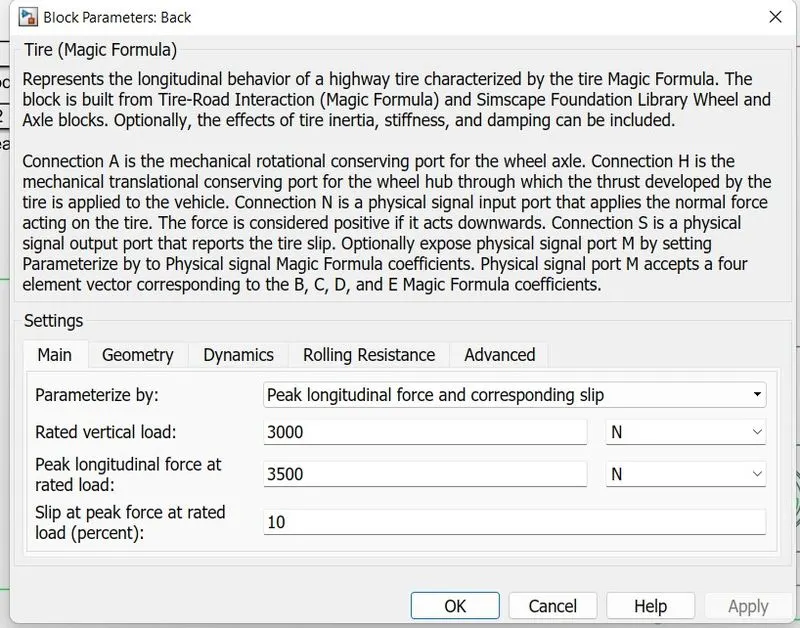
Back Wheel:
Detailed Model:
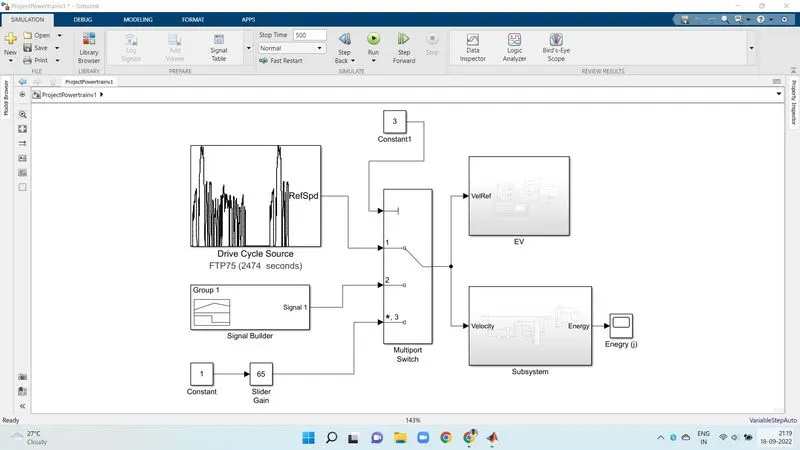
DC Motor Parameters:
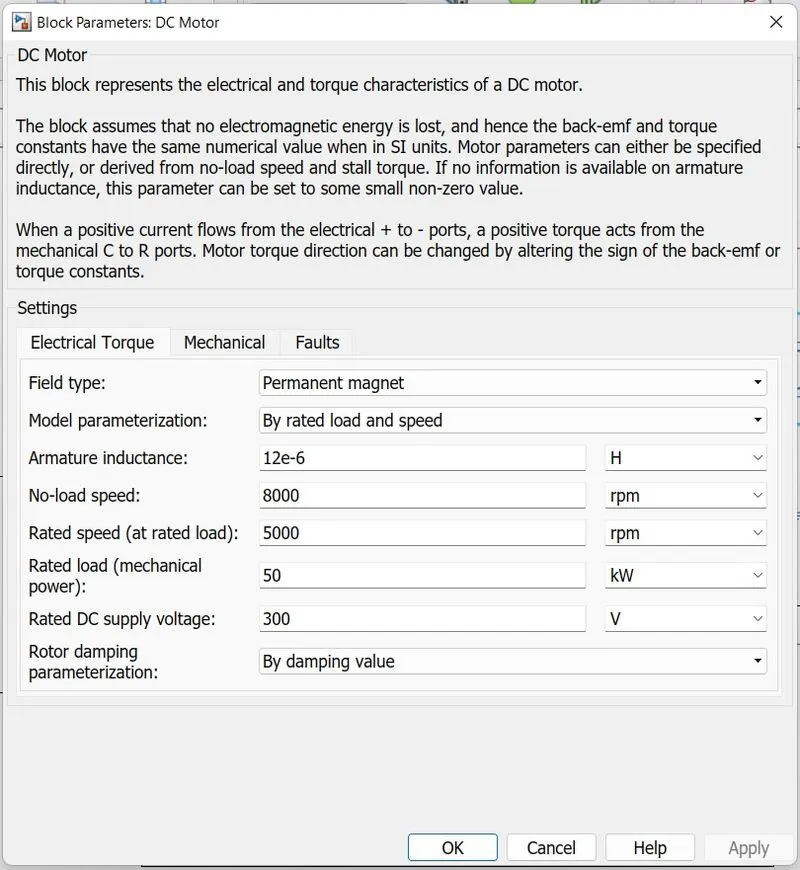
[Please Find Attached Model .slx File]
Output graphs:
(I) Case 1
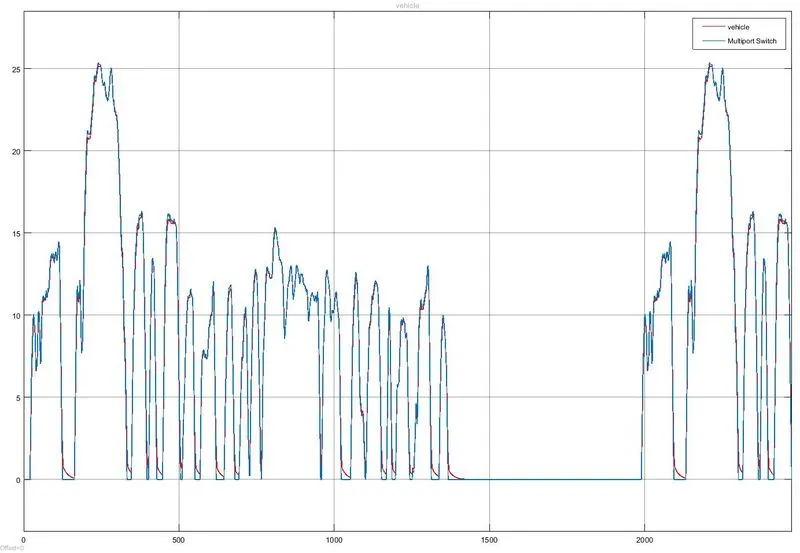
(i) Speed Charateristics:
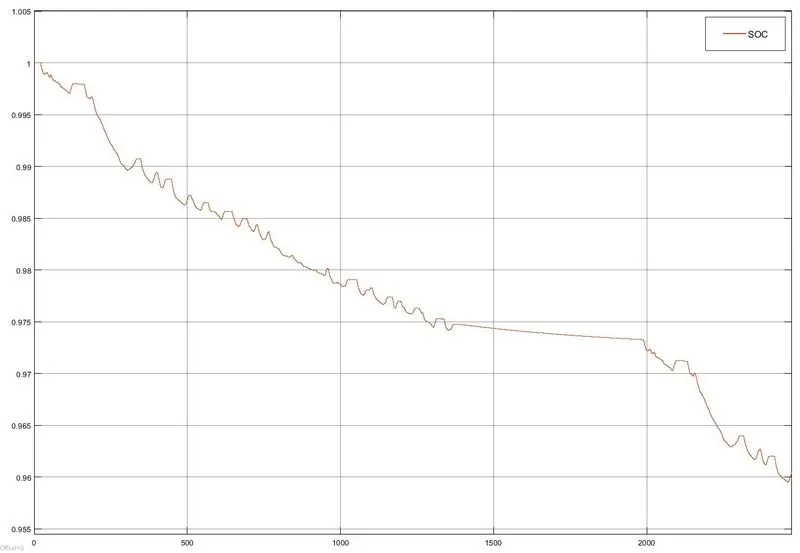
(ii) SOC (%):
(II) Case 2
(i) Speed Charateristics:
(ii) SOC (%):
(III) Case 3
(i) Speed Charateristics:
(ii) SOC (%):
(IV) Case 4
(i) Speed Charateristics:
(ii) SOC (%):
CONCLUSION:
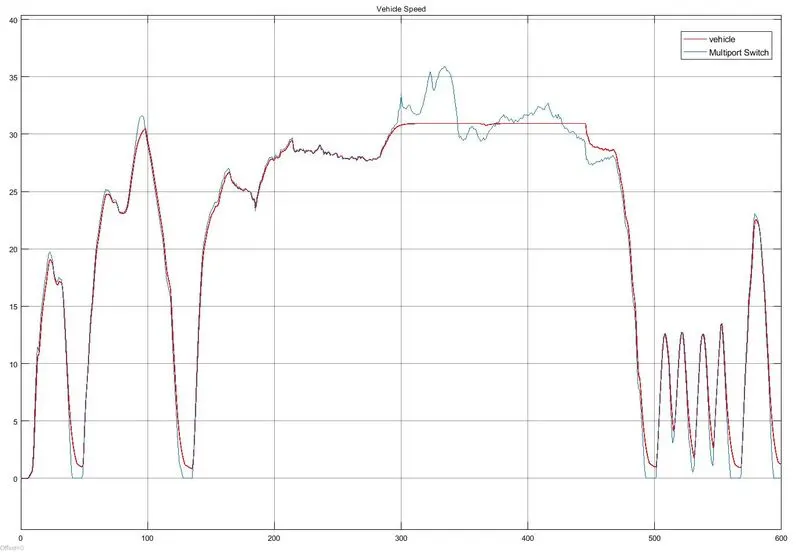
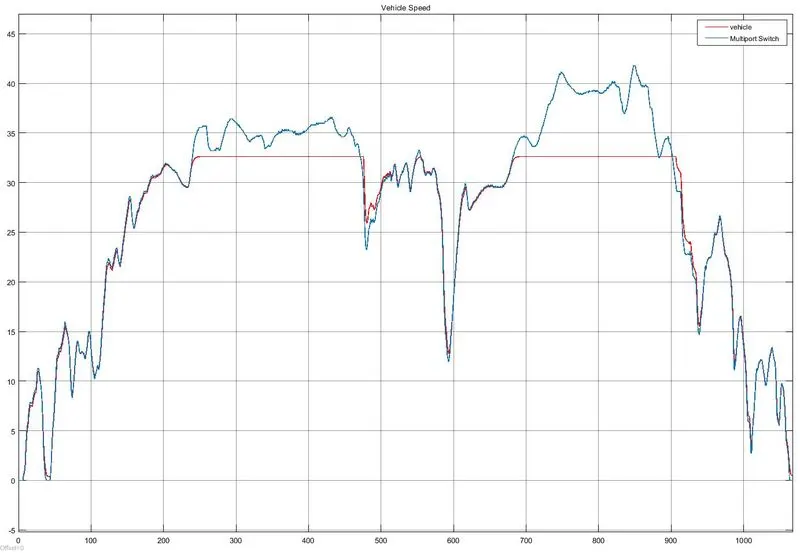
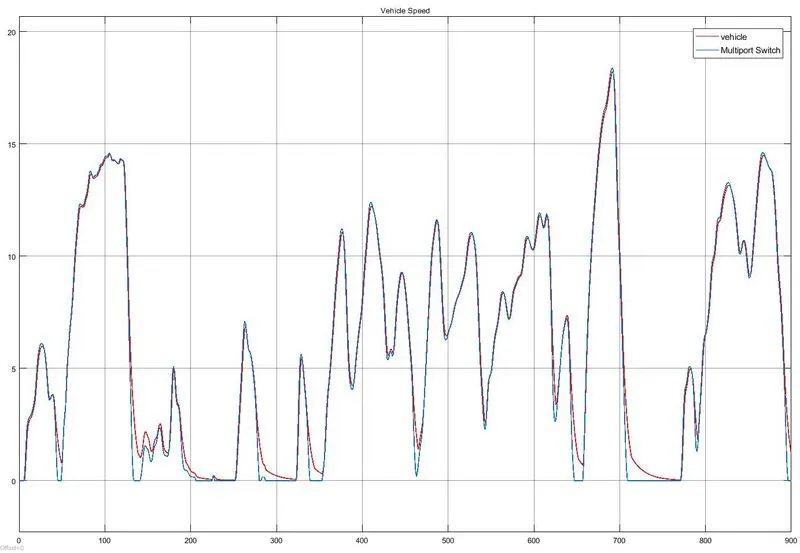
- The feedback speed plot and the reference speed plot almost entirely overlap in the speed trace plots for all the driving cycles recorded in this study, however there are sections where both speeds are different. That point in time occurs when the car begins to slow down.
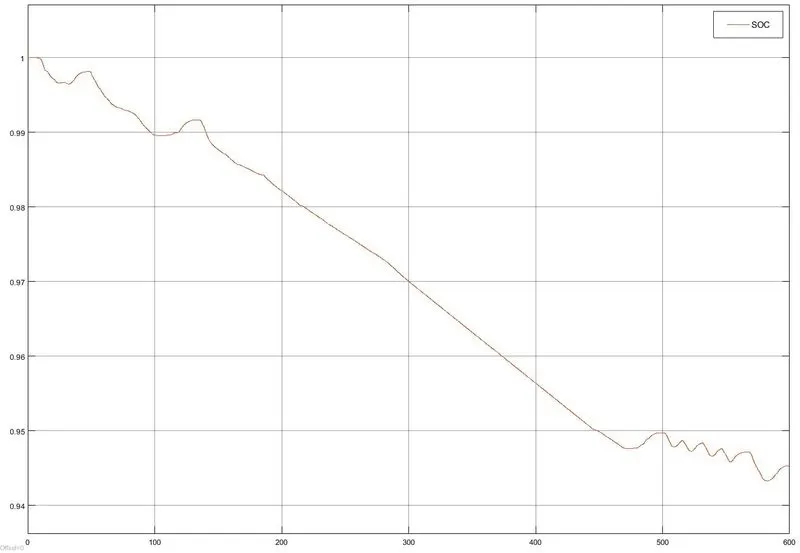
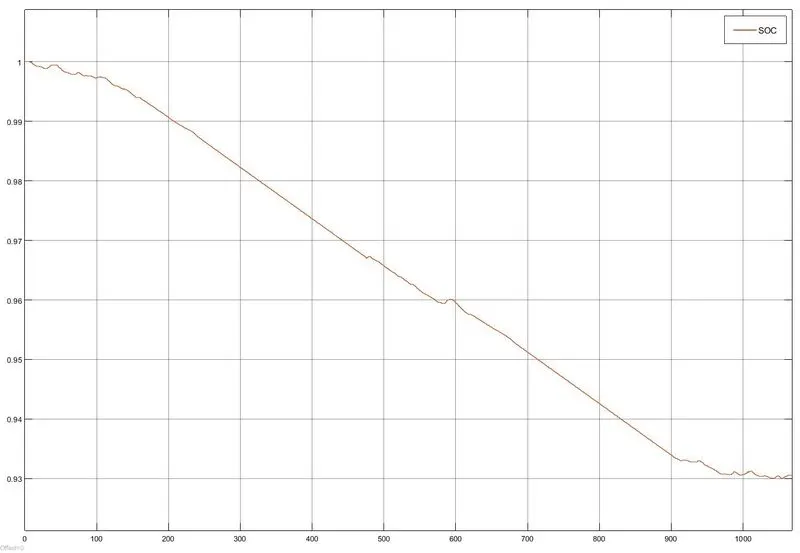
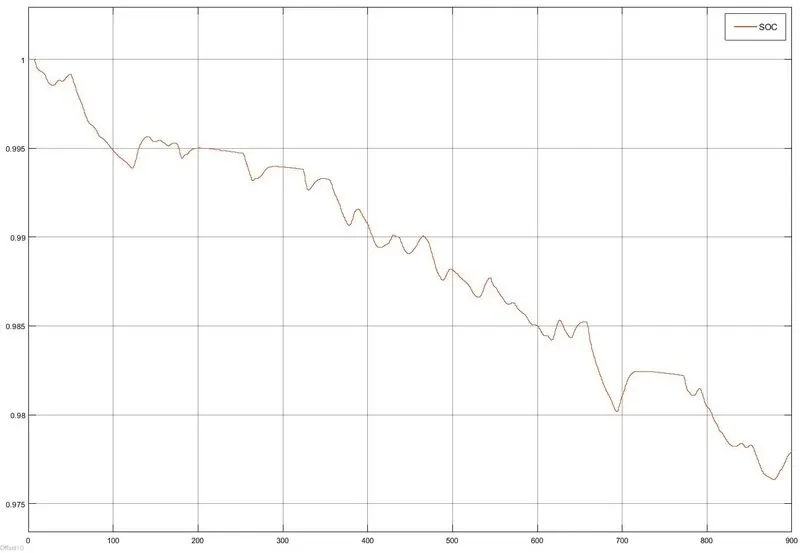
There is a precipitous decline in the reference speed plot, but no such trend in the feedback speed. It's because the vehicle's body has some inertia. When the vehicle's body inertia is strong, deceleration takes longer. Because of this, there is not a perfect overlap. - The SOC plot represents the charge level of the battery throughout each drive cycle. The SOC plot goes down while the car is moving but rises up little when deceleration begins. This is because regenerative braking charges the battery while slowing down.