3D CFD modelling of Air cooling system and liquid cooling system for battery thermal management
Comparative study of thermal performance of air-cooled and liquid-cooled battery modules:-
Air-cooled module:-
The temperature distribution over the module surface with the air-cooling system at the end of the discharge process. The flow rate and temperature of the air at the inlet of the cooling system are 3 L/s and 25 °C, respectively. As the hottest area on the module surface is located near the rear side of the module. Moreover, the hottest area is also concentrated on the left side of the module, where the Outlet manifold is located.
The average temperature distribution of the cells within the air-cooled module at the end of the discharge process for the different flow rates and the inlet temperature of 25 °C is depicted. A significant variation in the average temperature is observed between the cells. As it is seen, for all flow rates, the highest and lowest average temperatures in the air-type BTMS correspond to cell 11 and cell 1, respectively. Moreover, a significant temperature variation is observed between the cells.
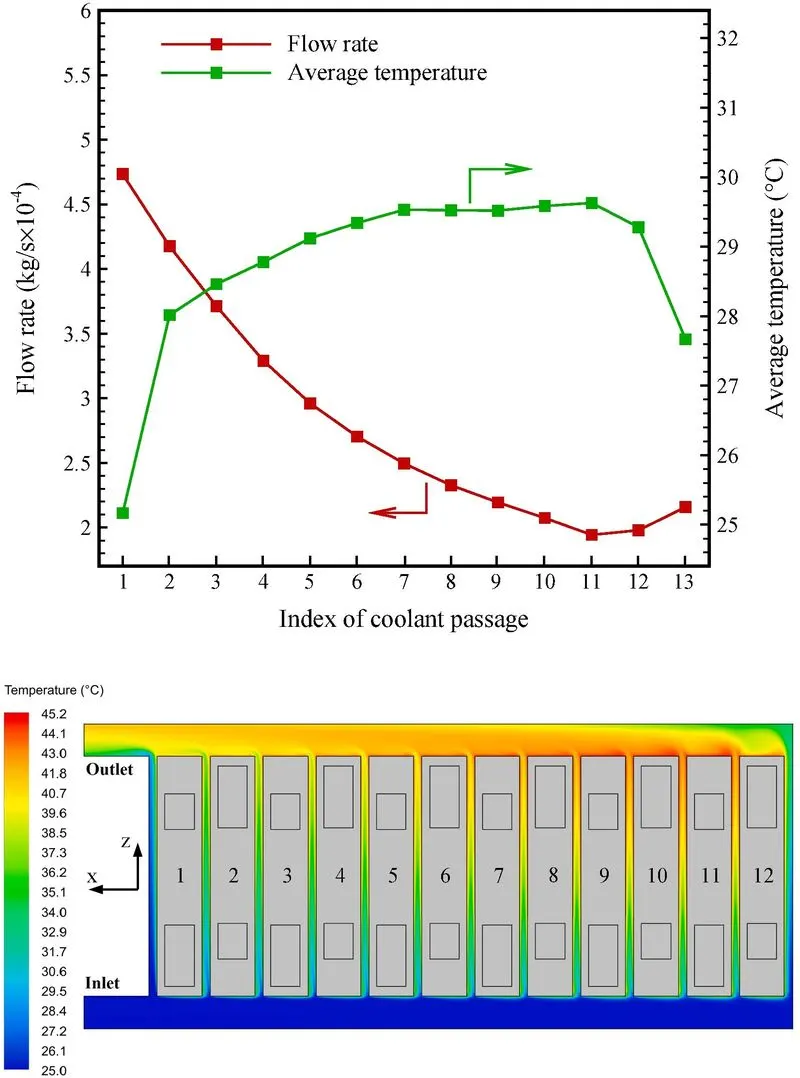
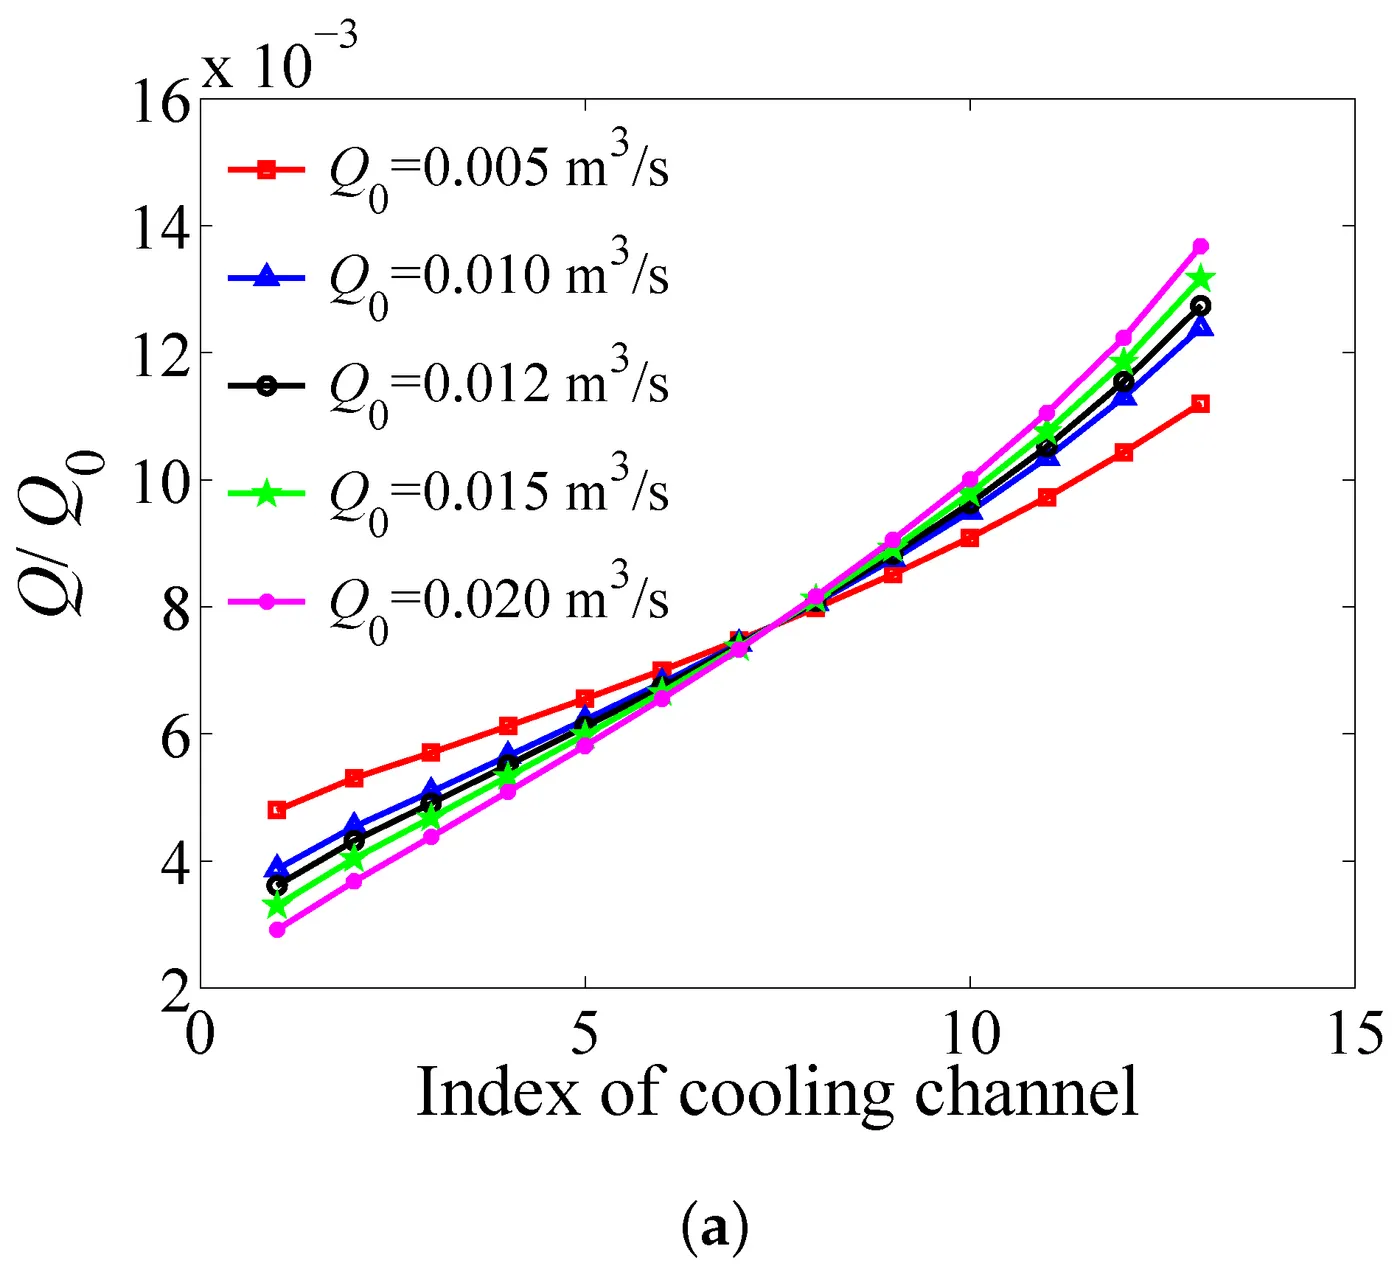
The thermal behaviour of the air-cooled module is strongly dependent on the airflow characteristics in the cooling channels between the cells. In this regard, the flow rate, and the average temperature of the air at the inlet of the cooling channels between the cells. Moreover, the temperature distribution of the air within the cooling system is depicted. These results are related to the end of the discharge process, and the flow rate and temperature of the air at the inlet of the cooling system are 3 L/s">L/s and 25 °C. The horizontal axis displays the index of cooling channels. There are 13 cooling channels between the cells, and the cooling channels are numbered the same as battery cells, from the front side of the module (where the inlet and outlet are located) toward the rear side. It is seen that the flow rate inside the cooling channels continually decreases as the channel index number increases from 1 to 11, and after that, it slightly increases. The average temperature of the air at the inlet of the cooling channels rises from channel 1 to channel 7. After that, a small variation in air temperature is observed from channel 7 to channel 11, and then it reduces. The air temperature increases as it passes through the cooling channels. Hence, the air temperature in the outlet manifold is much higher than the inlet manifold. These hydrodynamic and thermal characteristics of the air flow confirm the local and average temperature distribution of the cells within the module. Since the heat transfer from the cells to the air is proportional to the temperature and the flow rate of the air inside the cooling channels, the reduction of air flow and increment of air temperature in the cooling channels from the front side toward the rear side, causes the hottest area of the module to be revealed near the rear side. As the flow rate in the cooling channels 11 and 12 are the minimum ones, that is why cell 11 has the highest average temperature in the module. Moreover, the higher temperature of the air in the outlet manifold results in lower heat dissipation from the left side of the module, and consequently, the hottest area of the module is concentrated on the left side.
Liquid Cooled Module:-
The temperature distribution over the module surface with the liquid cooling system at the end of the discharge process is revealed. The inlet temperature and flow rate of the water are 25 °C and 0.5 L/min. The legend of the contour is the same as one used for the air cooling BTMS. It is observed that both sides of the module with the liquid cooling system are significantly colder than the other areas, and the hottest area is concentrated in the middle of the module. It is worth mentioning that the temperature distribution on each battery cell in the liquid-cooled module is almost the same. Comparing, it is clear that the liquid cooling system leads to a lower temperature of the module than air cooling due to the larger cooling capacity of water.
It depicts the average temperature distribution of the cells within the liquid-cooled module with at different flow rates and the inlet temperature of 25 °C. To remind the readers, the cells are numbered from the front side of the module toward the rear side. It is seen in this figure that for all flow rates, the maximum and minimum average temperatures correspond to cells 6 and 12, respectively. Moreover, a slight variation is observed in the average temperature between the cells.
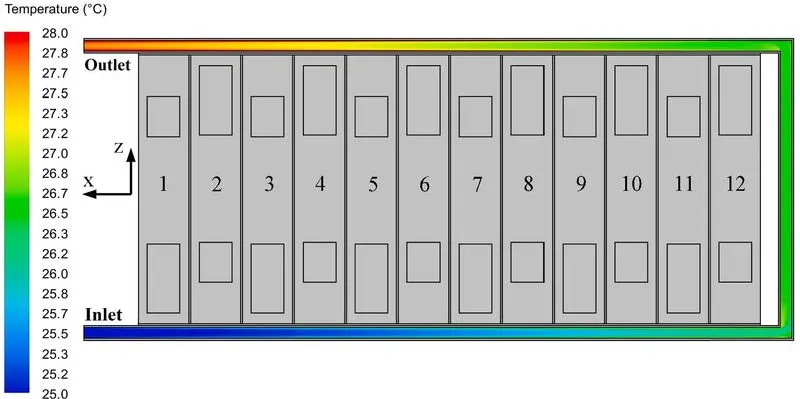
In order to pursue the understanding of the temperature distribution within the liquid-cooled module, the temperature of water at the midplane of the upper cooling channel in the cooling plate is displayed. This contour is obtained at the end of the discharge rate for the flow rate of 3 L/min">L/min and inlet water temperature of 25 °C. As it is observed, the water temperature is gradually rising along the flow path. The increase in water temperature leads to a decrease in heat transfer from the cells to water. Accordingly, the heat dissipation from cell 1 to cell 12 gradually decreases on the inlet side, whereas, on the outlet side, the heat transfer reduces from cell 12 toward cell 1. Since there is a very narrow gap between the cells in which the heat transfer is occurring mainly by conduction, the cells located at the ends are colder, and the cells in the middle of the module are hotter due to the accumulation of heat. Among cells 12 and 1, cell 12 is colder because the temperature of the water on both sides of this cell is approximately the same, which is around 26.3 °C. However, there is around 2.5 °C difference in water temperature on different sides of cell 1, which leads to unequal heat dissipation from the sides of this cell. It is worth mentioning again that due to the high cooling efficiency of water, the discrepancy of the temperature of the cells is tiny.
2.Module consists of 5 prismatic cells enclosed in an aluminum enclosure
3.Worst case scenario- cell soaked at 45⁰C ambient with heat generation corresponding to 0.5 C discharge
4.Inlet temperature of 20 ⁰C for both air and liquid.
Influence of the Discharge Rate:-
-
Set w2">w2 as the fixed value and set the initial range of w1">w1 as w11,w12">[w11,w12]. Calculate the middle point of the range w11,w12">[w11,w12] as w13=w11+w12/2">w13=(w11+w12)/2.
-
Let w1">w1 equal w11">w11, w12">w12 and w13">w13, respectively. Evaluate the values of ΔTmax">ΔTmax of these three BTMSs using the CFD calculation, respectively, denoting them as ΔTmax,1">ΔTmax,1, ΔTmax,2">ΔTmax,2 and ΔTmax,3">ΔTmax,3.If ΔTmax,1<ΔTmax,3">ΔTmax,1<ΔTmax,3,let w11=w11,w12=w13,w13=w11+w12/2">w11=w11,w12=w13,w13=(w11+w12)/2, then return to Step 2 and continue the process.else if ΔTmax,2<ΔTmax,3">ΔTmax,2<ΔTmax,3,let w11=w13,w12=w12,w13=w11+w12/2">w11=w13,w12=w12,w13=(w11+w12)/2, then return to Step 2 and continue the process.elsego to Step 3.
-
The range for w1">w1 is reduced through using the following strategy. Let w14=w11+w13/2">w14=(w11+w13)/2 and w15=w13+w12/2">w15=(w13+w12)/2. Evaluate the values of ΔTmax">ΔTmax of the two BTMSs with w1=w14">w1=w14 and w1=w15">w1=w15 using CFD calculation, respectively, denoting them as ΔTmax,4">ΔTmax,4 and ΔTmax,5">ΔTmax,5.If ΔTmax,4<ΔTmax,3">ΔTmax,4<ΔTmax,3,let w11=w11,w12=W13,w13=w14,ΔTmax,1=ΔTmax,1,ΔTmax,2=ΔTmax,3,ΔTmax,3=ΔTmax,4">w11=w11,w12=W13,w13=w14,ΔTmax,1=ΔTmax,1,ΔTmax,2=ΔTmax,3,ΔTmax,3=ΔTmax,4.else if ΔTmax,5<ΔTmax,3">ΔTmax,5<ΔTmax,3,let w11=w13,w12=w12,w13=w15,ΔTmax,1=ΔTmax,3,ΔTmax,2=ΔTmax,2,ΔTmax,3=ΔTmax,5">w11=w13,w12=w12,w13=w15,ΔTmax,1=ΔTmax,3,ΔTmax,2=ΔTmax,2,ΔTmax,3=ΔTmax,5.elselet w11=w14,w12=w15,w13=w13,ΔTmax,1=ΔTmax,4,ΔTmax,2=ΔTmax,5,ΔTmax,3=ΔTmax,3">w11=w14,w12=w15,w13=w13,ΔTmax,1=ΔTmax,4,ΔTmax,2=ΔTmax,5,ΔTmax,3=ΔTmax,3.
-
If w13−w11">(w13−w11) and w12−w13">(w12−w13) are both smaller than a specified threshold, the optimization process is stopped; otherwise, return to Step 3, and continue the process.
-
The temperature rise and the temperature difference of the battery pack increase as the discharge rate increases, but the discharge rate cannot be controlled effectively.
-
Reducing the inlet air temperature can reduce the absolute temperature of the battery pack, but cannot effectively reduce the temperature rise and the temperature difference of the system.
-
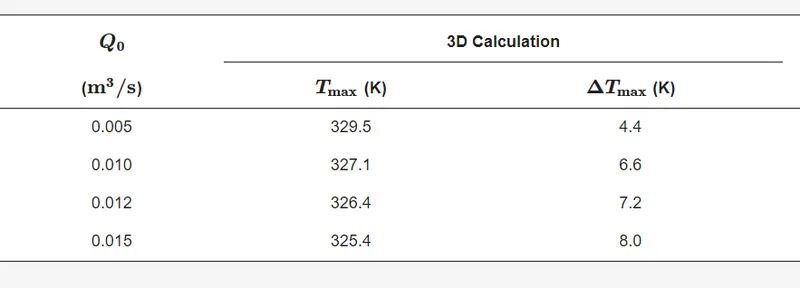
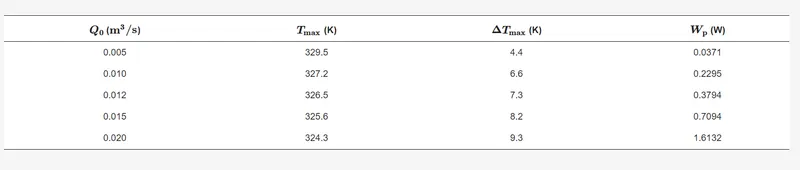
As the inlet airflow rate increases, the maximum temperature of the battery pack is reduced, but the temperature difference of the battery pack and the power consumption to maintain the flow rate are both increased.
-
As the cell spacings decrease, the temperature and the temperature difference of the battery pack are both reduced effectively. However, the decrease of the cell spacing increases the power consumption of the system significantly.
-
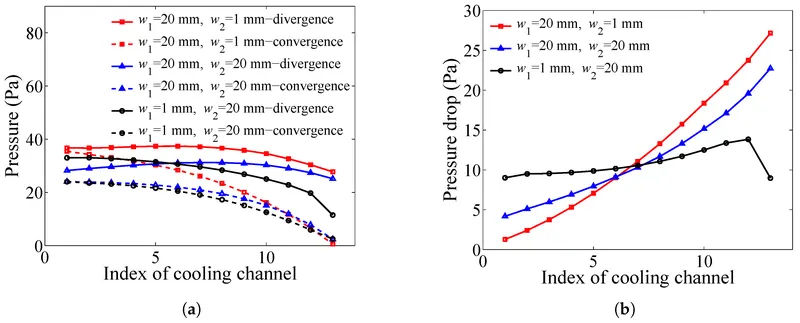
The angles of the plenums remarkably influence the performance of the BTMS. The maximum temperature and the maximum temperature difference of the battery pack can be reduced effectively through optimizing the angles of the plenums, without increasing the total volume and the power consumption of the BTMS.