Project 2
1)To observe the following plots of the vehicle for the US06 drive cycle
a) Acceleration ? brake
b) Torque required
c) power required
d) power distribution among three energy sources
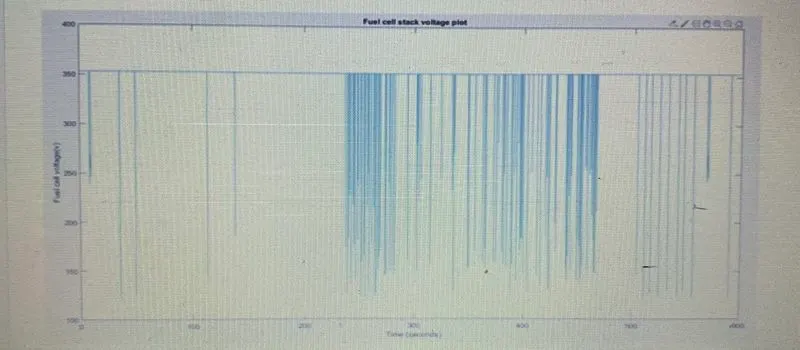
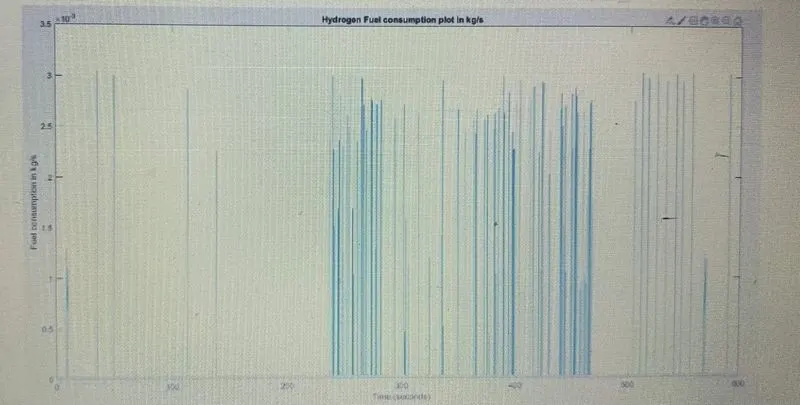
e) Fel cell voltage, current, power and fuel consumption
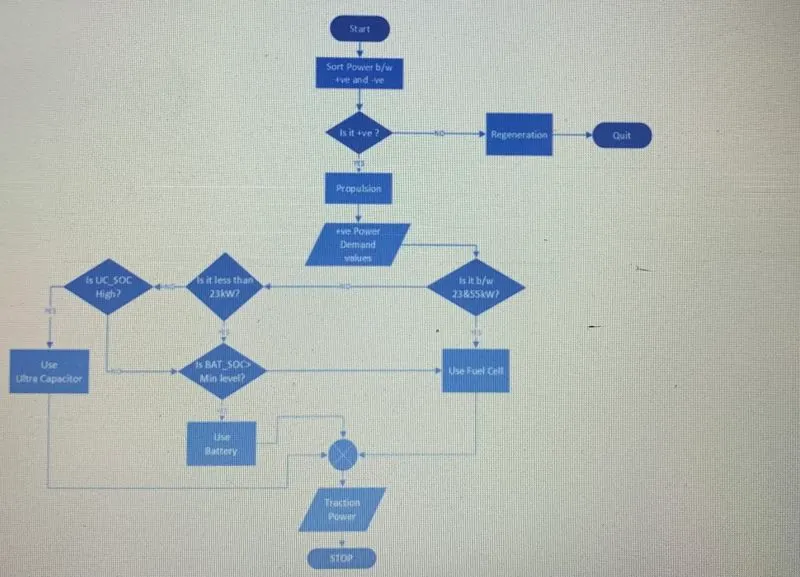
2)Energy management distribution alogorithm for positive power distribution
The Energy management system implemented here will follow rule based alogorithm foe the implementation of parallel hrbrid systems.
The implementation algorithm and flow chart are explained below.
The operating range of the sources is as follows.
1) Fuel cell 23kw - 55kw
2) Batterry - less than 23kw when SOC is more than 35%
3) Ultra capacitors - above 55kw when SOC is more than 35%
3) Simulink Modelling
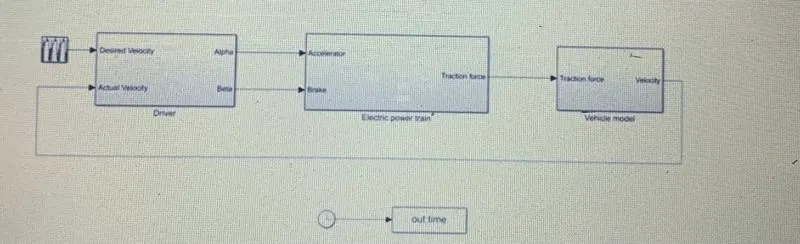
The complete simulink model of the vehicle is shown below. There are 3 main subsystems.
1. Driver
2.Electric power train
3. vehicle
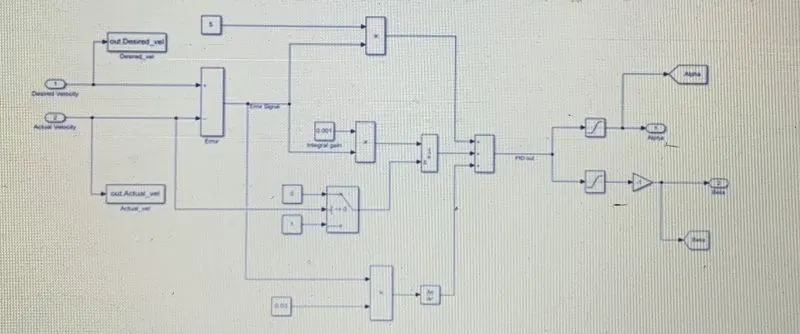
Driver model
The basic function of driver block is to generate Acceleration and Brake signals according to desired velocity and actual velocity commands.
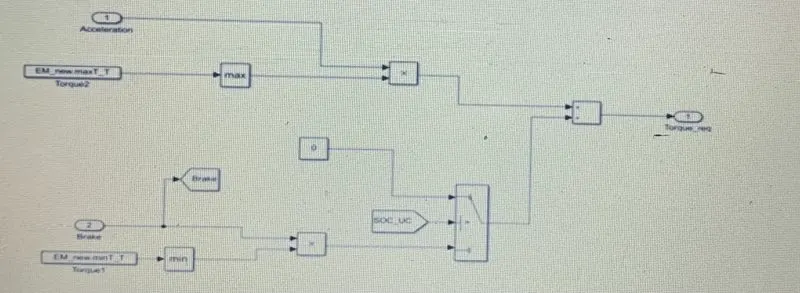
Controller
The controller block generates required torque signal from acceleration and brake commands. Electric motor torque values are declared in workspace as variable array and negative values are declarede as variable.
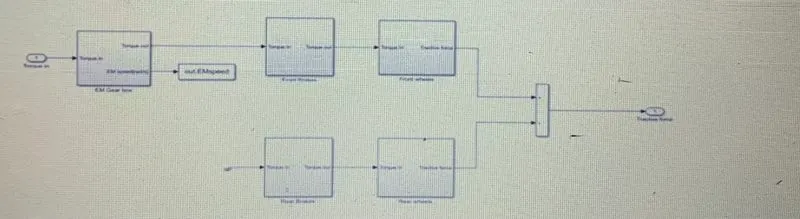
Tractive Force
The Torque to Tractive force calculation can be done in Tractive force subsystem which includes gear box model, wheels alone.
The rear wheels will only have mechanical bracking.
Fuel cell stack subsystem
1) Stack voltage
2) Air and H2 consumption
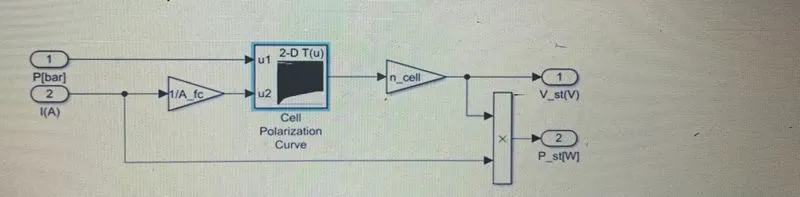
Stack voltage
The stack voltage subsystem will give the stack voltage value for different cathode pressures and current where A_fc is the area of fuel cell and n_cell is the number of cells in series.
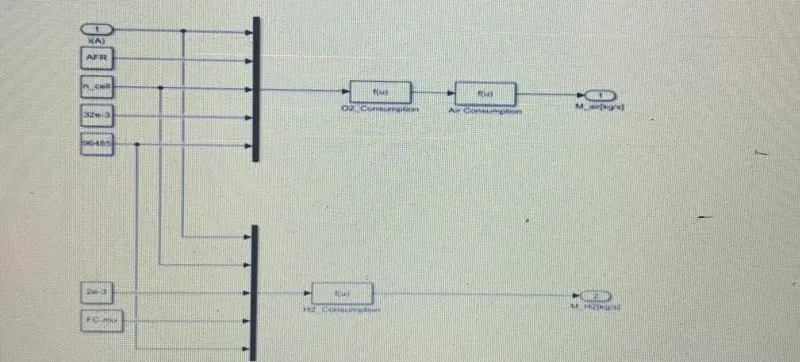
Air and H2_compression
The Oxygen consumption is given by
O2 consumption = (I*AFR*no. of cells in series*molar mass of O2)/(4*F)
where I = Stack current
AFR = Air fuel ratio
molar mass of O2 = 32e-3
F= faradays constant = 96485
the air consumption is given by,
Air consumption = O2 consumption / (0.21*32/(0.21*32+0.79*28)
where Approximate air;
molar mass of O2 =32 and N2 = 28
The hydrogen consumption = I*no of cells in series * molar mass of H2/ 2*FC.mu*F
where FC.mu = hydrogen utility factor
molar mass of H2 = 2e-3
F = faradays constant
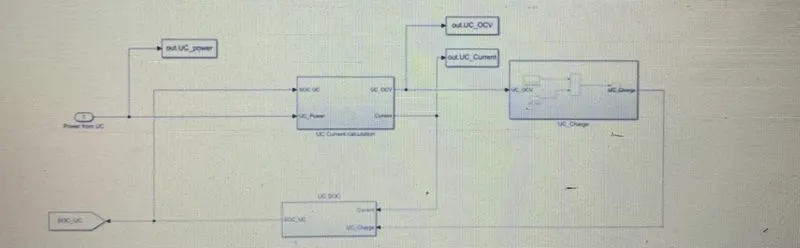
Modelling of Ultracapacitor in SIMULINK
The Ultra capacitor model is as shown in the figure below. There are two subsystems inside it to estimate current and SOC.
RESULTS Analysis
The actual velocity and desired velocity of the vehicle have been plotted in figure
it has been understand that the vehicle designed here does not exactly follow the desired velocity
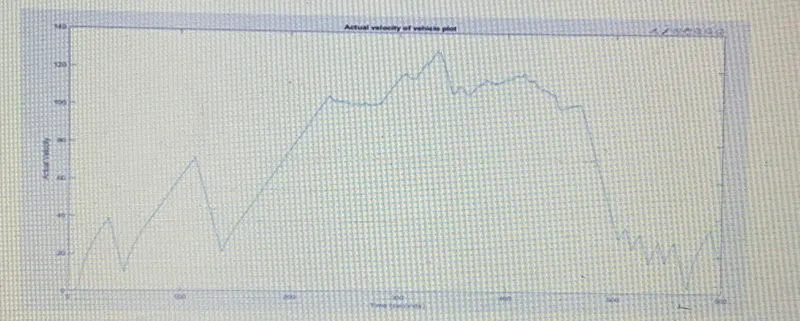
velocity plot:
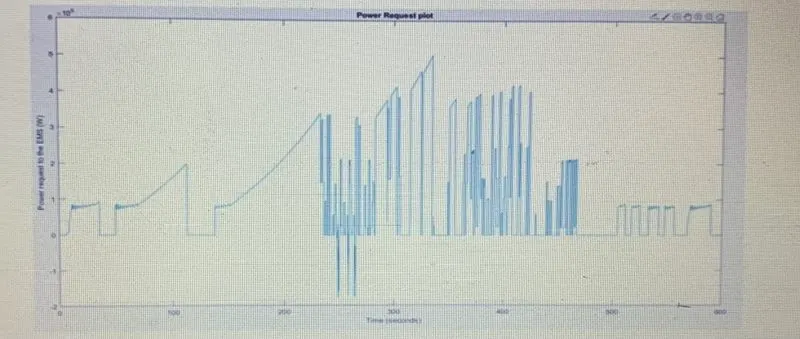
Torque request for power calculation:
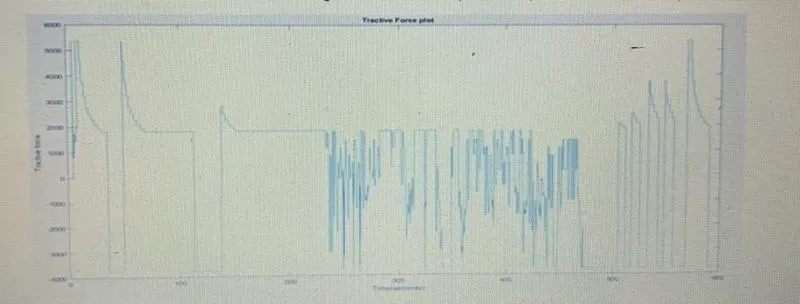
Tractive force output:
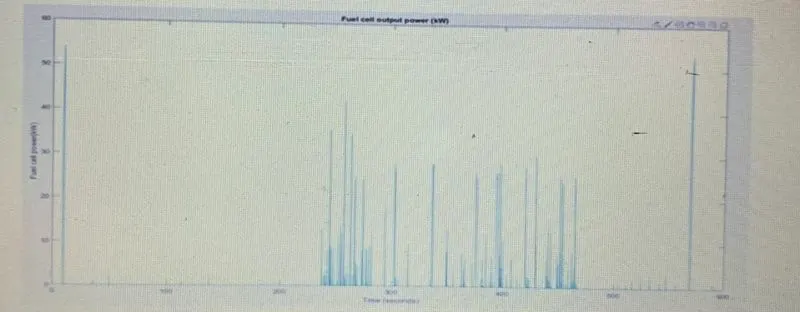
Fuel cell output power:
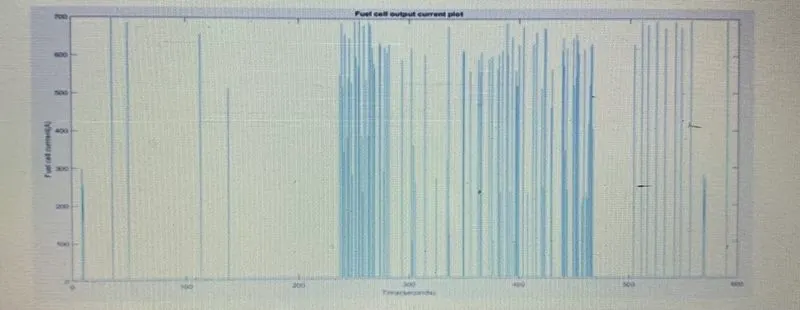
Fuel cell current:
Hydrogen fuel consumption plot:
Conclusion:
The complete model of Hybrid electric vehicle has been modelled and simulated using MATLAB Simulink.
1. Driver model with acceleration and brake commands.
2. Hybrid Electric power train which includes.
3. Controller
4. Tractive force
5. Fuel cell model
6. Ultracapacitor model
7. Battery model.