Project 1
As shown in the above flowchart, there are two power sources Fuel cell and battery
The Simulink model is developed for this as shown below; then
we have fuel cell power is kept between 0 to 1000w
operating region of FC is 1000w to 9000w. And max power demand is set till 9000w to 10000w.
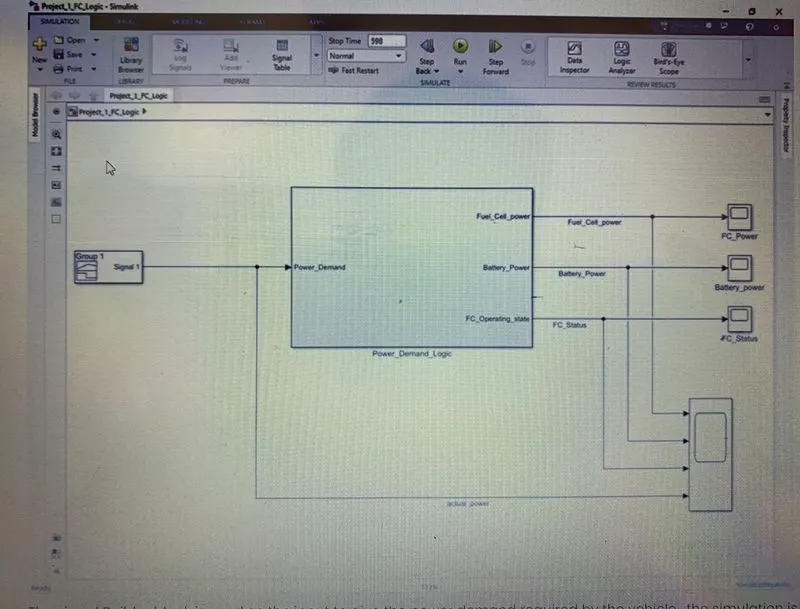
The Signal Builder block is used as the input to give the power demand required by the vehicle. The simulation is run for 400 sec. The output such as Fuel cell power, battery power, and FC status are studied by connecting it to the scope.
Then the logic block of the Simulink is shown as
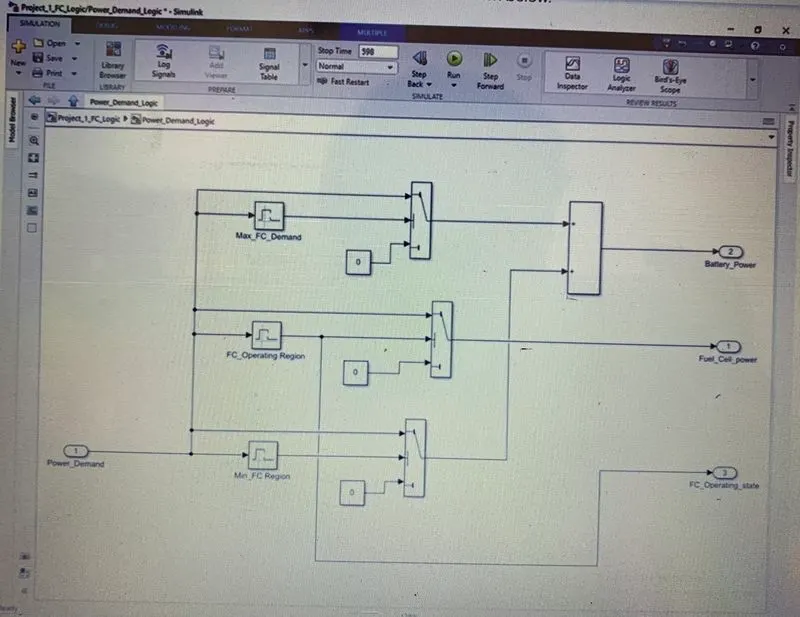
The interval test block is used to set the FC min, max, and operation region; the limits are set as discussed above. Then as per logic, the switch block is set and the output id been connected to FC or battery as mentioned in the flowchart.
The signal builder profile is as shown below:
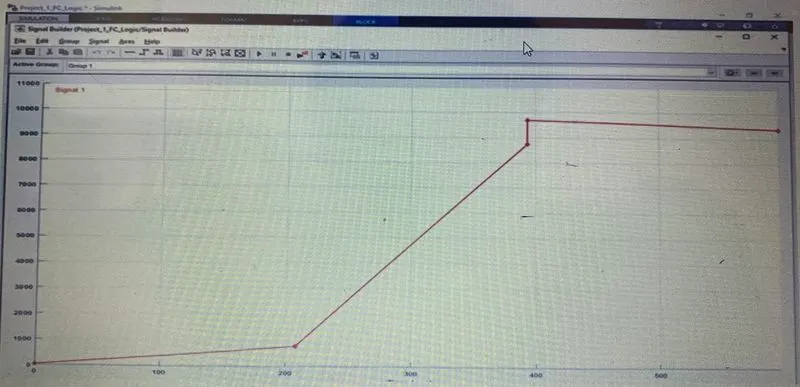
As a signal builder for 0 to 150 seconds, the power demand is between 0-1000w, and from 150to 300 seconds, the power demand is between 1000 - 9000w, and for the rest, it si above 9000w.
RESULTS:-
From the results, it's clear the logic developed is full proof and working as per the logic defined.
Therefore, we can see that the fuel cell is in operation.