Project 2
AIM :- To find the water current forces, centrifugal forcee, wave forces, snow loads temperature loads, and barge impact loads and apply these forces in STADD PRO.
LIVE LOAD CALCULATION
1. Water current forces
Given:- Maximum crest elevation = 3 m
High flood level = 4 m
span of bridge = 40 m
mean velocity of river = 2.5 m/s
k = 0.6 (for circular pier)
Maximum velocity, V = UNDERROOT">UNDERROOT2 * Vmean
= Root 2 * 3
= 3.53 m/s
Water current, P = 52*K*V*V
= 52*0.6*3.53*3.53
= 388.79 KN/m2
2. CENTRIFUGAL FORCE
Given:-
Design speed = 50 km/h
Radius of curvature = 2 m
Live load, W = 70 KN
Centrifugal force, = (WV2)/127R
= 70*50*50/127*2
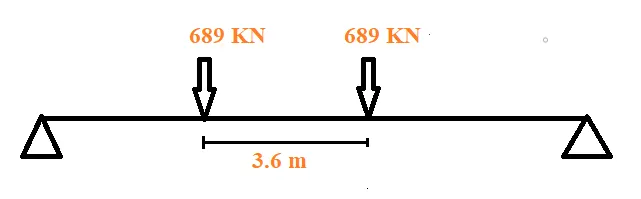
= 689 KN
The centrifugal force is 689 KN
The centrifugal force of 689 KN is applied on the superstructure as shown below
3.6 m-------width of vehicle
3. WAVE FORCES
Given:
Maximum crest elevation = 3 m
Number of girder supporting bridge, N = 4
Span length = 12 m
Width of deck slab = 10.5 m
Thickness of deck slab = 2 m
r = 5, Cva = 3, Cr = 0.4,
Storm elevation = 8.5 m
Depth of accumulation of snow = 1.25 m
Zh = Maximum crest elevation - Centroid of I Section
= 3 - (1.6/2)
= 2.2 m
Zv = Maximum crest elevation - Elevation of bottom deck
= 3-1.6
= 1.4 m
Vertical load, Fv = r x Zv x Av
= 5 x 1.4 x (10.5 x (1.6/2)
= 90.3 KN
Horizontal load, Fh = r x Zh x Ah
= 5 x 2.2 x (4 x 40)
= 1760 KN
Maximum vertical load, (Fv)max = Cva x Fv
= 3 x 90.3
= 271 KN
Maximum horizontal load, (Fh)max = (1+Cr(N - 1)) Cva x Fh
= (1+0.4(4-1) x 3 x 1760
= 11616 KN
4. SNOW LOAD
Given:
Span of the bridge = 40 m
Density of snow = 300 KN/m3 (As snow is settled snow)
Depth of snow = 1.25 m
Flat deck, angle beta = 0 degree
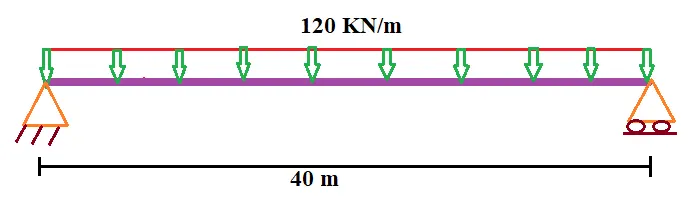
Snow load, So = 3 x 1.25 x 40
= 150 KN/m
- Shape coefficient from IS 875 Part 4
- For angle beta < 30 degree, u = 0.8
Design snow load, S
- S = u x So
= 0.8 x 150
= 120 KN/m
5. TEMPERATURE LOAD
Given:
Span of the bridge = 40 m
Width of deck slab = 10.5 m
Thickness of deck slab = 1.25 m
- Maximum temperature in the location as per IRC 6 Isotherm at the location = 47.5 degrees
- Minimumm temperature in the location as per IRC 6 Isotherm at the location = -2.5 degrees
- Effective temperature difference = [(45 - (-2.5)] / 2 + 10
= 33.75 degrees
Stress due to temperature = alpha x delta T X E
= 11.27 X 33.75 X 5000`ROOT`40
= 12.02 KN/m2
Maximum permissible stress = (2/3) * 0.7 `ROOT`fck
= 2.95 kn/m2
Hence the stresses are restricted to 3 kn/m2
- Maximum temperature = 47.5 degree
- Minimum temperature = -2.5 degree
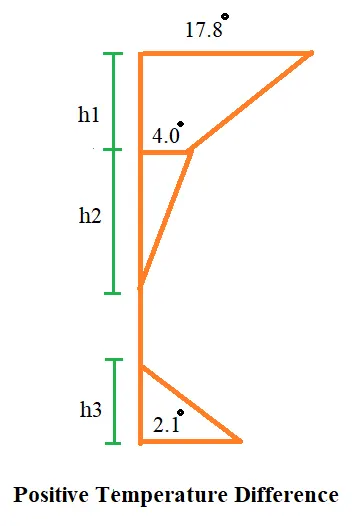
- Positive temperature difference
- Temperature at top = 47.5 degree
- Temperature at bottom = (2.1 / 17.8) x 47.5
= 5.60 degrees
6. BARGE IMPACT FORCE
Given:-
DWT = 25000
Speed = 60 km/h
Ch = 1.25
KE = 500*1.25*25000*60*60
= 4342014.062 N-mm
Barge damage depth, aB
aB = 3100 * ([1+1.3*(10 Power minus 7)*4342014.0625) power 0.25 -1]
= 777.5 mm
As aB> 100 mm
Pb = 6*(10 power 6)+1600*aB)
= 7244 KN
- PROCEDURE:-
1. Firstly a node is created. The height of pier is taken as 10 m.
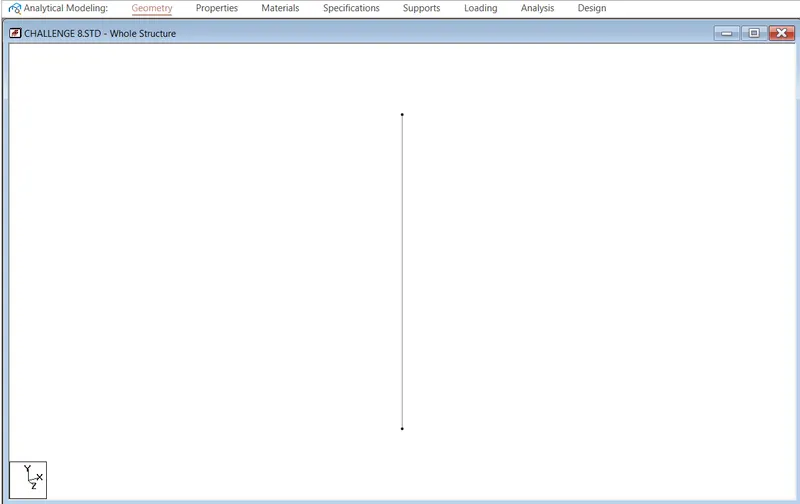
Figure Pier is created using node
2. After that with the help of translational repeat the frame of bridge is created.
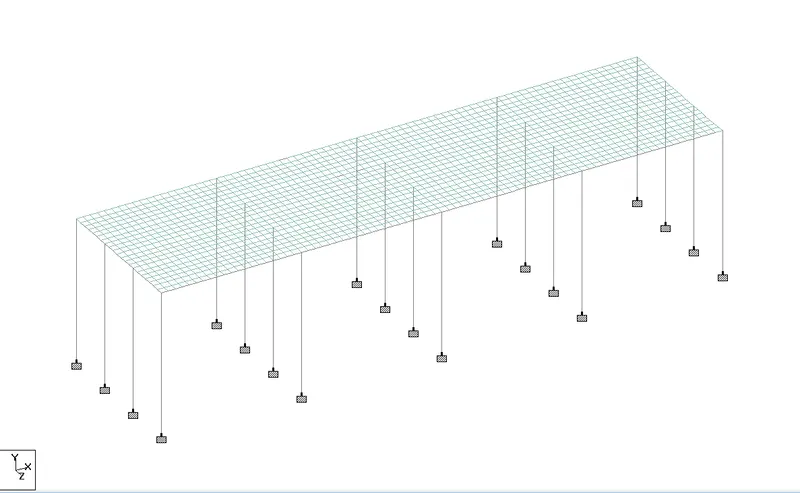
Figure Bridge frame is created with the help of node using translational repeat option
3. The bridge deck is created by using the mesh size of 0.5*0.5 m. The thickness of deck slab is 1.5 m
4. A square pier of diameter 1.2 m x 1.2 m is created.
5. A fixed support is created at the base of the pier.
6. Rectangular girder and cross beam of size 0.6 m * 1.2 m is created using define option.
7. Cross beam of size 0.6 m * 1.2 m is created.
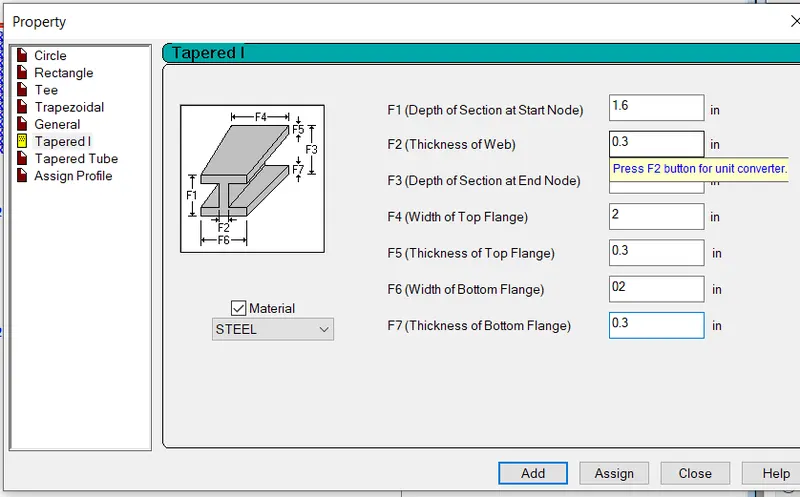
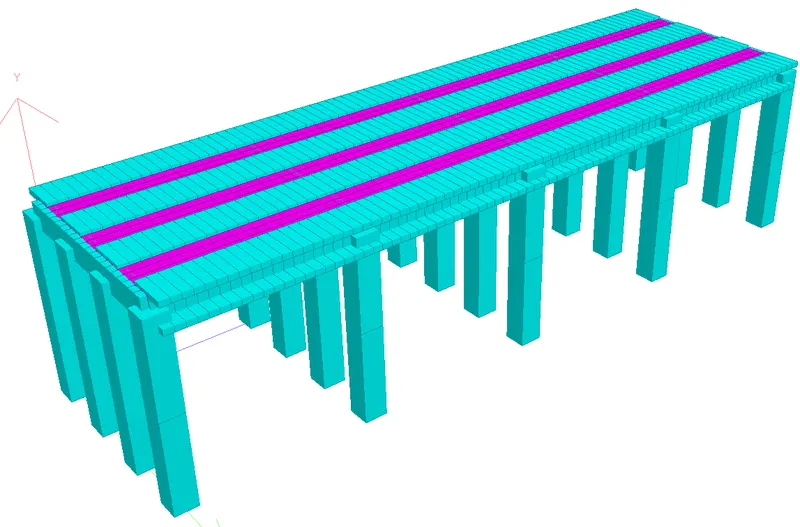
Figure 3D view of bridge
- LOADING
Firstly self weight i.e gravity load of -1 is applied on the whole structure
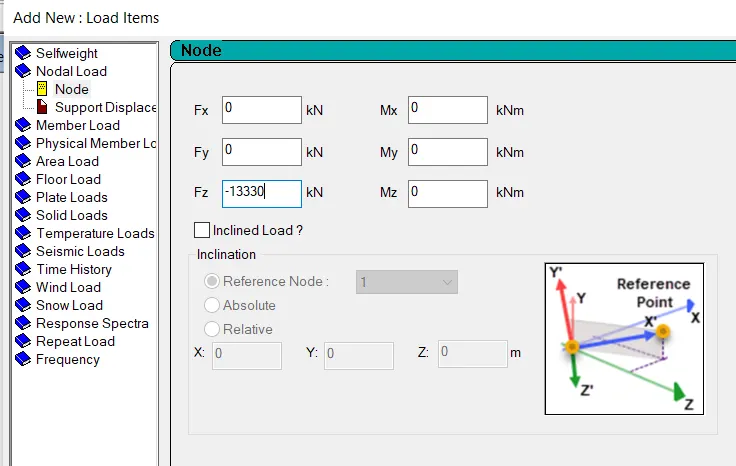
Figure Defined loading condition
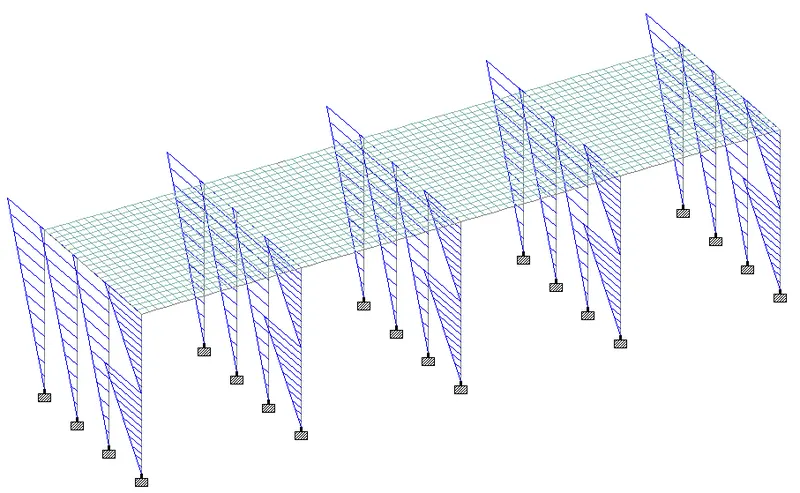
Figure Water current load
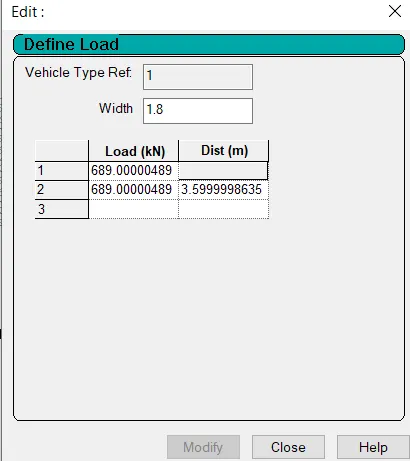
Figure Centrifugal load
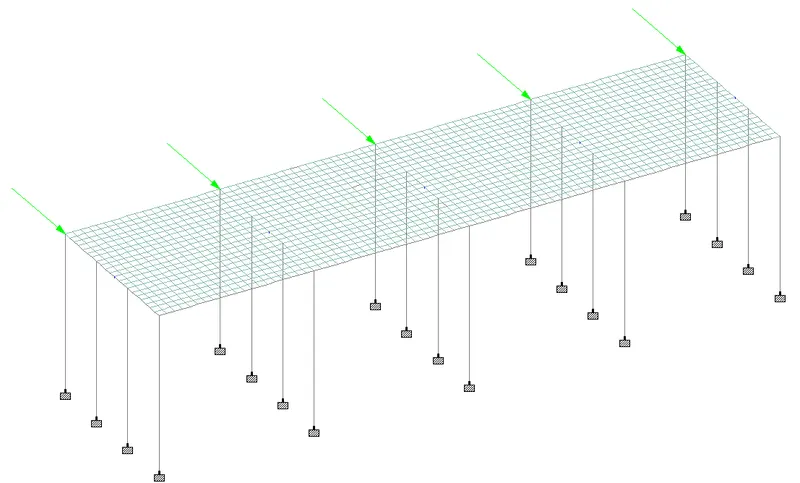
Figure wave load
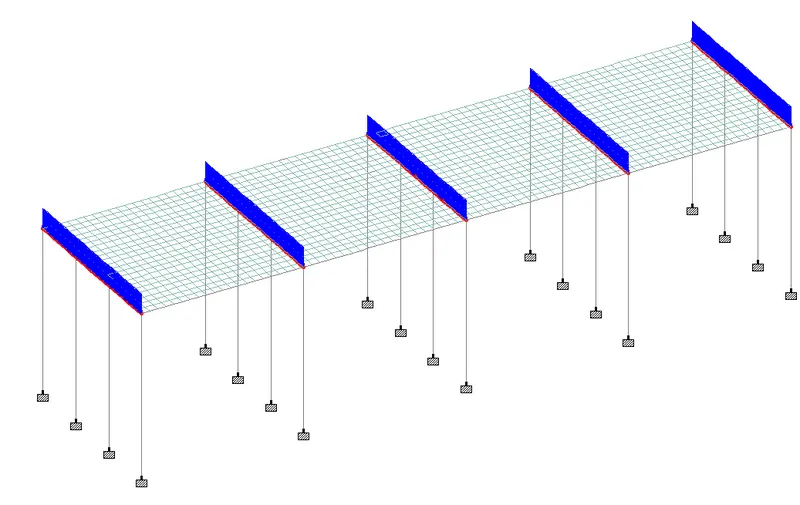
Figure Snow load ( Applied at all cross beam)
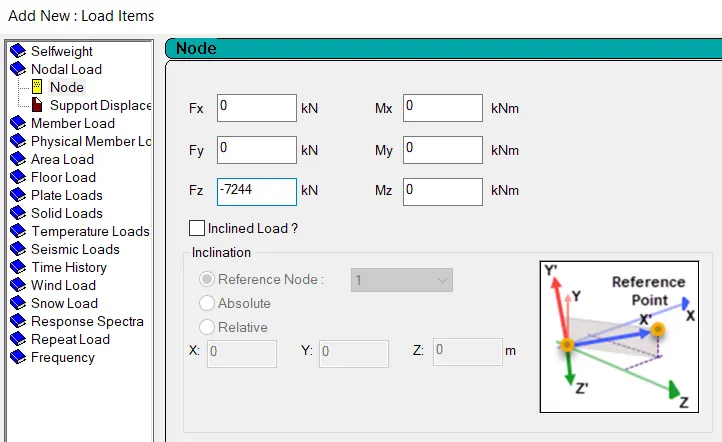
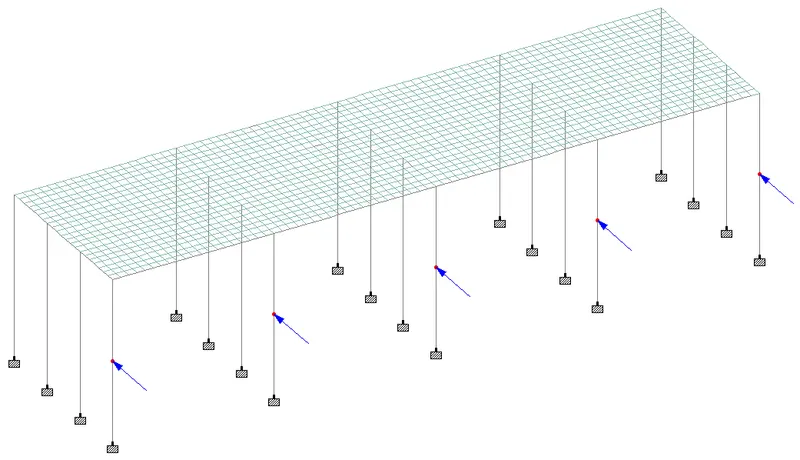
Figure Loading diagram of Barge impact Load
BARGE IMPACT LOAD is applied at the C.G of the pier in the form of point load at the node.
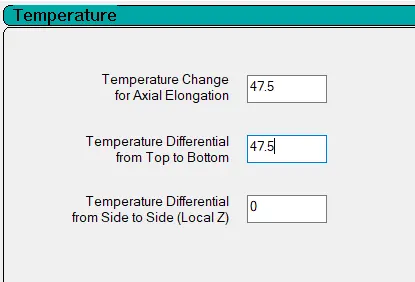
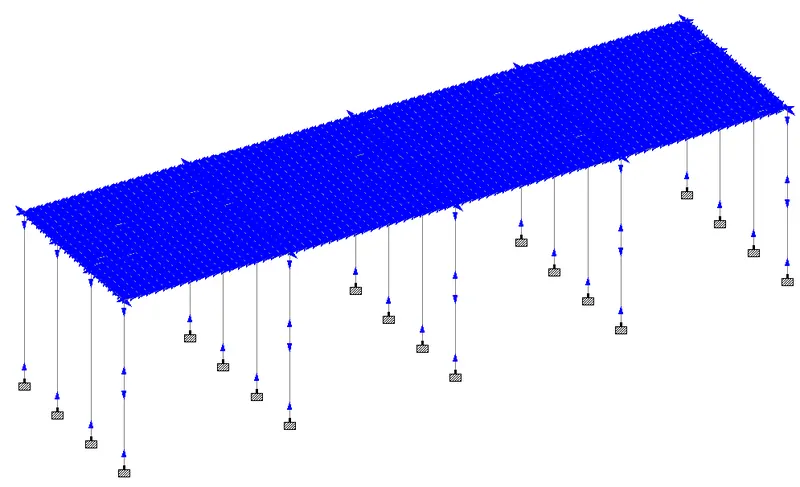
Figure Temperature load
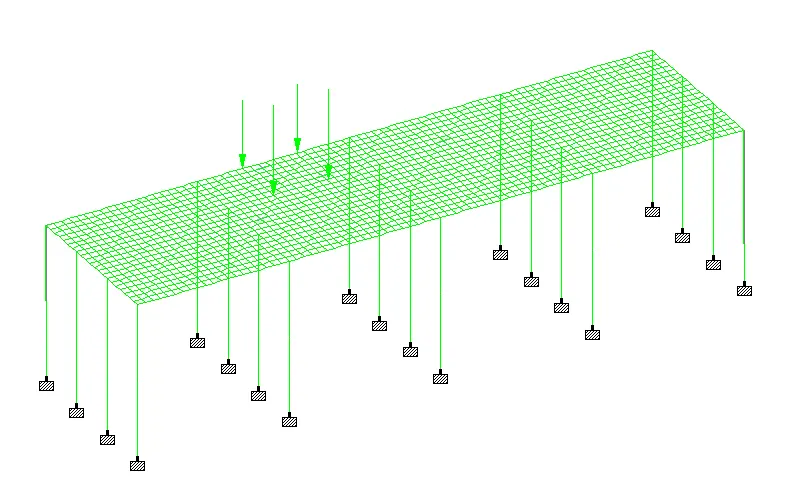
Figure Centrifugal load
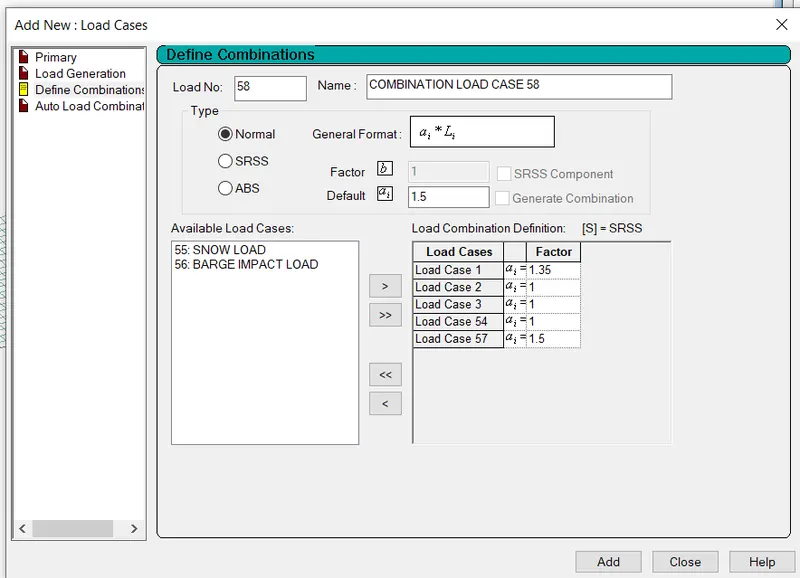
Figure load case details
- RESULT ANALYSIS:-
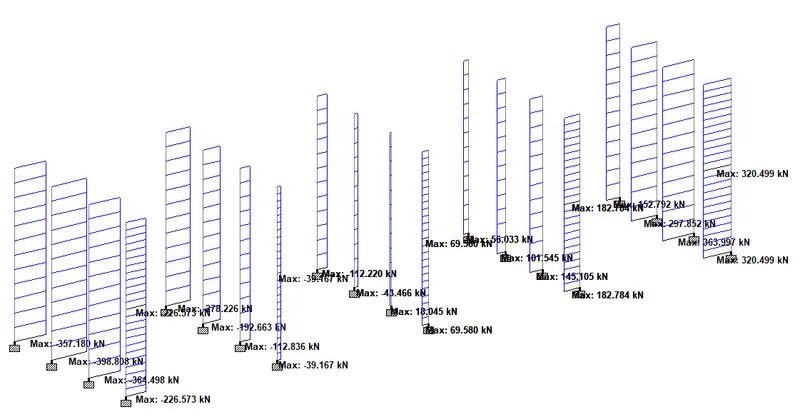
1. STATIC CHECK:- Static check is ok as the difference between load and reaction is zero.
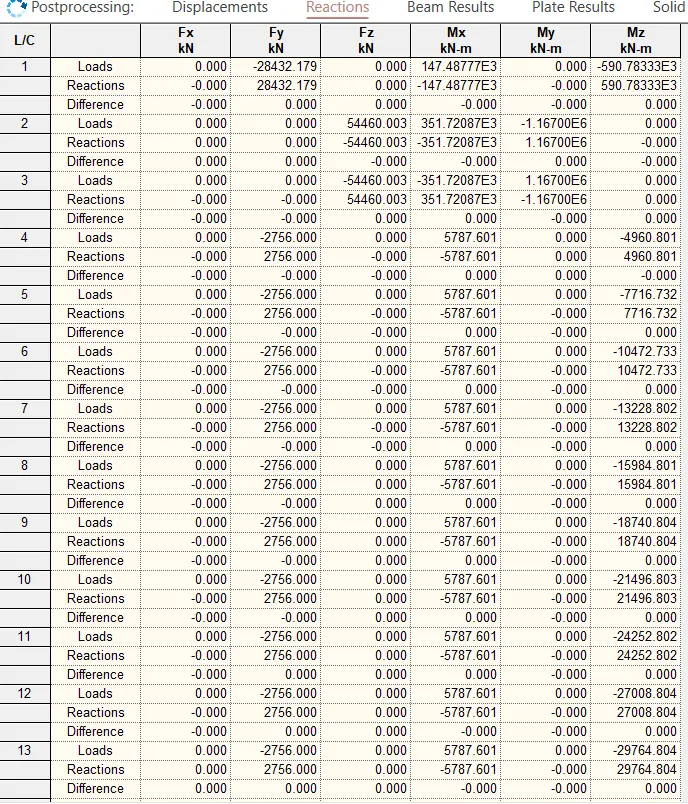
Figure Static check
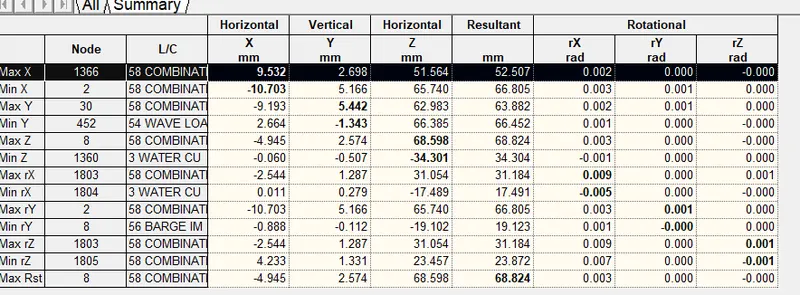
2. DEFLECTION:- Maximum deflection of the structure is 68.824 mm in Z direction at node 8.
3. REACTION:-
| Horizontal | Vertical | Horizontal |
| Fx (KN) | Fy (KN) | Fz (KN) |
| 398.808 | 7670 | 5122 |
| Moment | Moment | Moment |
| Mx (KN-m) | My (KN-m) | Mz (KN-m) |
| 23045 | 240 | 3509 |
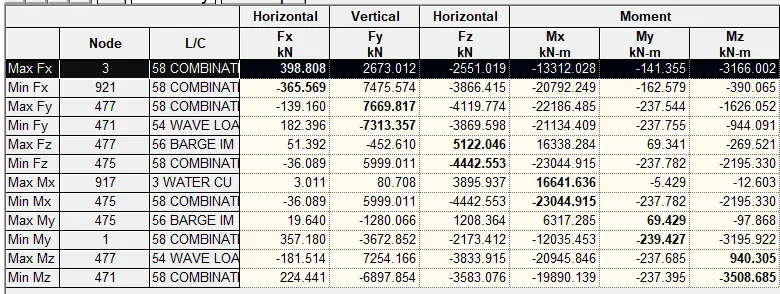
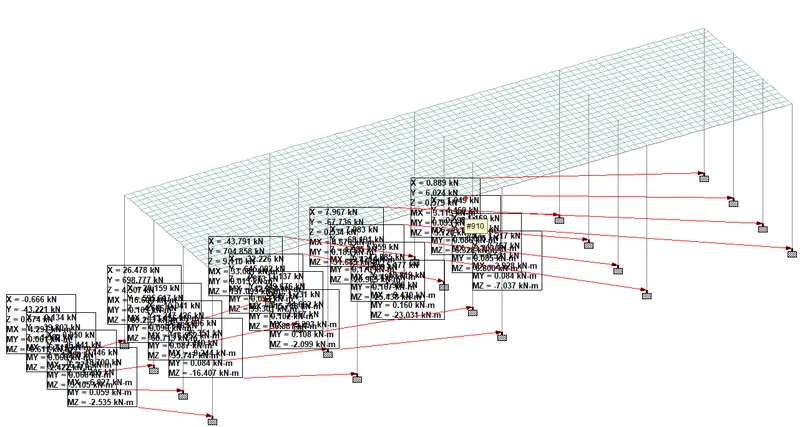
Figure Maximum reaction coming out of all the load cases
4. BEAM RESULTS:- GIRDER
|
Mz (KN-m) |
My (KN-m) | Shear y (KN) | Shear Z (KN) |
| 4599 | 1183 | 1525 | 1947 |
- CROSS BEAM
|
Mz (KN-m) |
My (KN-m) | Shear y (KN) | Shear Z (KN) |
| 4563 | 133.126 | 3805 | 135.220 |
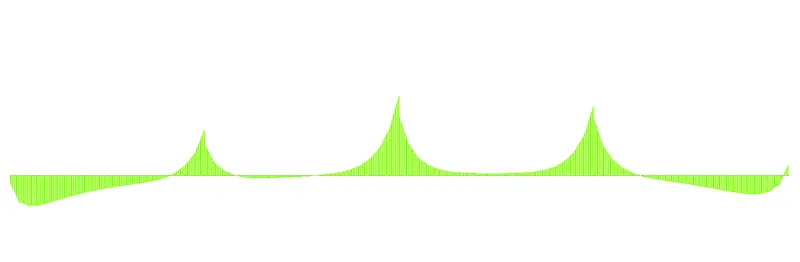
Figure Bending moment diagram of girder
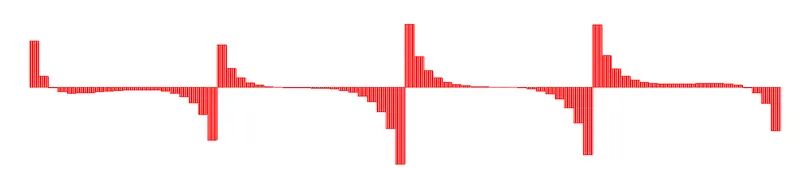
Figure Shear force diagram of girder
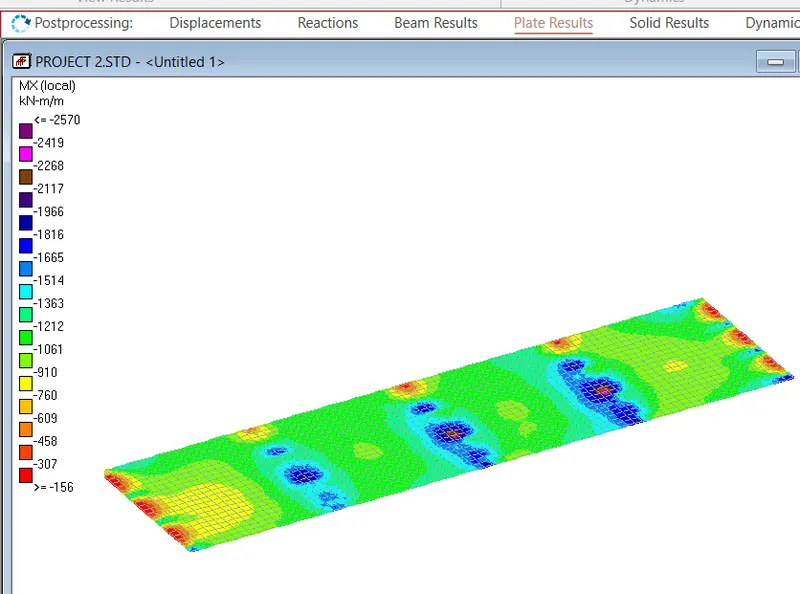
5. PLATE STRESSES
Deck slab
|
Mx (KN-m/m) |
My (KN-m/m) | Mxy (KN-m/m) | Shear X (N/mm2) | Shear Y (N/mm2) |
|
713 |
5854 | 4483 | 2.471 | 1.183 |
6. PIER RESULT
|
Mz (KN-m) |
My (KN-m) | Shear y (KN) | Shear Z (KN) |
| 3044.5 | 13643 | 399 | 4691 |
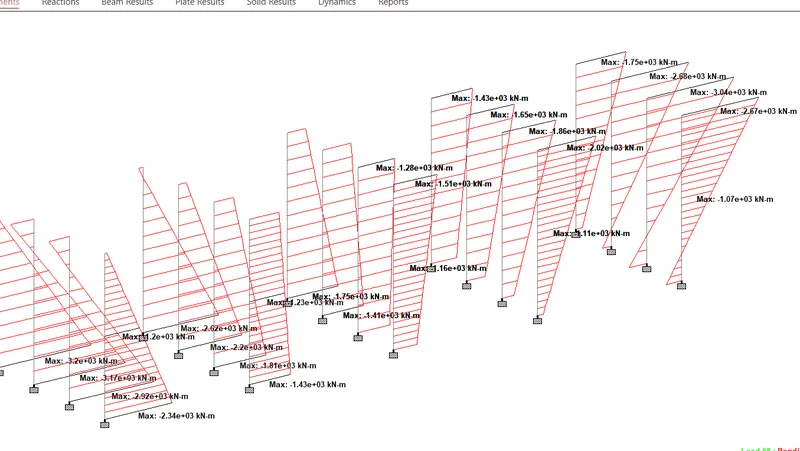
Figure Pier bending moment