Project 2
Project 2.
Implement Clustering and then predict the class of car from “Car dataset”.
Imported the car datase to the jupyter note book .
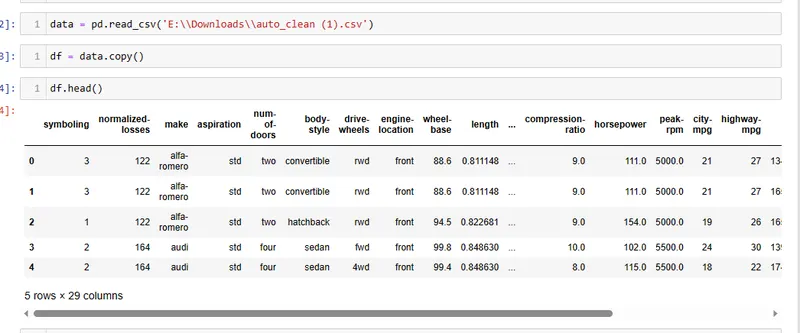
Since the dataset is clean the column names were present and also checked for the missing value by iterating through each feature.
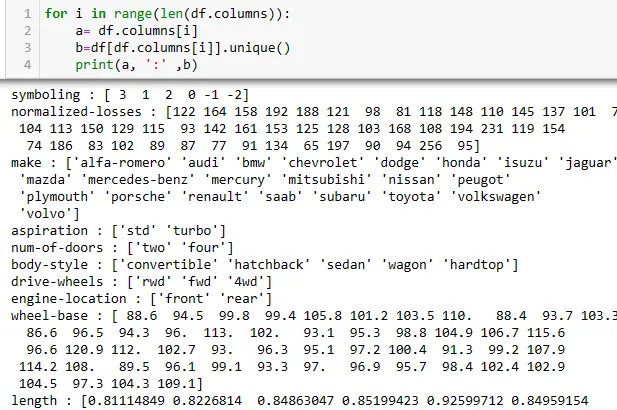
Inspected each and every columns for the missing found out that there in no missing value.
Now we have to check and reiview the dataset.
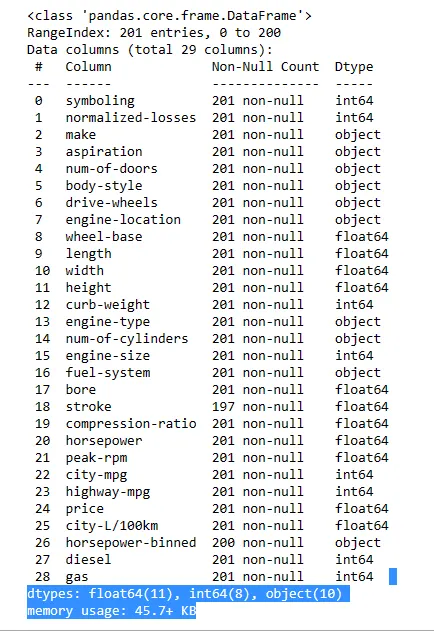
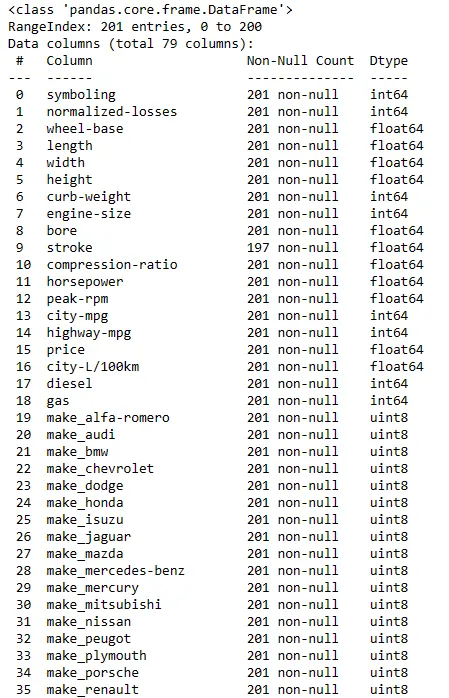
We have 201 records with 29 columns.
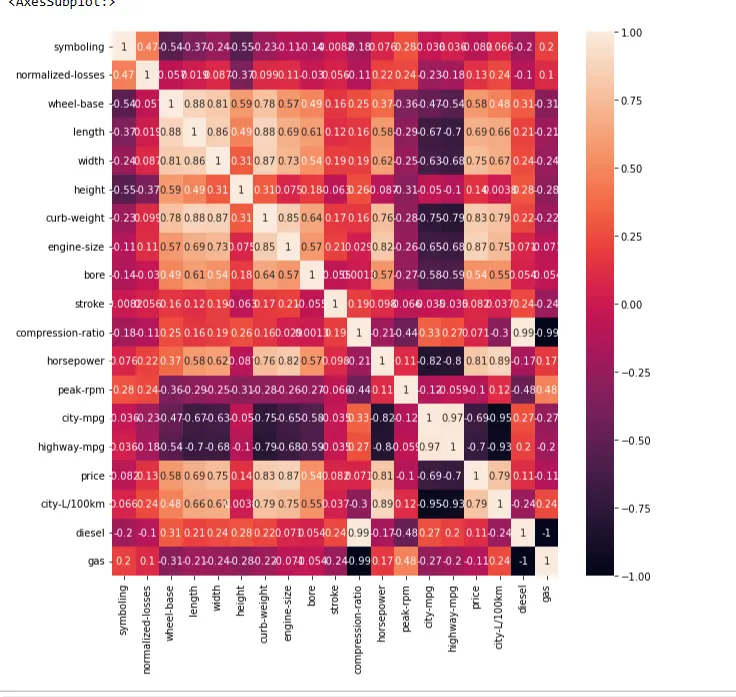
Using heatmap to visualize the correlation between the variables.

Using one hot encoding to convert the object datatype to integer so that it can be fed to algorithm so that the data can be processed.
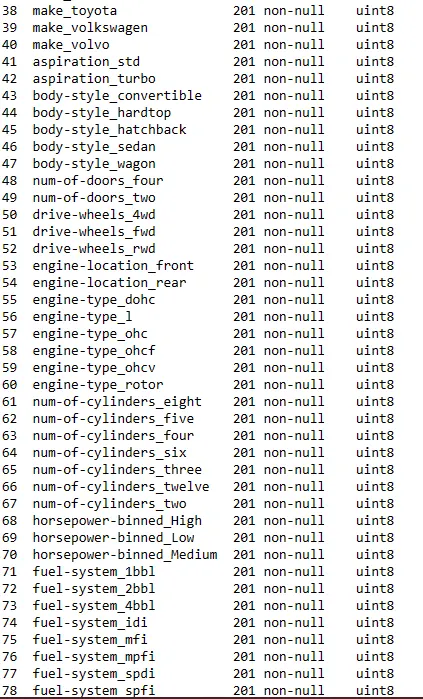
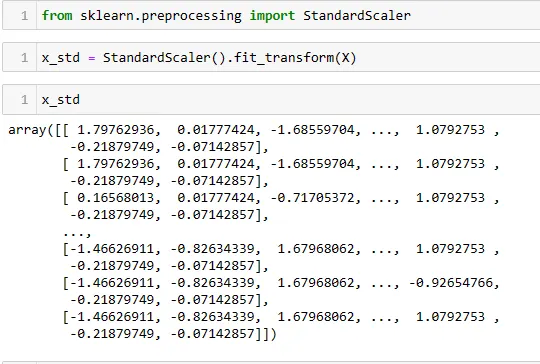
Assign all the values to the variable and converting into standard form using StandardScaler funtion from sklearn.
We are using KMeans algorithm to predict the class of cars
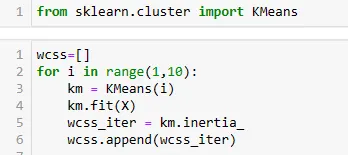
From Sklearn library import Kmeans algorithm , we have to find the k value by using elbow method.
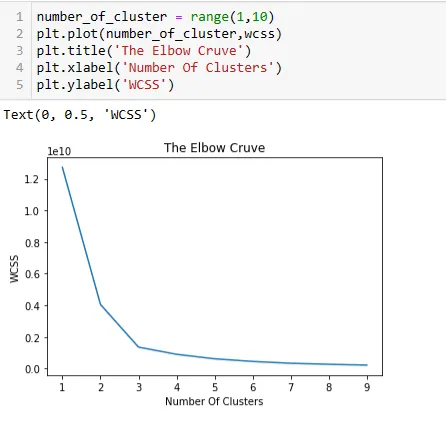
The Elbow method is a technique used to determine the optimal number of clusters in a clustering algorithm, such as K-means. It helps to identify the point of inflection or "elbow" in the plot of the within-cluster sum of squares (WCSS) against the number of clusters.
Here are the steps to implement the Elbow method:
- Choose a range of values for the number of clusters (K).
- For each value of K, perform clustering using the chosen algorithm (e.g., K-means) and compute the WCSS.
- Plot the number of clusters (K) on the x-axis and the corresponding WCSS on the y-axis.
- Examine the resulting plot and look for the "elbow" or a significant decrease in the rate of decrease of WCSS.
- The number of clusters at the elbow point is considered the optimal number of clusters.
The intuition behind the Elbow method is that as the number of clusters increases, the WCSS will generally decrease because each point is assigned to a cluster and the centroids are optimized. However, after a certain number of clusters, the improvement in WCSS becomes less significant, resulting in a less pronounced decrease. The elbow point represents a balance between minimizing the WCSS and avoiding excessive complexity or overfitting.
So from the above curve we consider k =3 where we have an elbow.
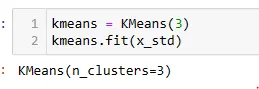
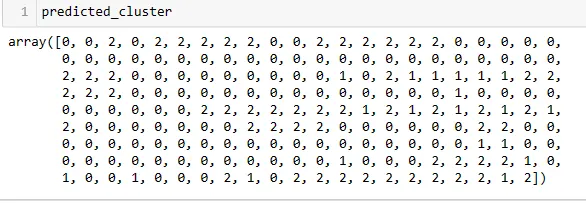
Fitting the value with k=3 for kmeans algorithm and we have the predicted clusters.
Now visualizing the cluster using scatter plot
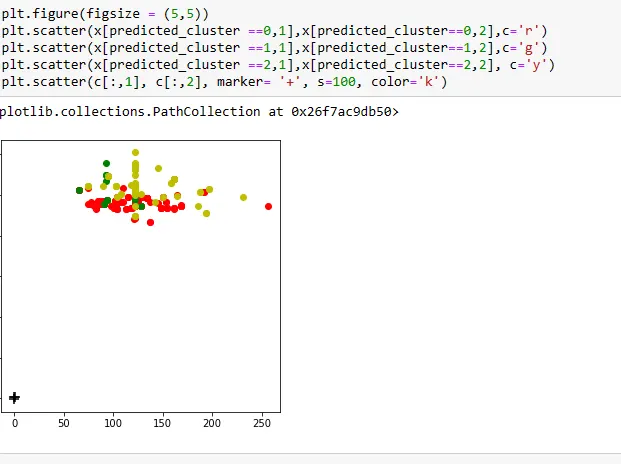
From the above plot we can see that it has been classified into 3 clusterss, so there are 3 classes of cars in this dataset. Attached the ipyb file below.