Project
AIM :-
To study and analysis the BAJA All-Terrain Vehicle (ATV) using Simulink model.
OBJECTIVE :-
To Prepare a technical report explaining the model properties & comments on the results.
THEORY :-
All-Terrain Vehicle:-
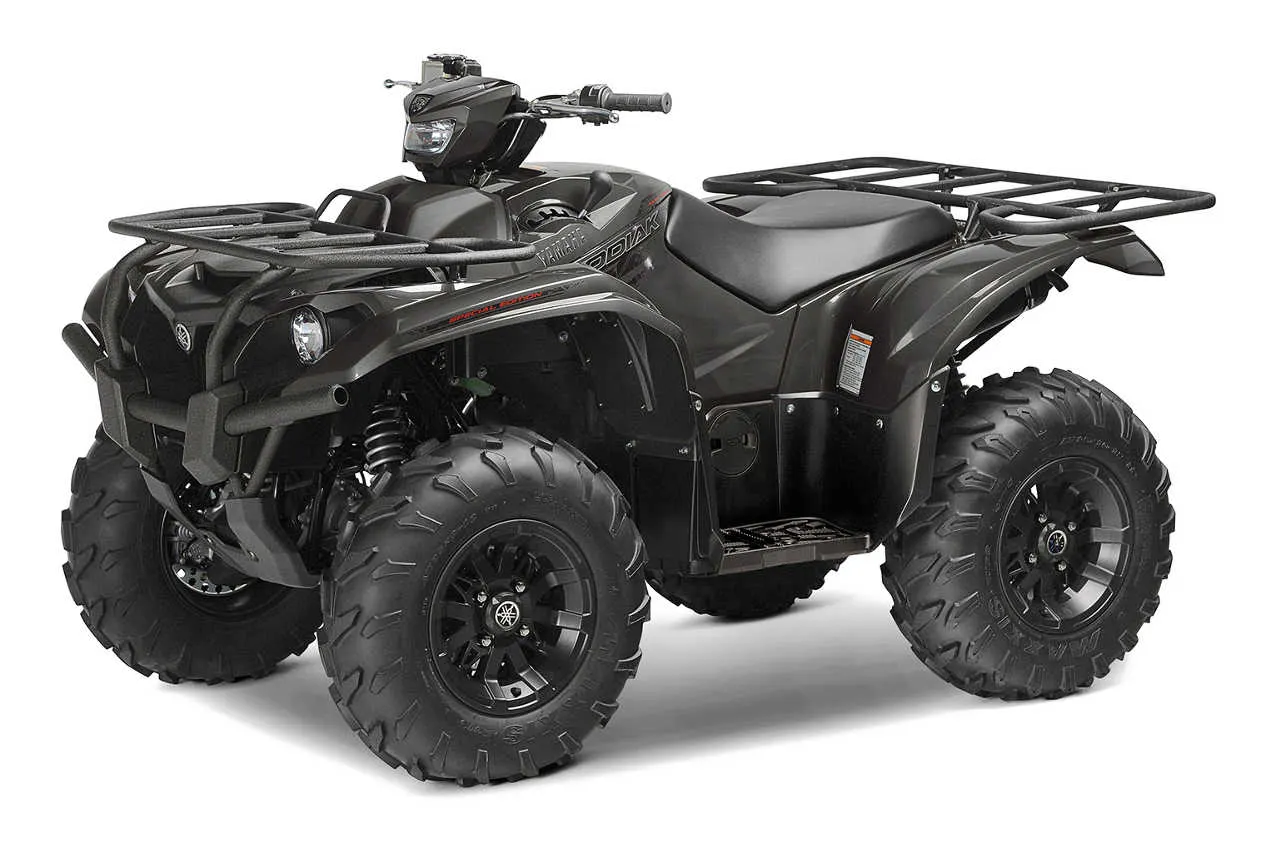
An all-terrain vehicle (ATV), also known as a quad, as defined by the ANSI is a vehicle that travels on low-pressure tires, with a seat that is straddled by the operator, along with handlebars for steering control. As the name implies, it is designed to handle a wider variety of terrain than most other vehicles.Although it is a street legal vehicle in some countries, it is not street-legal within most states, territories, and provinces of Austraila, the United State or Canada.By the current ANSI definition, ATVs are intended for use by a single operator, although some companies have developed ATVs intended for use by the operator and one passenger.
BAJA ATV:-
Baja SAE is an intercollegiate engineering design competition for undergraduate and graduate engineering students. The object of the competition is to simulate real-world engineering design projects and their related challenges. Each team is competing to have its design accepted for manufacture by a fictitious firm. The students must function as a team to design, build, test, promote and compete a vehicle within the limits of the rules, also to generate financial support for their project and manage their educational priorities.
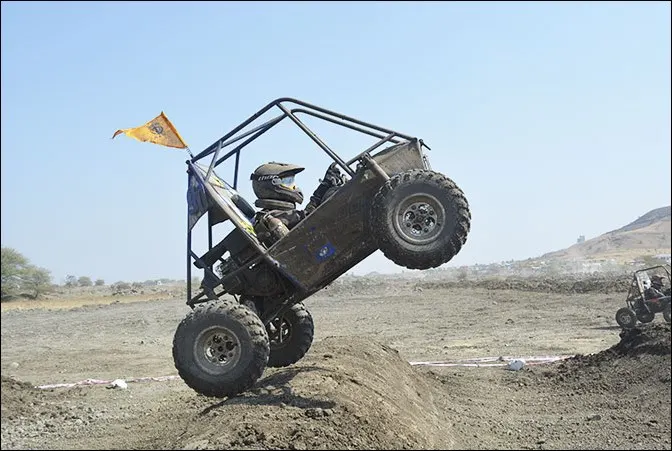
Each team's goal is to design and build a prototype of a rugged, single seat, off-road recreational vehicle intended for sale to the non-professional weekend off-road enthusiast. The vehicle must be safe, easily transported, easily maintained and fun to drive. It should be able to negotiate rough terrain without damage. As of 2010, the SAE Baja Series consisted of three competitions, though in the past there have been as many as seven sanctioned events. A Baja SAE competition event consists of three to four days.
MAJOR COMPONENTS :-
Generic Engine :-
The Generic Engine block represents a general internal combustion (IC) engine which is a type of Spark Ingition (SI-Petrol) or Compression Ignition (CI-Diesel). The speed torque and speed power parameters are provided.
Ports,
- B- Rotational conserving port representing the Engine Block. level.
- F- Rotational conserving port representing the Engine Crankshaft.
- T- Physical signal input port specifying the normalized engine throttle.
- P- Physical signal output port reporting the instantaneous engine power, in W.
- FC-Physical signal output port reporting the fuel consumption rate, in kg/s.
Simple Gear : -
The most common use is in motor vehicles, where the transmission adapts the output of the internal combustion engine to the drive wheels. Such engines need to operate at a relatively high rotational speed, which is inappropriate for starting, stopping, and slower travel. The transmission reduces the higher engine speed to the slower wheel speed, increasing torque in the process. Transmissions are also used on pedal bicycles, fixed machines, and where different rotational speeds and torques are adapted.
- B- Base Gear,F-Follower Gear.
CVT Transmission :
The meaning of the abbreviation CVT is Continuously Variable Transmission, and it's a type of single-speed automatic gearbox. The CVT gearbox has been used in a variety of cars, but you'll usually find it fitted to a small car. Its compact size and simplicity of construction means it's more cost-effective to use in a small car than a conventional automatic gearbox.In many ways a CVT gearbox is similar to a regular auto. For starters, there is no clutch pedal in a CVT-equipped car, so you can drive it on an automatic-only UK driving licence. You'll also find that if a car is offered with a CVT gearbox, it will be more expensive than the same model with a manual gearbox, just like a regular auto. If you compared them back-to-back, the manual model would have better claimed fuel economy, too. But again, that's the same as you'll find with a regular auto ‘box.
- B- Base Pulley
- F- Follower Pulley
- r- Variable Transmission Ratio
Vehicle Body :-
Two-axle vehicle with longitudinal dynamics and motion and adjustable mass,geometry and drag properties. The vehicle can have the same or a different number of wheels on each axle. For example, twowheels on the front axle and one wheel on the rear axle. The vehicle wheels are assumed identical in size. The vehicle can also have a centre of gravity (CG) that is at or below the plane of travel.
- NR- Rear axle normal force
- NF- Front axle normal force
- beta- Road incline angle
- V- Longitudinal velocity
- W- Head wind speed
- H- Horizontal motion
Double Shoe Brake :
The Double-Shoe Brake block represents a frictional brake with two pivoted rigid shoes that press against a rotating drum to produce a braking action. The rigid shoes sit inside or outside the rotating drum in a diametrically opposed configuration. A positive actuating force causes the rigid shoes to press against the rotating drum. Viscous and contact friction between the drum and the rigid shoe surfaces cause the rotating drum to decelerate.
- S- Rotational conserving port associated with the rotating drum shaft
- F- Physical signal input port associated with the applied actuating force
Tire :
The Vehicle body is connected to 4 tires each per axle to move the vehicle according to the power input to the axle.
- N- Normal force
- S- Tire Slip
- A- Axle
- H- Mechanical translational port
TYPES OF MODEL :-
- BAJA ATV model without Dashboard
- BAJA ATV model with Dashboard
- BAJA ATV model Lookup table data Extraction
- BAJA AV model Mapped Lookup table without Dashboard
- BAJA AV model Mapped Lookup table with Dashboard.
#1 BAJA ATV MODEL WITHOUT DASHBOARD
MAIN MODEL :-
ENGINE SENSOR :-
CVT SYSTEM :-
VEHICLE BODY :-
FLOW PROCESS :-
- The throttle signal is generated by signal builder block and inputted to generic engine.
- The torque and speed vector are inputted from the MATLAB workspace.
- The engine will generate the output rpm which can be taken from the crankshaft output. This speed will be given to the Ideal Rotational Motion Sensor to sense the output rpm.
- The same output speed will be given to a simple gear mechanism to reduce the speed where the Gear Ratio is ‘4’.
- Then the output speed from the gear reducer will be given to the Variable Ratio Transmission block (CVT).
- The CVT ratio is provided to the Variable Ratio Transmission (CVT) block through Signal Builder.
- The speed is controlled by the variable CVT ratios and the controlled output speed is inputted to the vehicle axle.
- The brake signal is generated by the signal builder and inputted to the vehicle body (Double Shoe Brake) for applying the brake to axle.
- The power from the CVT is inputted to the axle and the vehicle accelerates according to the speed.
- Then the Velocity is taken as output from the vehicle body for further analysis.
RESULTS :-
TORQUE-SPEED PLOT :-
The torque and speed are inputted from the MATLAB workspace window to the generic engine block to generate the output RPM accordingly. This plot is common for all the cases because it’s a default input to the engine.
ENGINE SPEED PLOT :-
Here we can see the engine rpm generated accordingly w.r.t to the throttle, speed and torque inputs.
ENGINE SPEED vs GEAR REDUCTION SPEED PLOT :
Here we can see that the engine speed is reduced by the Gear Ratio ‘4’. For verification I calculated the maximum RPM,
Maximum RPM (Before Reducing) = 3833 rpm
Gear Ratio = 1:4
WKT,
GearRatio=Driven/Driver
1/4=Driven/3833
Driven=3833/4
Driven=958.25RPM
The reduced maximum rpm is 958.25 rpm which can be verified from the plot.
CVT SPEED REDUCTION PLOT:-
The engine reduced speed is controlled by various CVT Ratios. For verification I had calculated the maximum RPM,
Maximum RPM (Before Reducing) = 958.25 rpm
CVT Ratio = 1:1.8
WKT,
GearRatio=Driven/Driver
1/1.8=Driven/958.25
Driven=958.25/1.8
Driven=532.36RPM
The reduced maximum rpm is 532.36 rpm which can be verified from the plot.
SPEED vs THROTTLE PLOT :-
From the graph we can infer that the brake is not applied during the drive cycle and the Throttle is constant (0.3) till 20 sec and being increased from 0.3 to 1 from 20 sec where it remains constant throughout. With increase in throttle the vehicle speed also increases.
ACCELERATION PLOT :-
From the above plot we can infer that the vehicle is accelerated from 0-20 Kmph and then gradually increases then it’s accelerated to 55.74 Kmph where it remains constant throughout the cycle.
#2 BAJA ATV MODEL WITH DASHBOARD
MAIN MODEL :-
DASHBOARD :-
FLOW PROCESS :-
The model workflow process is same as the process of ‘BAJA ATV model without Dashboard’ but the Throttle and Brake inputs are controlled by the user with the Knob.
RESULTS :-
ENGINE SPEED PLOT :-
Here the engine speed is generated according to the inputs like throttle, break, torque and speed vectors. The runtime is not defined so that the Throttle and Break are controlled by the user. The step up is throttle and step down are break inputs.
ENGINE SPEED vs GEAR REDUCTION SPEED PLOT :-
Here we can see that the engine speed is reduced by the Gear Ratio ‘4’. For verification I calculated the constant RPM (42000-50000 sec),
Maximum RPM (Before Reducing) = 2759.3 rpm
Gear Ratio = 1:4
WKT,
GearRatio=Driven/Driver
1/4=Driven/2759.3
Driven=2759.3/4
Driven=689.825RPM
The reduced constant rpm is 689.825 rpm which can be verified from the plot.
CVT SPEED REDUCTION PLOT :-
The engine reduced speed is controlled by various CVT Ratios. For verification I had calculated the constant RPM (42000-50000 sec),
Maximum RPM (Before Reducing) = 689.825 rpm
CVT Ratio = 1:1.8
WKT,
GearRatio=Driven/Driver
1/1.8=Driven/689.825
Driven=689.825/1.8
Driven=383.23RPM
The reduced maximum rpm is 383.23 rpm which can be verified from the plot.
SPEED vs THROTTLE PLOT :-
From the graph we can infer that the vehicle is accelerating while throttle is applied (Step Up) and decelerated while break is applied (Step Down).
ACCELERATION PLOT :-
From the graph we can infer that the vehicle is accelerated to 46 Kmph initially and then the state changes when the user controls the throttle and brake knobs. The step-up and step-down are acceleration and deceleration respectively. The linear one is the constant speed so no changes in throttle or braking.
#3 BAJA ATV MODEL - LOOKUP TABLE DATA EXTRACTION
SIMULINK MODEL :-
FLOW PROCESS :-
The model workflow process is same as the process of ‘BAJA ATV model without Dashboard’. The small addition is here the CVT Ratio and Vehicle Speed data are extracted using ‘To Workspace’ block.
RESULTS :-
The results are same as ‘BAJA ATV model without Dashboard’ but an additional output is the CVT Ratio and Vehicle Velocity to the Workspace.
WORKSPACE - BEFORE WORKSPACE-AFTER
They both are exported to the workspace,
The exported data are then considered for further analysis.
#4 BAJA ATV MODEL – MAPPED LOOKUP TABLE WITHOUT DASHBOARD
MAIN MODEL :-
CVT SYSTEM :-
FLOW PROCESS :-
- The model workflow process is same as the process of ‘BAJA ATV model without Dashboard’.
- Instead of Signal Builder Blocks for Brake and Throttle Input the Step blocks are used. At 35 sec the brake input will take a step of value ‘0’ and at 20 sec throttle input will increases from 0.3-1 then remains constant throughout.
- And instead of Signal Builder Block for CVT Ratio the 2-D Lookup Table is used. The interpolations and extrapolation methods are set to linear.
- iv.At last the vehicle speed output is given as feedback to the 2-D Lookup Table so that we can verify that the velocity of the vehicle is changing perfectly when the CVT Ratio changes. The vehicle speed is converted to m/s from Kmph.
RESULTS :-
CVT RATIO PLOT :-
When we compare the above plot, the ratio varies from 2.3 – 1.8 within timespan of 80 sec which is same as the previous BAJA ATV Models. And from 32 sec it’s constant ratio of ‘1.8’.
CVT RATIO vs VEHICLE VELOCITY :-
Here the CVT Ratio changes from 2.3 – 1.8 and the velocity value also changes w.r.t to the CVT Ratio. Hence, we can conclude that the vehicle accelerates, decelerates and remains constant when the CVT Ratio is being varied. And also, the vehicle attains the constant speed of 55.441m/s.
#5 BAJA ATV MODEL – MAPPED LOOKUP TABLE WITH DASHBOARD
SIMULINK MODEL :-
DASHBOARD MODEL (SIMULATION OFF)
DASHBOARD MODEL (SIMULATION ON) :
FLOW PROCESS :-
The model workflow process is same as the process of ‘BAJA ATV model – mapped lookup table without Dashboard’ but the Throttle and Brake inputs are controlled by the user with the Knob followed by the vehicle speed is given as feedback to the CVT Ratio lookup table.
RELATIONSHIP OF CVT RATIO, THROTTLE AND BRAKE INPUTS :-
The relationship with Throttling, Braking and Change in CVT Ratio respectively is,
In this BAJA ATV Model, the Engine is pre-set to run at 3300 rpm with the throttle value of ‘0.3’. And the velocity at 45 m/s. The CVT Ratio for minimum and maximum speed of the engine was pre-defined as 2.3 and 1.8 respectively. When the simulation is started the initial throttle value 0.3 is achieved so that the CVT Ratio is nearby to 1.85. When the throttle is being increased the CVT Ratio move towards 1.8 where the state is maximum engine speed. Simultaneously when the throttle is decreasing the CVT ratio will move towards 1.85. While the braking is applied the CVT Ratio increases so that it can achieve the nearest state of 2.3 (Minimum Engine Speed). When braking is reduced the CVT Ratio move towards 1.85 which is the basic throttle input 0.3 or if any other throttle value is applied it would reach that CVT Ratio state.
CVT RATIO PLOT :-
RESULTS :-
ENGINE SPEED PLOT :-
From the graph we can infer that the vehicle was first running at minimum rpm of 3300 rpm and then throttle is applied (step-up) then braking (step-down) then brake is released so that engine rpm is increased then braking is applied. Finally throttle and brake are put to constant of 2900 rpm.
CVT SPEED PLOT :-
From the above graph we can understand that the throttle is applied (step-up) and then kept constant then braking is applied (step-down) then brake is released so that the engine speed is increased with increase in throttle input.
INPUT vs VEHICLE SPEED :-
From the plot we can infer that when throttle is applied the vehicle speed increases and when brake is applied vehicle speed decreases simultaneously.
SIMULINK MODEL :-
https://in.mathworks.com/