Week 4.1 - Genetic Algorithm
Aim:-
To write the code to calculate the global maxima of the stalagmite function and to explain the syntax for genetic algoritham(ga) in MATLAB.
OBJECTIVE:-
- To write a code in MATLAB to optimize the stalagmite function and find global maxima of the function.
- To explain the concept of genetic algoritham and the syntax for ga in MATLAB.
- To plot the graph of all three studies and also for global maxima.
Genetic Algoritham(ga):-
A genetic algoritham is an algoritham that imitates the process of natural selection.They help solve optimisation and search problems.Genetic algoritham are part of the bigger classof evolutionary algorithams.Genetec algoritham imitates natural biological process such as inheritance , mutation , selection and crossover.The concept of algoritham is a search technique often used compute science to find complex non-obvious solution to algorithamic optimisation and search problems.
MATHEMATICAL EQUATION:-
To find global maxima
`f = ( f 1 ⋅ f 2 ⋅ f 3 ⋅ f 4 )`
To find global minima
`f = − ( f 1 ⋅ f 2 ⋅ f 3 ⋅ f 4 )`
where
`f 1 = [ sin ( 5.1 π x + 0.5 ) ] 6`
`f 2 = [ sin ( 5.1 π y + 0.5 ) ] 6`
`f 3 = exp [ − 4 log ( 2 ) ( x − 0.0667 ) ^2 /0.64 ]`
`f 4 = exp [ − 4 log ( 2 ) ( ( y − 0.0667 ) ^2 /0.64 ) ]`
here x and y are two variables
Program:-
For plotting global maxima
clear all
close all
clc

%Defining our search space to be optimized

%one dimesional

x = linspace(0,0.6,150);
y = linspace(0,0.6,150);

%creating 2dimiensional grid
[xx, yy] = meshgrid(x,y);

% evaluating the stalagmite function

for i = 1:length(xx)
    for j = 1:length(yy)
        input_vector(1)= xx(i,j);
        input_vector(2)= yy(i,j);
        f(i,j) = stalagmite(input_vector);
    end

end

surf(xx, yy, -f)
shading interp

xlabel('x value')
ylabel('y value')
[x_output ,fval] = ga(@stalagmite,2);
Function:-
function [f]=stalagmite(input_vector)

x=input_vector(1);
y=input_vector(2);
f1=(sin(5.1*pi*x+0.5))^6;
f2=(sin(5.1*pi*y+0.5))^6;
f3=exp(-4*log(2)*(x-0.0667)^2/0.64);
f4=exp(-4*log(2)*(y-0.0667)^2/0.64);

f=-(f1*f2*f3*f4);
end
Plot for global maxima:-
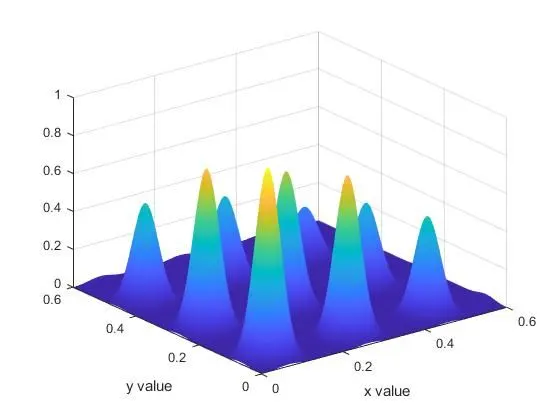
Plotting global minima and finding the minima of the function ga is used
clear all
close all
clc


x=linspace(0,0.6,150)
y=linspace(0,0.6,150)

[xx,yy]=meshgrid(x,y)

num_cases=50
% evaluating the stalagmite function

for i = 1:length(xx)
    for j = 1:length(yy)
        input_vector(1)= xx(i,j);
        input_vector(2)= yy(i,j);
        f(i,j) = stalagmite(input_vector);
    end

end


tic

%study 1 - statistical behavior
for i=1:num_cases
    [inputs,fopt(i)]=ga(@stalagmite,2)
    xopt(i)=inputs(1)
    yopt(i)=inputs(2)
end

study1_time=toc

%plotting1
figure(1)
subplot(2,1,1)
hold on
surfc(x,y,f)
shading interp
plot3(xopt,yopt,fopt,'marker','o','markersize',5,'markerfacecolor','g')
title('Unbounded inputs')
subplot(2,1,2)
plot(fopt)
xlabel('Iterations')
ylabel('function maximum')

tic

%study 2 -statistical behaviour

for i=1:num_cases
 [inputs,fopt(i)]=ga(@stalagmite,2,[],[],[],[],[0;0],[0.4;0.4])
    xopt(i)=inputs(1)
    yopt(i)=inputs(2)
end

study2_time=toc

%plotting2

figure(2)

subplot(2,1,1)
hold on
surfc(x,y,f)
shading interp
plot3(xopt,yopt,fopt,'marker','o','markersize',3,'markerfacecolor','g')
title('Bounded inputs')
subplot(2,1,2)
plot(fopt)
xlabel('Iterations')
ylabel('function maximum')

%increrasing ga iteration
options=optimoptions('ga')
options=optimoptions(options,'populationsize',170)

tic

for i=1:num_cases
 [inputs,fopt(i)]=ga(@stalagmite,2,[],[],[],[],[0;0],[0.4;0.4],[],[],options)
    xopt(i)=inputs(1)
    yopt(i)=inputs(2)
end

study3_time=toc

%plotting3

figure(3)
subplot(2,1,1)
hold on
surfc(x,y,f)
shading interp
plot3(xopt,yopt,fopt,'marker','o','markersize',5,'markerfacecolor','g')
title('Bounded inputs')
subplot(2,1,2)
plot(fopt)
xlabel('Iterations')
ylabel('function maximum')
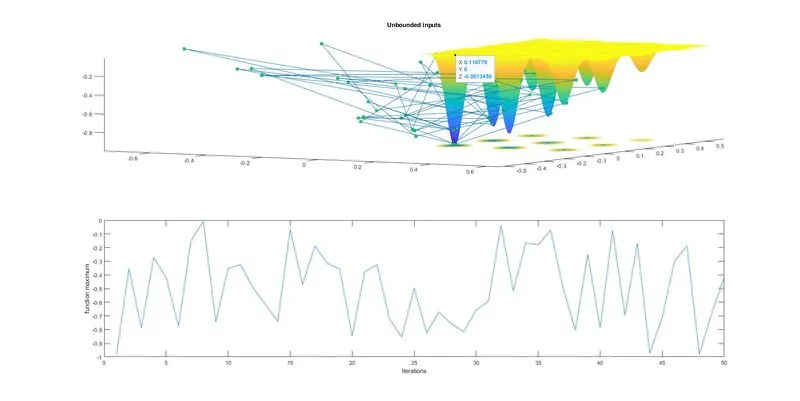
For finding minimum function by ga :-
study-1
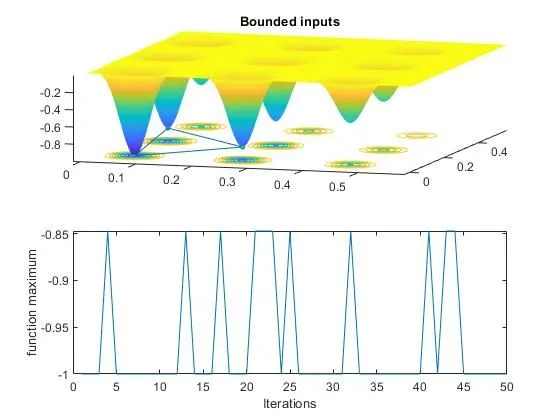
study-2
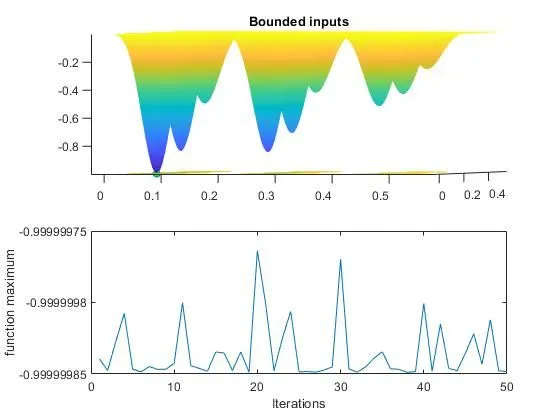
study-3
RESULT:-
- The code for global maxima and stalagmite function is done.
- the concept of genetic algoritham and the syntax is done.
- The graph for all three studies and global maxima are plotted.