Project
Project :-system-level simulation of an all-terrain vehicle
Aim: To Study and make report on Simulation of BAJA All-Terrain Vehicle (ATV) under different state conditions.
Objectives: To Study system-level simulation of an all-terrain vehicle and make the technical report which describing the model properties &explanation about the results.
All terrain vehicle (ATV):-
IT is also known as a light utility vehicle (LUV).It is a vehicle that travels on low-pressure tires.Which specially designed for riding off highway road conditions .where the driver having only one seat and all handled bar controlled by driver.
figure.1
Study 1):-SIMULINK MODEL FOR BAJA ATV WITH CVT MODEL:-
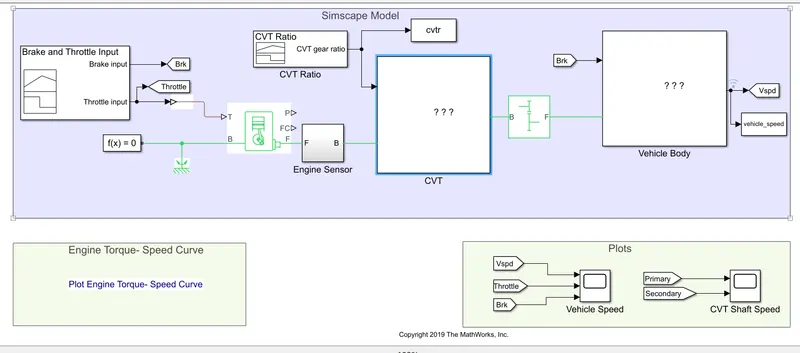
figure.2
- Subsystem 1
Continuously Variable Transmission drive (CVT)
A continuously variable transmission (CVT) is an Automatic transmission that can change seamlessly through a continuous range of gear ratios .The flexibility of a CVT with suitable control may allow the engine to operate at a constant RPM while the vehicle moves at varying speeds.
IN traditional transmission uses a wide variety of intricate parts to shift between a range of preset gears, most CVT systems work through a pulley system. In short, this system consists of cones at each pulley connected via a chain or belt. The cones can move to increase or decrease the belt diameter to change gear ratios, allow for quick shifting into the needed ratio for increased power, and boost fuel economy.
One pulley in the CVT is connected to the engine and the other directs power to the wheels. The width of these pulleys changes based on the needed power; as one gets larger, the other gets smaller. This allows a CVT to deliver strong and seamless acceleration
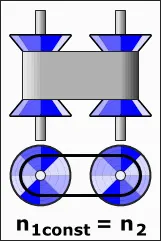
figure.3
CVT Block:- Block represent the variable gear ratio by means of mechanical cvt belts and electric and hydraulic transmission .signals inpur r is defined as i/p ,o/p angular velocities.Connections B (base) and F (follower) are mechanical rotational conserving ports. Specify the relation between base and follower rotation directions with the Output shaft rotates parameter
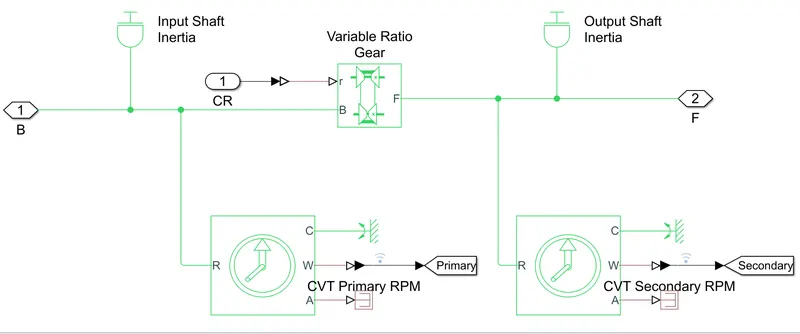
figure.4
Generic engine :- Block represents the system-level model of spark-ignition and diesel engines suitable for use at initial stages of modelling when only the basic parameters are available.
where ,
- T = Throttle input lies between (0 to 1)
- B & F = Base and follwer conserving ports associated with the engine crankshaft and engine block resp.
- P & FC =engine power and fuel consumption rate are reported
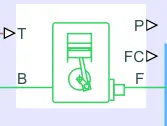
figure.5
Input signals :-
Signal builder :-used to crate the i\p of brake and throttle input values.
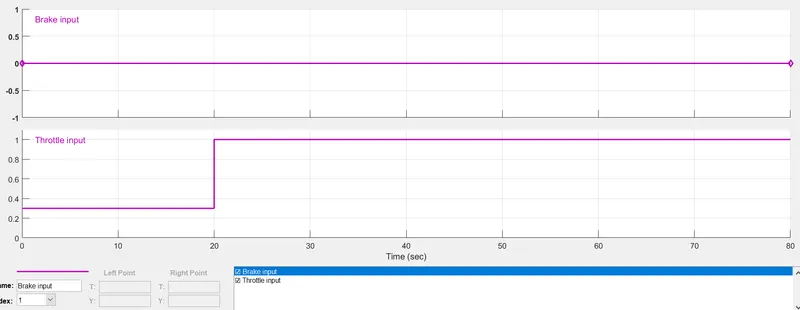
figure.6
CVT gear ratios input :-
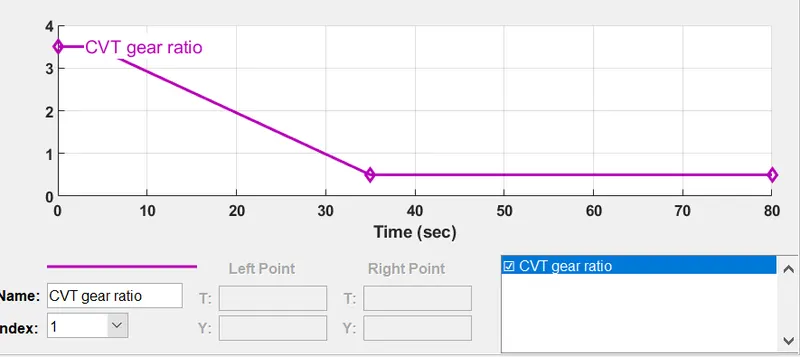
figure.7
Input Engine torque and speed curve values chart :-
3.Subsystem 3):-
Vehicle body Block:-
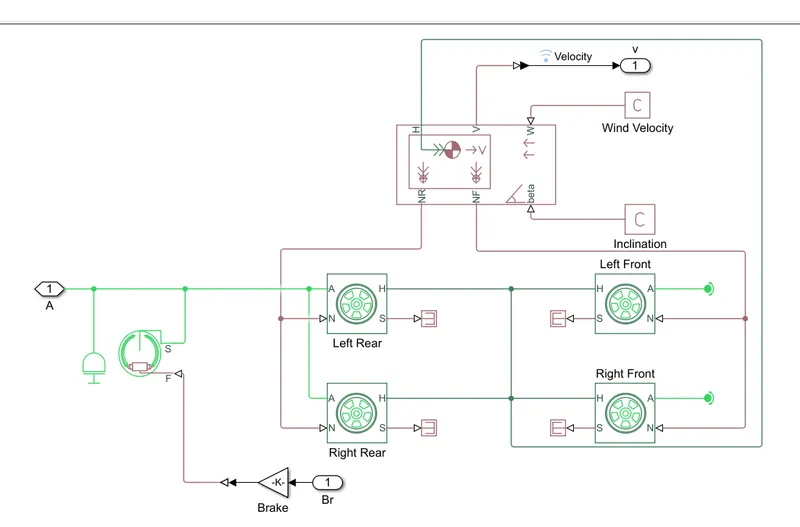
figure.8
Output for study 1:-
From the graph it is clear that velocity increaes as throttle increases. and brake values at constant. The flow of fuel is increses when the throttle increases from 0.3 to 1, thus the power in the engine increases. from above results it is get that gear ratio is dirctly prapotional to the torque values. from this gear ratios speed and velocity achieved maximum.
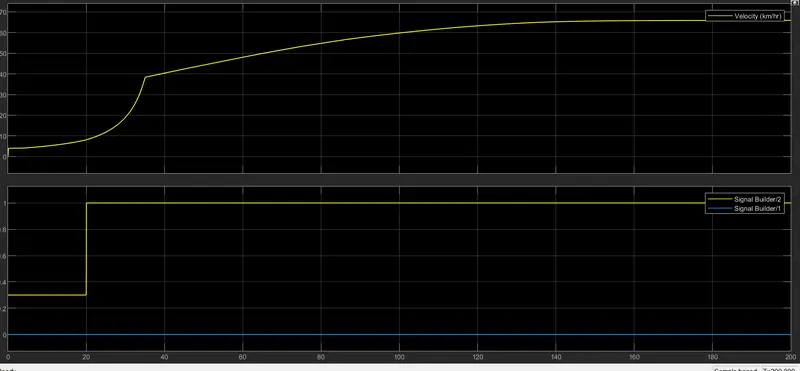
figure.9
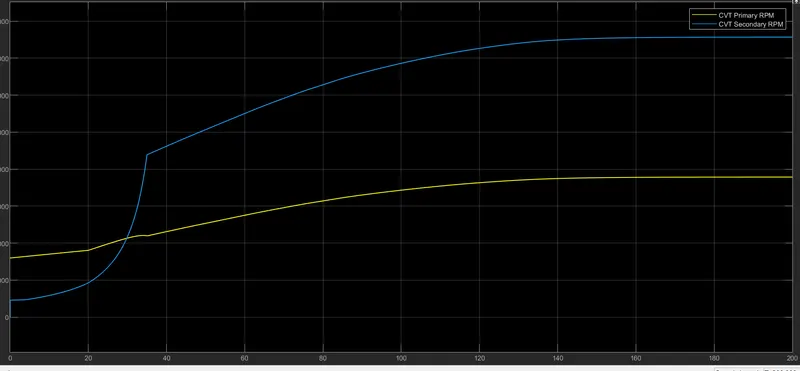
figure.10
From above fig it is clear that primary shaft speed is higher than secondary shaft rpm. Due to the radius of the primary shaft as more than the secondary shaft, the speed is directly proportional to the radius of the shaft. As the radius increases the speed of the shaft also increases
Study :-2
SIMULINK MODEL FOR BAJA ATV WITH CVT USING DASHBOARD:-
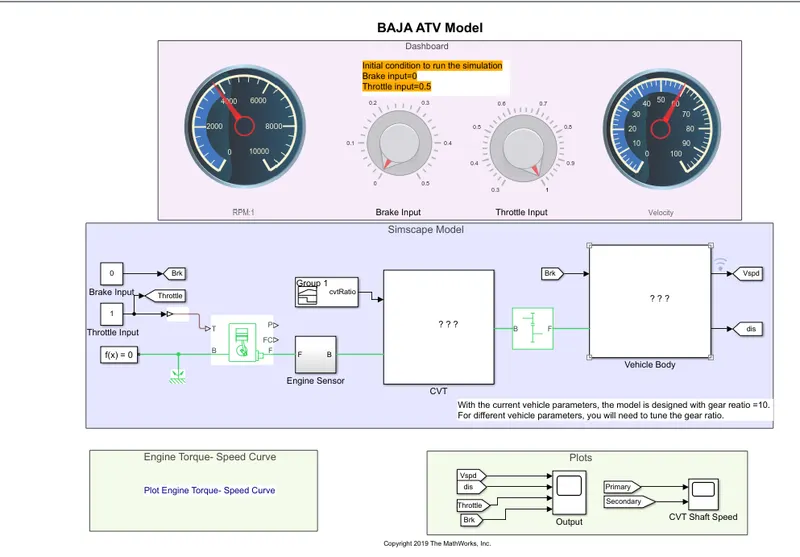
figure.11
In this study we have a dashboard which contains knobs to control the inputs. In this case, the inputs- ‘Throttle’ & ‘Brake’ are not provided using signal builde instead of that here used as knob is provided to control both the parameters in real-time for the user.
Output study 2):-
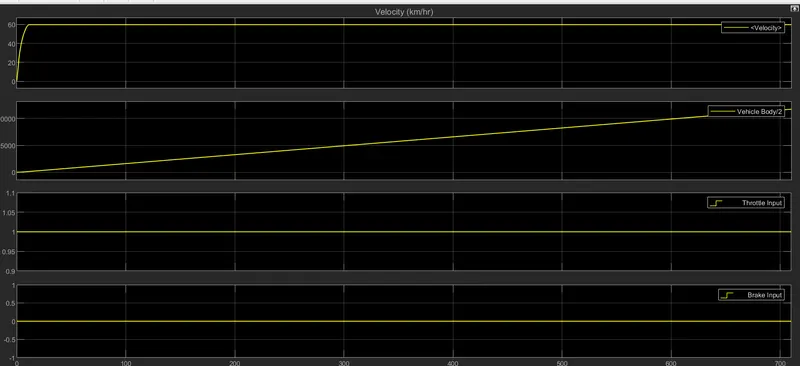
figure.12
From this graph it is clear that velocity of vehicle increases as we increases the throttle input. And when the braking values increases from 0 to 0.1 then velocity of vehicle decreses to 0 . so its clear that they have direct relation with throttle and brake input values.
Cvt shaft RPM values graph as ,
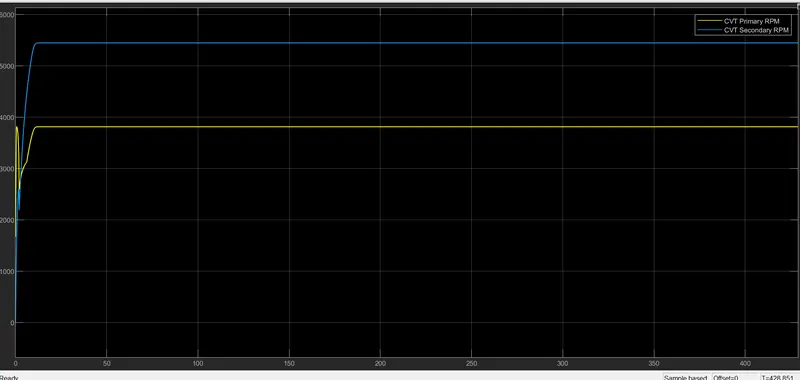
figure.13
Study 3:-
SIMULINK MODEL FOR BAJA ATV WITH CVT USING LOOKUP TABLE:-
Only difference in this model is that gear ratio input to CVT is given by look up table .The vehicle velocity and shaft RPM outputs is reamain same.
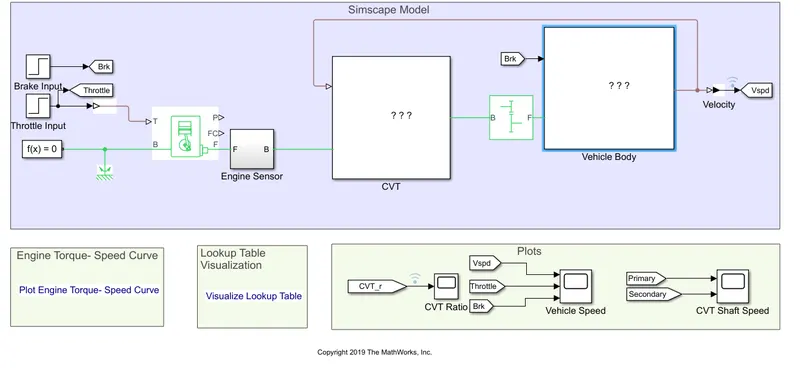
figure.14
CVT subsystem
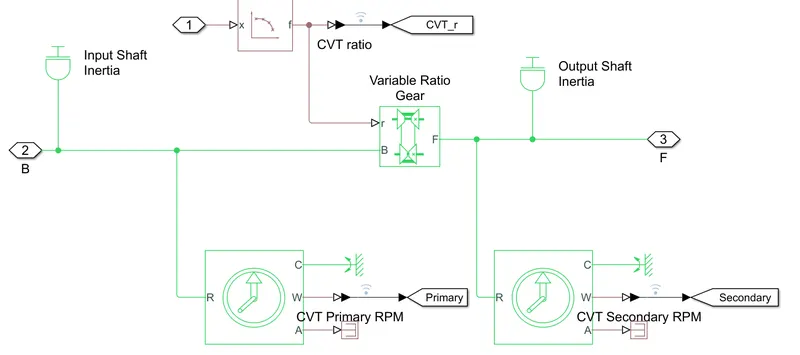
figure.15
Study 3) Output :-
figure.16 figure.16.1
Results as same as above 1st case study(SIMULINK MODEL FOR BAJA ATV WITH CVT) .as input in both the cases same.
Study :-4
SIMULINK MODEL FOR BAJA ATV WITH CVT USING LOOKUP TABLE & DASHBOARD:
In this type of model dashboard is used to control the brake and throttle input.
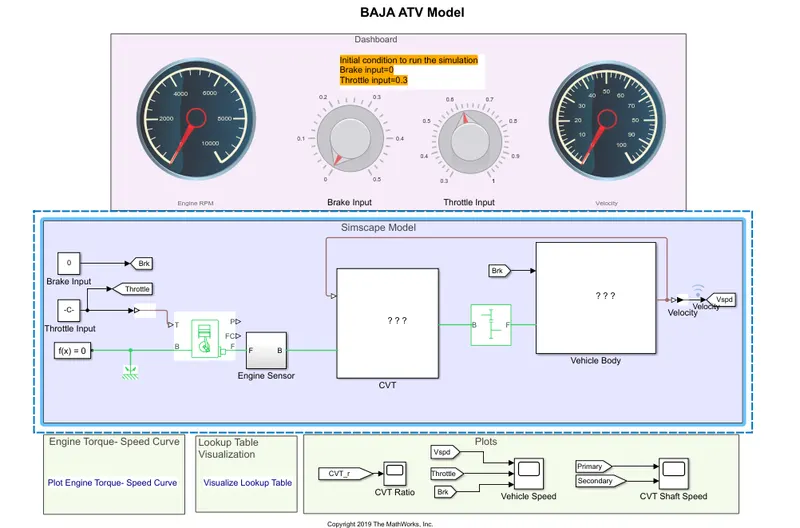
figure.16
Ouput :-
figure.17
Results as same as in case of dashboard model . As the variation of vehicle velocity is observed as change in brake and throttle input.With increasing braking values speed decreases ans vice versa.
Conclusion:- We studied and analysed the four different cases of MODEL FOR BAJA ATV WITH CVT . and recorded the output graphs and results of velocity and shaft RPM .as there is variation according throttle and brake input values.