%% Skill-Lync -> Hybrid Drives Development
% Project 1 - Conventional Vehicle Model
% By - Ullekh Gambhira
% Description:
% The following file is to used with the Initialization file and Simulink
% results for post-processing of the data.
% The file is incomplete, has some examples of how the data is imported
% into a readable format, data analysis and plotting examples.
% Based on the project task, use commands in a similar format as given
% below, to analyse the data and generate required plots.
% You can change variable names if desired
%% Post-Processing File
% File for post-processing the Conventional vehicle simulation model data
%% Renaming variables
Time = out.tout;
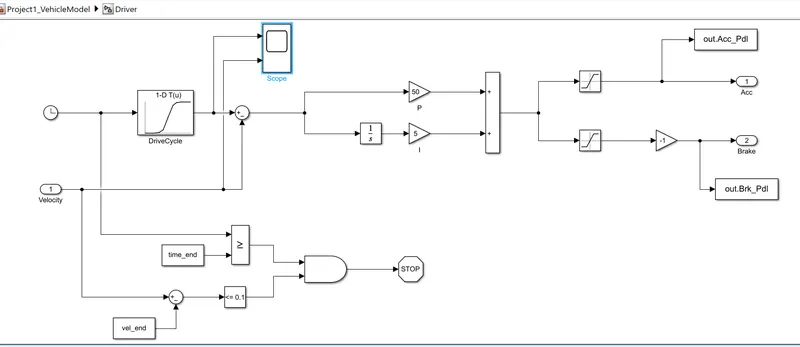
Acc_Pdl = out.Acc_Pdl; % Accelerator pedal [%]
Brk_Pdl = out.Brk_Pdl; % Brake pedal [%]
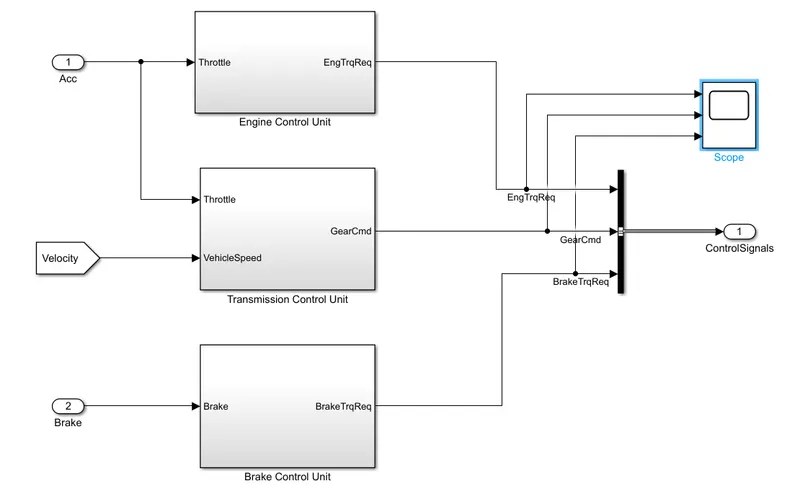
Gear_Cmd = out.Gear_Cmd; % Transmission gear
Trans_In_Spd = out.Trans_In_Spd*30/pi; % Transmission input speed [rpm]
Trans_Out_Spd = out.Trans_Out_Spd*30/pi;% Transmission output speed [rpm]
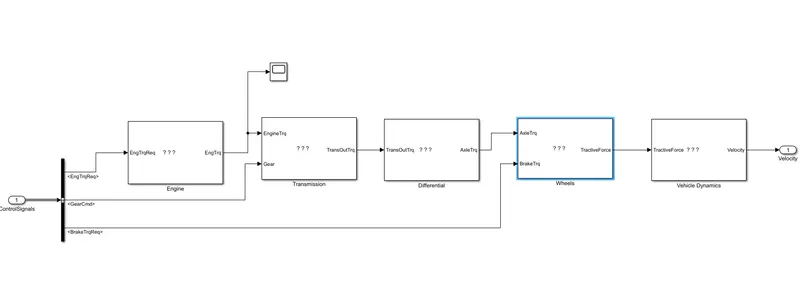
Eng_Trq = out.Eng_Trq; % Engine brake torque [Nm]
Eng_spd = out.Eng_spd*30/pi; % Engine speed [rpm]
Eng_Fuel_Consump = out.Eng_Fuel_Consumption; % Engine fuel consumption [g]
Veh_Dist = out.Veh_Dist/1000; % Distance traveled by vehicle [km]
Veh_Spd = out.Veh_Spd*18/5; % Vehicle speed [kmph]
%% Data Analysis
Eng_Pwr = Eng_spd*pi/30*Eng_Trq/1000; % Engine brake power [kW]
rho_petrol = 0.7197; % Density of petrol [kg/L]
kmpl = Veh_Dist(end)/(Eng_Fuel_Consump(end)/1000/rho_petrol); % Fuel economy [kmpl]
%% Plotting vehicle characteristics time trace
figure()
subplot(3,1,1)
hold on
grid on
plot(Time, Acc_Pdl, 'linewidth', 1, 'Color', 'black');
plot(Time, Brk_Pdl, 'linewidth', 1, 'Color', 'red');
ylabel('Pedal [%]')
xlim([0, Time(end)]);
legend('Accel','Brake');
subplot(3,1,2)
hold on
grid on
plot(Time, Trans_In_Spd, 'linewidth', 1, 'Color', 'black');
plot(Time, Trans_Out_Spd, 'linewidth', 1, 'Color', 'red');
ylabel('Speed [rpm]')
xlim([0, Time(end)]);
ylim([0, 6000]);
legend('Trans Input','Trans Output');
subplot(3,1,3)
hold on
grid on
plot(Time, Gear_Cmd, 'linewidth', 1, 'Color', 'black');
xlim([0, Time(end)]);
xlabel('Time [s]');
ylabel('Gear');
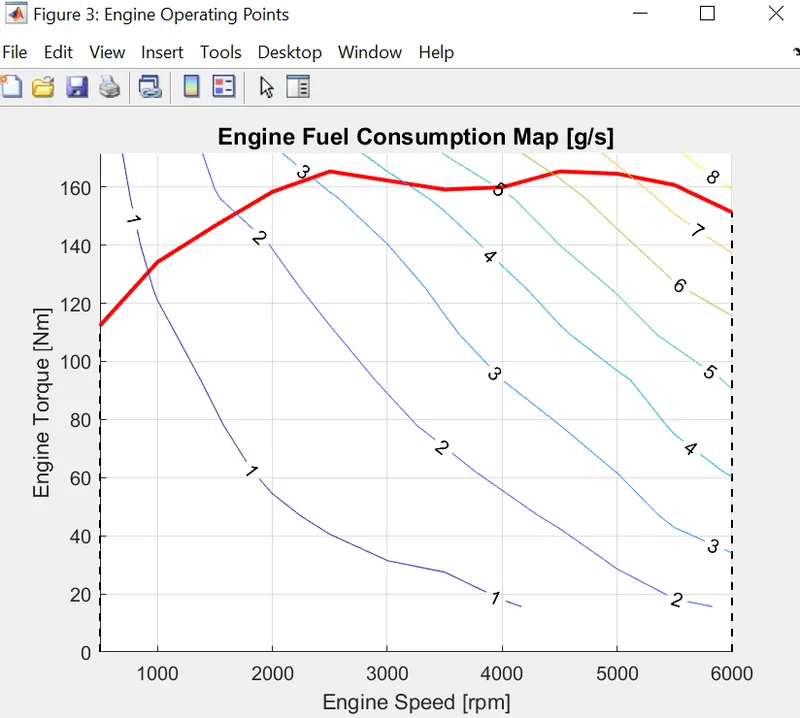
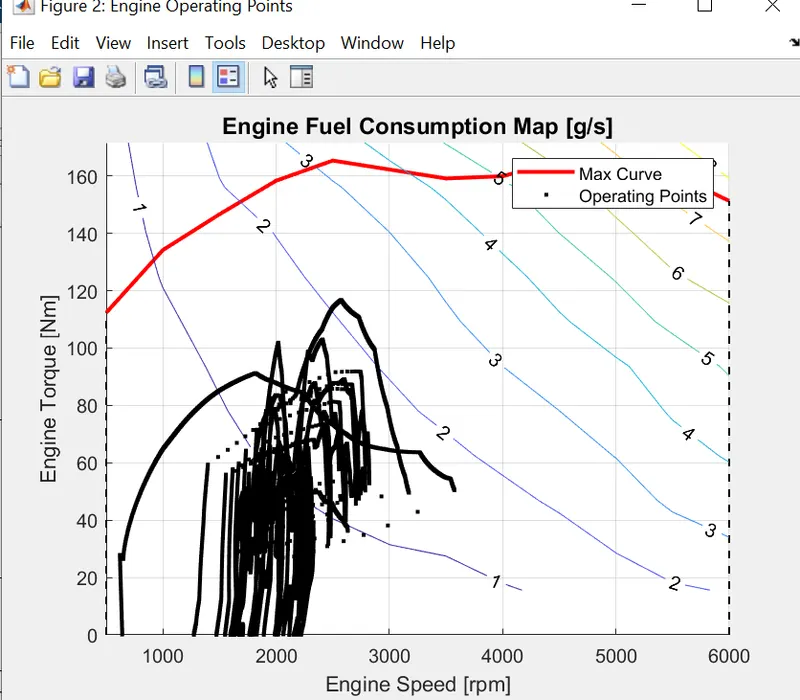
%% Plotting engine operating points on engine fuel map
figure('Name','Engine Operating Points');
hold on
grid on
title('Engine Operating Points','fontsize',12);
p1=plot(Eng_map_spd*30/pi,Eng_max_trq,'linewidth',2,'color','r');
p2=line([Eng_map_spd(end)*30/pi Eng_map_spd(end)*30/pi],[0 Eng_max_trq(end)]);
set(p2,'linewidth',1,'linestyle','--','color','k');
p3=line([Eng_map_spd(1)*30/pi Eng_map_spd(1)*30/pi],[0 Eng_max_trq(1)]);
set(p3,'linewidth',1,'linestyle','--','color','k');
[c,h] = contour(Eng_map_spd'*30/pi,Eng_map_trq,Eng_fuel_map');
clabel(c,h);
xlabel('Engine Speed [rpm]');
ylabel('Engine Torque [Nm]');
title('Engine Fuel Consumption Map [g/s]');
%p4 = plot(Eng_spd,Eng_Trq,'.','color','k');
%legend([p1 p4],{'Max Curve','Operating Points'});
%axis([Eng_map_spd(1)*30/pi Eng_map_spd(end)*30/pi 0 Eng_map_trq(end)]);
Scope:-
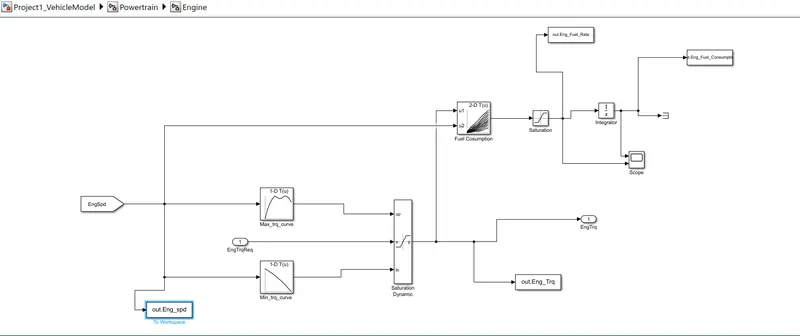
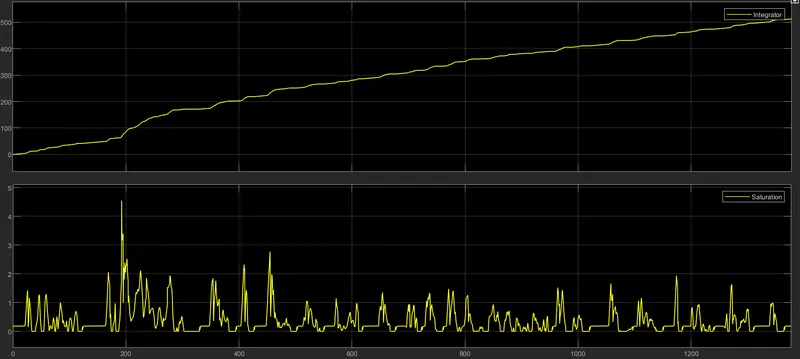
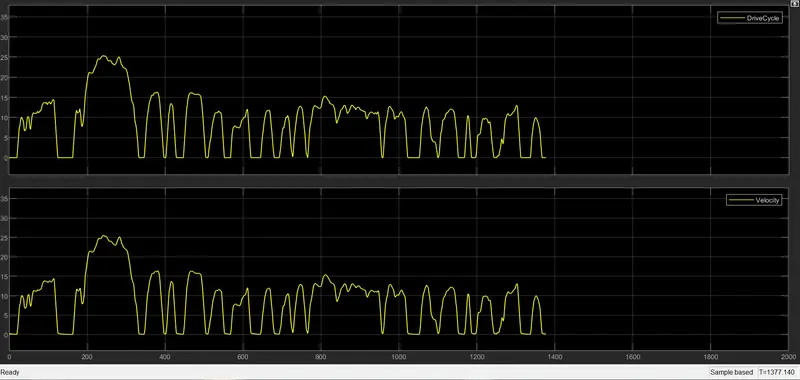
We can see that the graph has more fluctuations in UDDS compared to the HWFET cycle because UDDS has more startsand stops due to urbon conditions but HWFET does not have too many starts and stops Braking is high in UDDS when compared to HWFET due to traffic Peak engine power reached in UDDS is nearly 4800 RPM and that in HWFET is 3800 RPM at the start, because, in UDDS, the vehicle requires more power to start from the initial condition.Engine torque, engine power, fuel rate, and fuel consumption plot:
1)for UDDS cycle :-(Urbon Dynamometer drive cycle ):
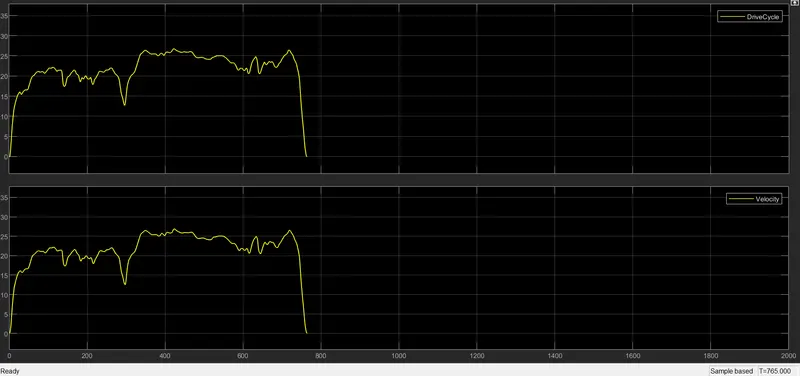
Drive cycle :scope
2) HWFET(highway fuel economy test ):
1) Fuel economy of UDDS cycle :
As we see, the fuel economy is high in HWFET compared to UDDS, it is because, in urban driving, the vehicle encounters more
traffic and it has to stop for fewer distances and it consumes more fuel at the starting. In HWFET, the vehicle encounters no traffic and it moves without use of too much braking, so it will have more fuel economy number.
Fuel economy for HWFET :-
V
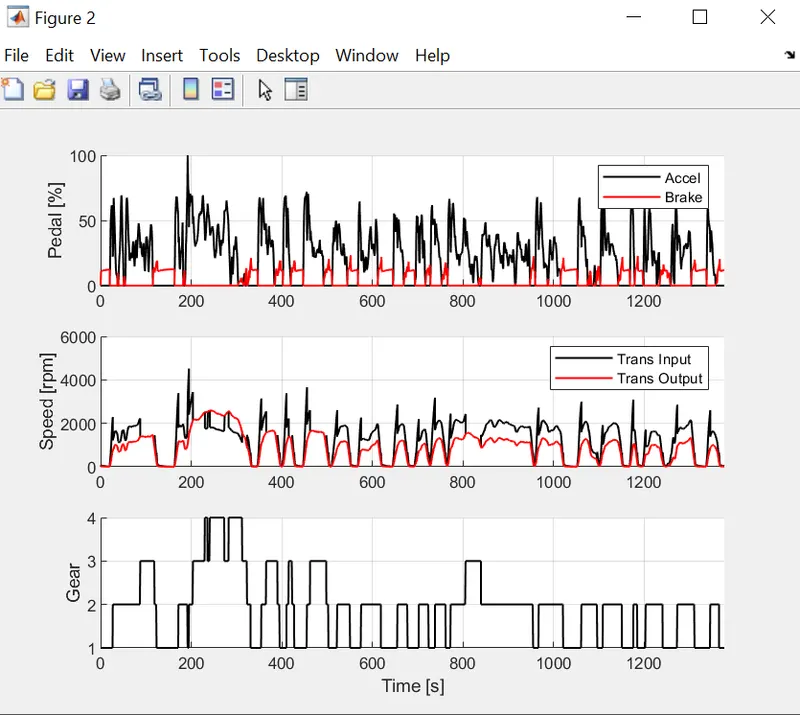
Accelerator and brake pedal chart for UDDS Cycle :
As in HWFET Cycle frequent stops ie brake opearted and in Udds cycle more stopages is occure . also similarly effects on speed . That is in highway speed is high and in UDDS cycle comparativly speed is less. Also gear selection drive changing phenomenon is more in UDDS cycle as compare to HWFET cycle Vehicle consumed more power in the UDDS compared to HWFET cycle because it has too many starts and stops compared to HWFET. When starting from the initial condition vehicle requires more power Engine torque is also high in UDDS because while starting from rest, the vehicle requires more torque to overcome the static
friction
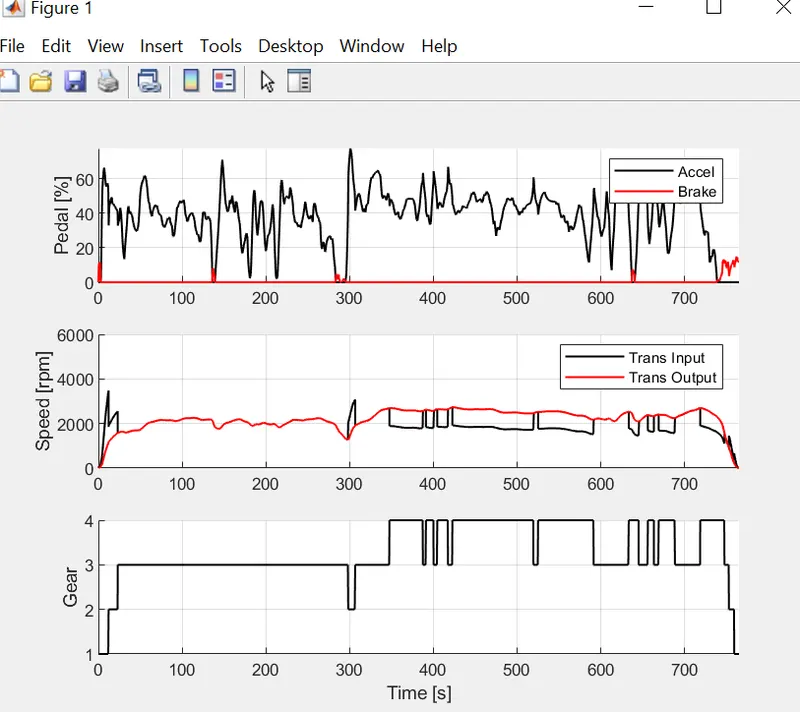
Accelerator and brake pedal chart for HWFET Cycle :
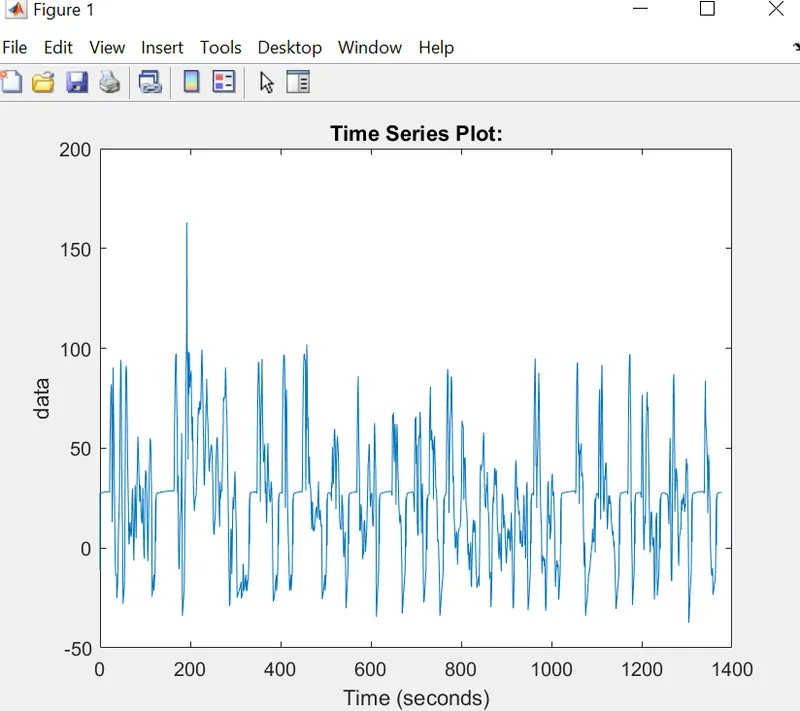
Tme series plot for UDDS Cycle :-
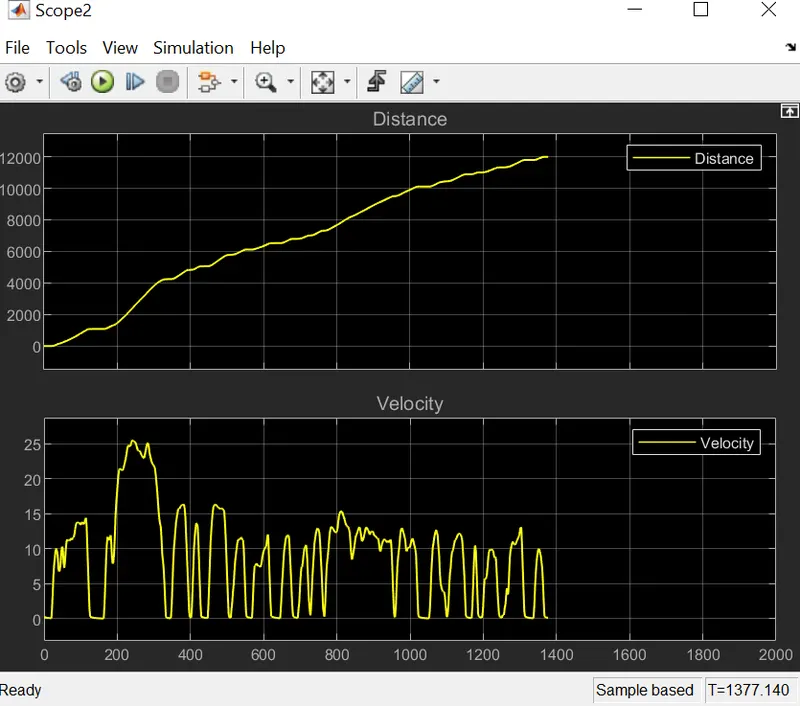
Velocity and distance plot For UDDS Cycle :
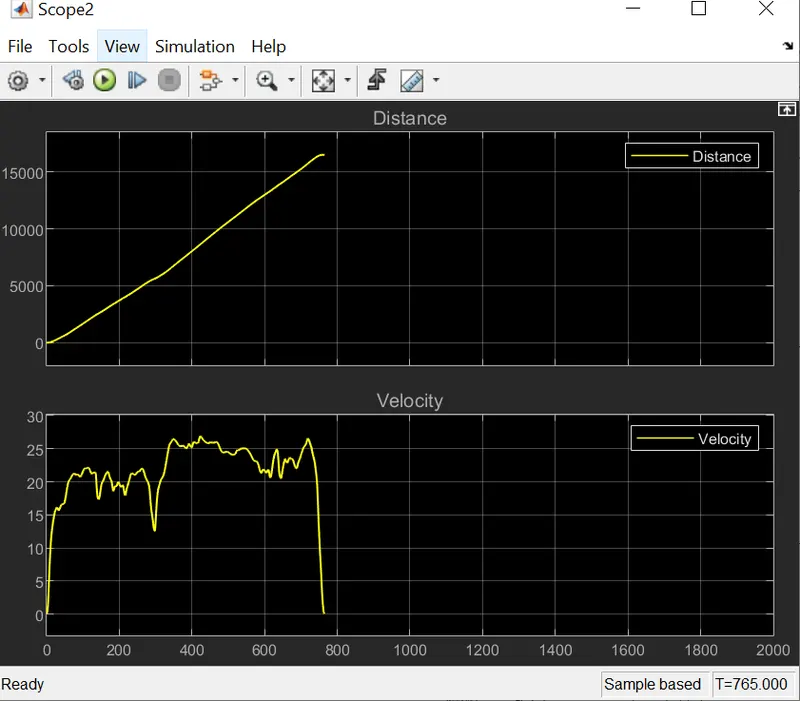
Velocity and distance plot For HWFET Cycle :
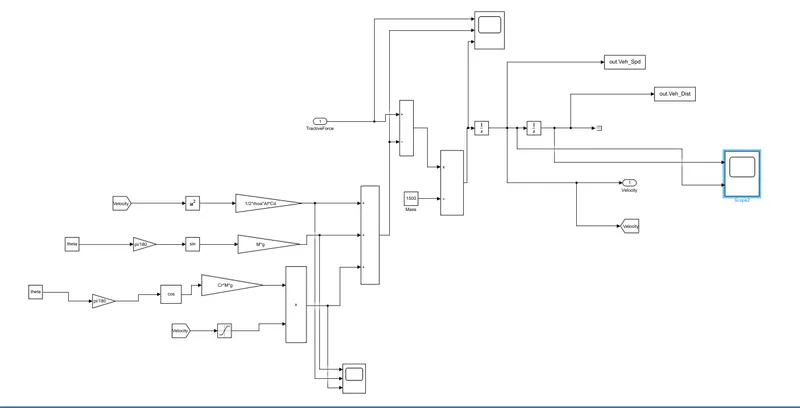
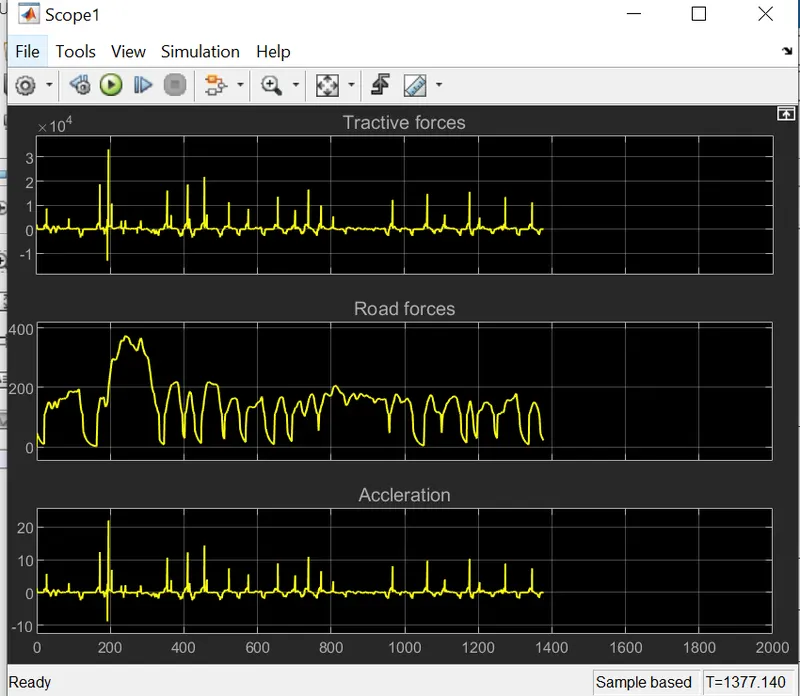
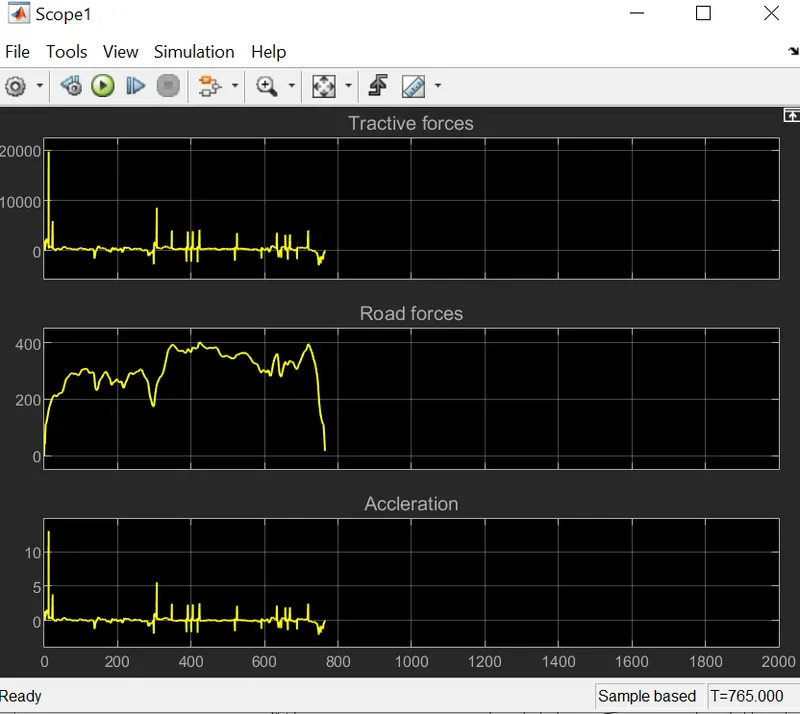
Road loads graph:- As the graph for both cycle shown. In UDDS Cycle
1)UDDS Cycle 2)HWEFT Cycle
Conclusions :-
For UDDS, the accelerator and the brake pedal have more fluctuations because of frequent starts and stops. But in HWFET, the
brake pedal fluctuations are almost near to the zero line as there will be no frequent stops UDDS cycle mostly runs on 1st, 2nd gears, and uses 3rd, 4th gears very rarely as it does not achieve high speeds in that traffic. In the HWFET cycle, the vehicle mostly runs on 3rd, 4th gears as it will be moving at high speeds. It uses 1st, 2nd gears very frequently when braking is required So that , the vehicle speeds will be high in HWFET compared to UDDS. so that fuel also consumption is more in UDDS cycle as move in 1 and 2 gear as compare to HWFET cycle .