Project
1st model:
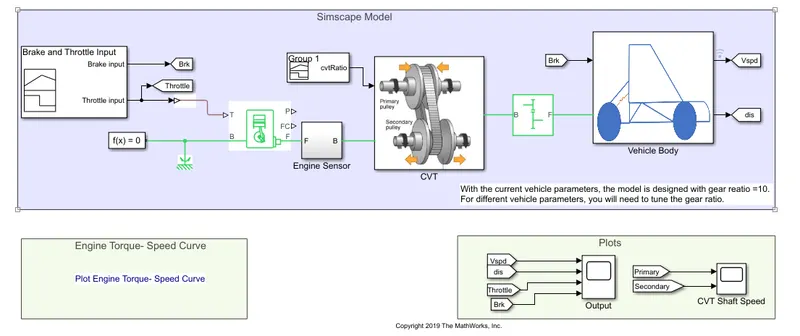
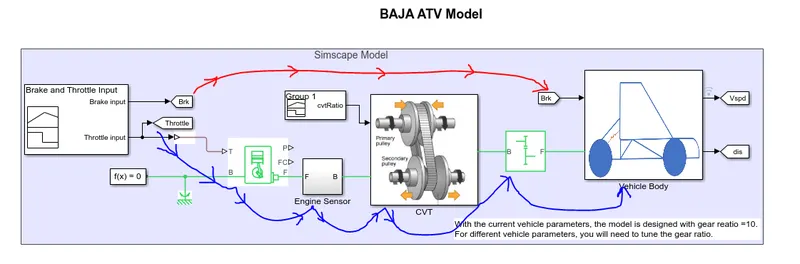
this is the CVT model for a vehicle. as you can see in the model pulley transmission.
first we have used, signal builder to give THROTTLE & BRAKE INPUT:
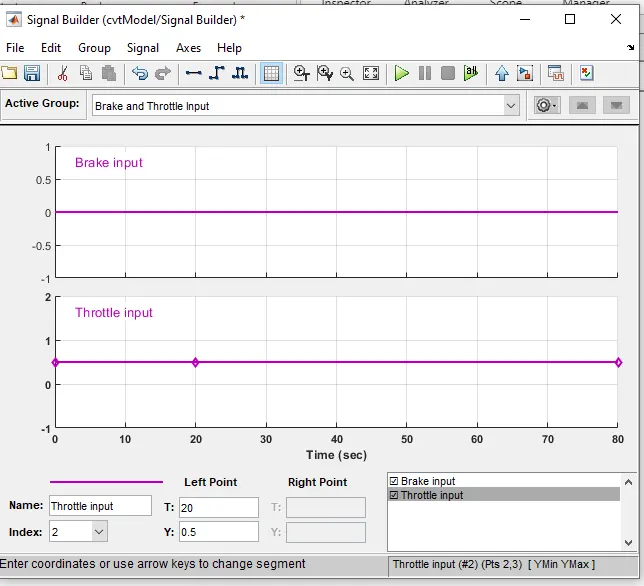
BRAKE is set to ZERO , means no break. and 0.5 value of throttle is given. adn stored in GOTO blocks. also these signal send to the engine either diesel or petrol.
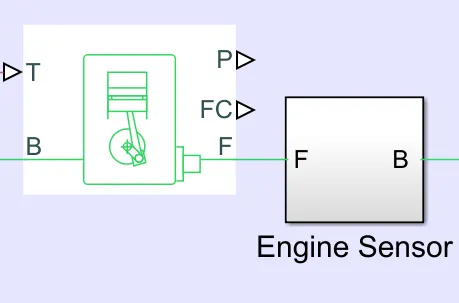
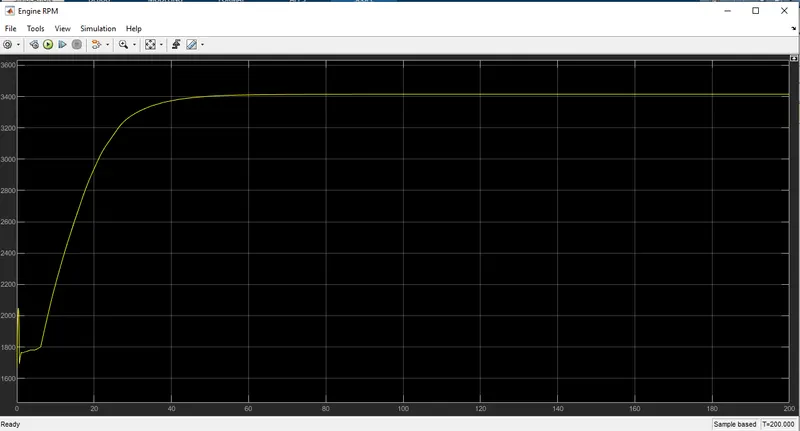
Engine is further connected to RPM sensor, that sense the RPM of the Engine OUtput shaft. you can see from scope of RPM sensor RPM become constant at 3400 RPM value.
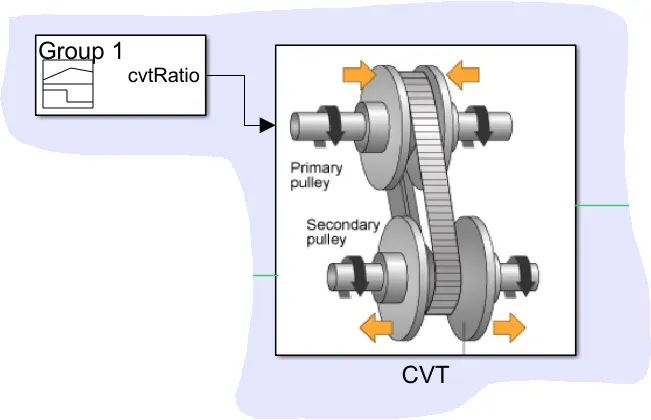
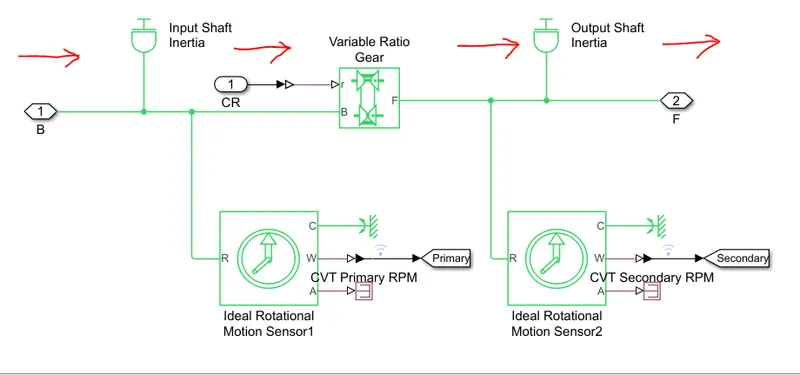
The output shaft of the engine goes to the CVT system , input shaft connect to primary pulley of CVT and thIS RPM transfer to the secondary pulley. the gear ratio is changed by signal builder GROUP1.
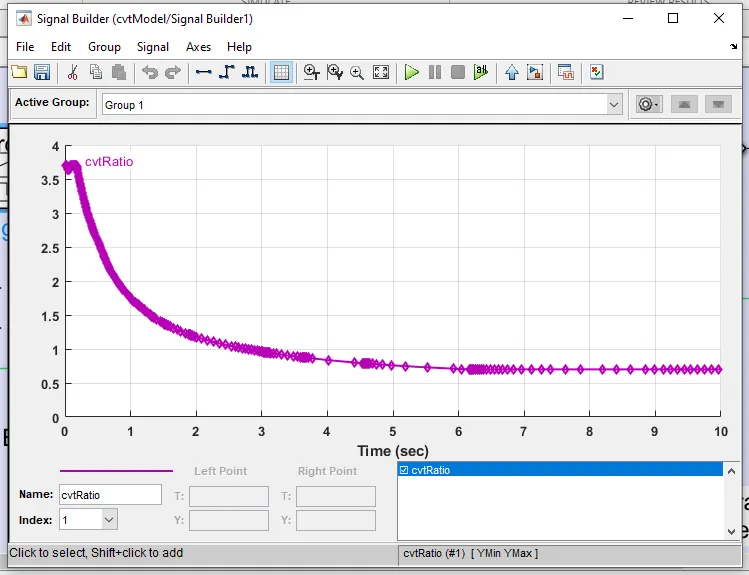
THE SECONDARY , its shaft connect to the gear box of the vehicle body, that further increase in RPM.
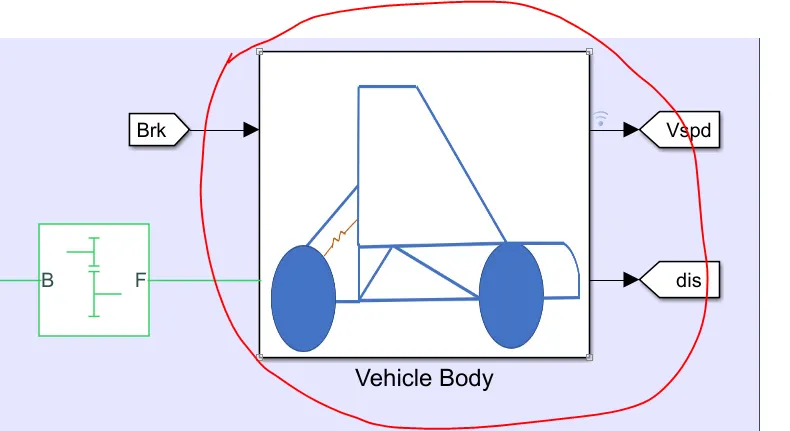
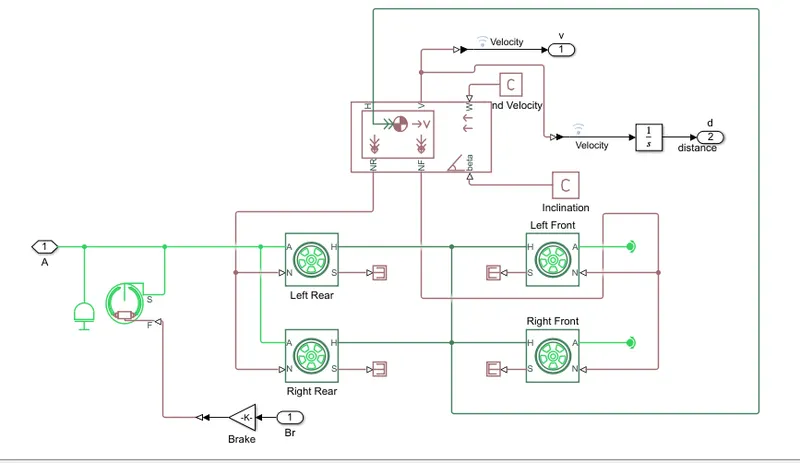
you can see, incoming shaft is connected to the rear wheel. which are connected to the front wheels whiuch are free to steer them. brakes are connected to it. (K)
vehicle body (frame+chassis+person) is connected to which outer force are exterted that are :
opposite direction wind velocity, any inclination denoted by C.
V is the velocity if the Vehicle, and D is the distance is can be seen.
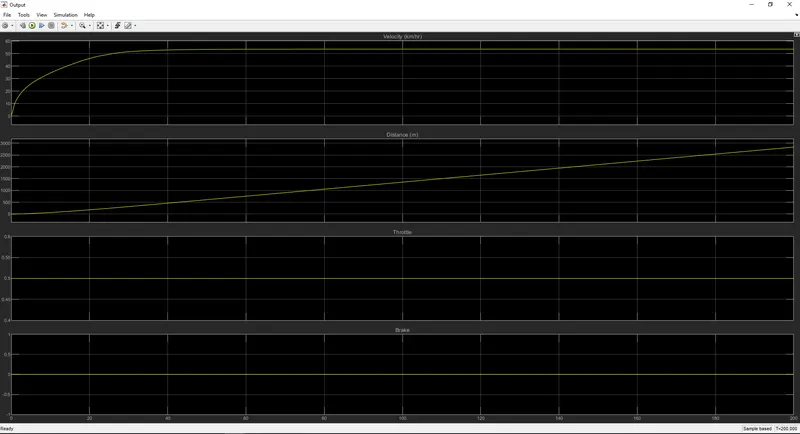
in above, we can see that what distance the vehicle body covered and what is the velocity of that body. when following (two graphs below) brake and throttle is applied
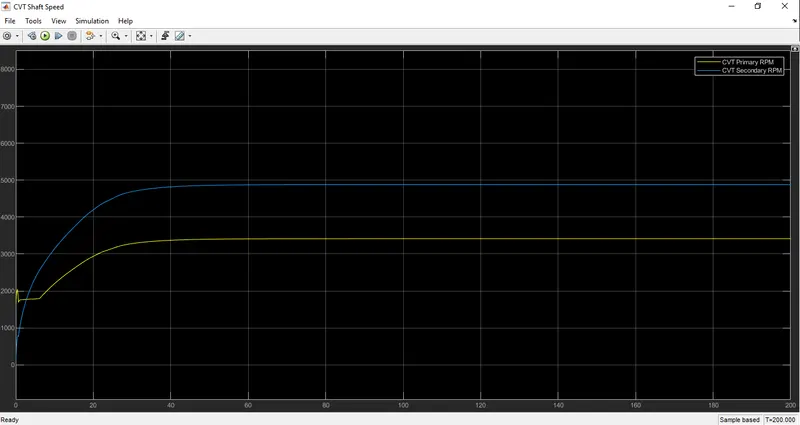
you can see, here incoming RPM of the CVT w.r.t Seconday pulley shaft RPM.
===========================================================================================
2ND model:
YOU CAN SEE THE ABOVE MODEL SETUP has a system input & output dashboard.
you have a slider for BRAKE & THrottle. and the RPM & VELOCITY out is shownin the gauges.
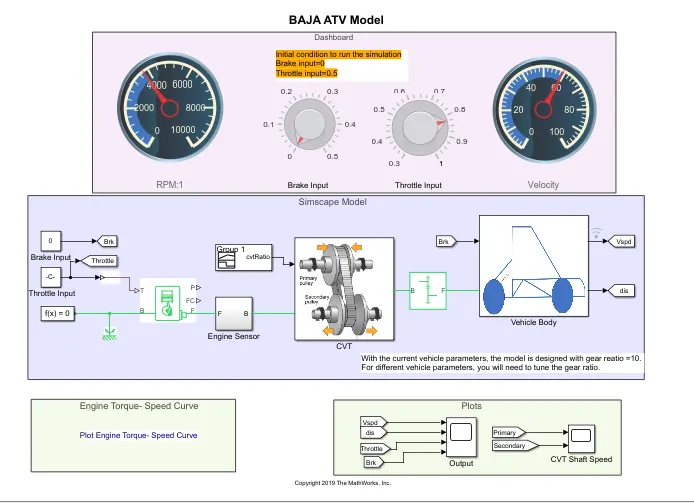
we ran it for inf time , during which we give brake if need and the throttle with help of knob the throttle & brakes.
and the we stopped it.
we will see the ouput now:
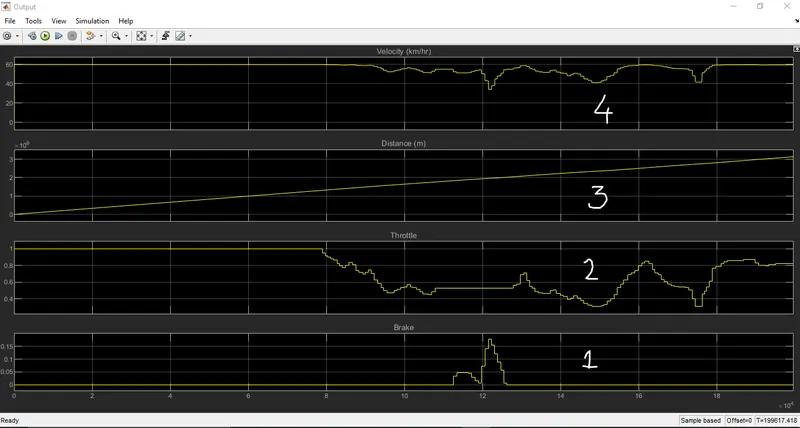
you can see in the picture, 1 is brake applied, 2 is the throttle variation done manually.
after the interval of th runtime/stop time the vehicle has covered some distance is denoted by 3.
and you can see where the brake is applied the velocity has falled down. adn when throttle graph is down velocity is down.
the velocity is denoted by 1.
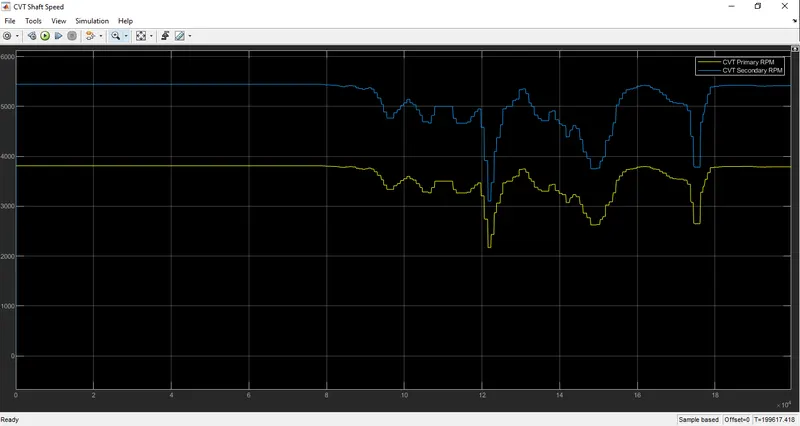
from above you can see the primary pulley of CVT RPM and secondary pulley RPM. you can see the graph of RPM and Velocity is quite similiar due to RPM is just as Velocity.
=====================================================================================================
3RD model:
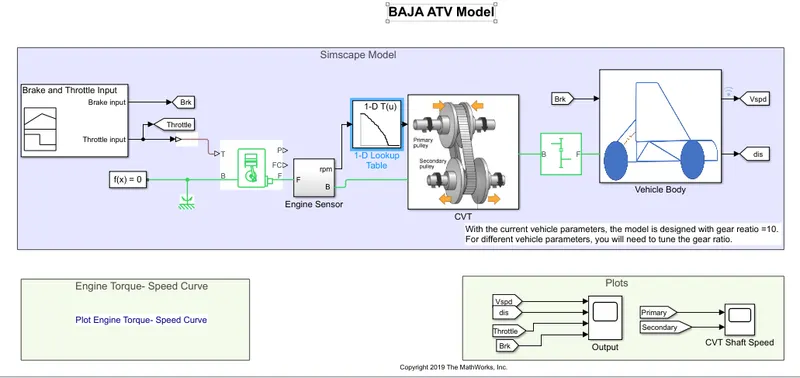
here is the Engine sensor, which sense the RPM of engine output shaft,
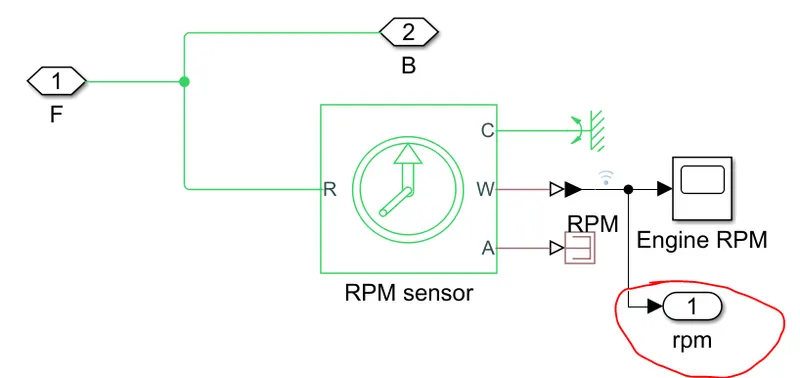
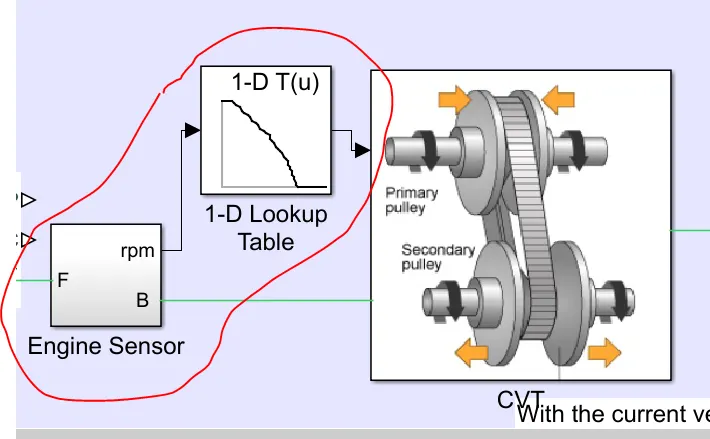
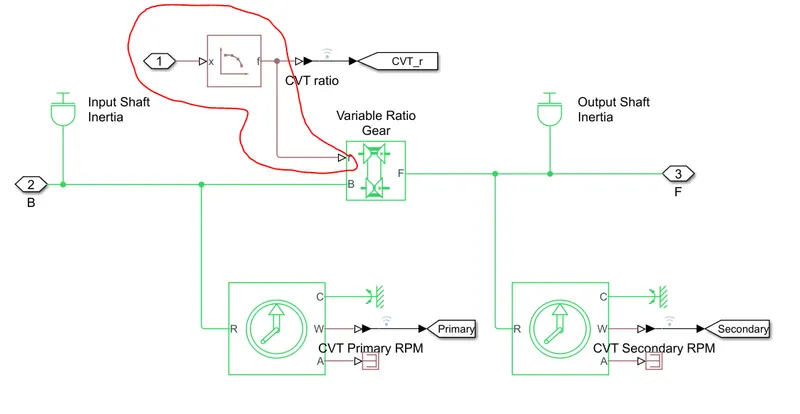
hense a feedback sent by using 1-D lookup to secondary shaft of the CVT. and the other system is same before.
here is the final result:
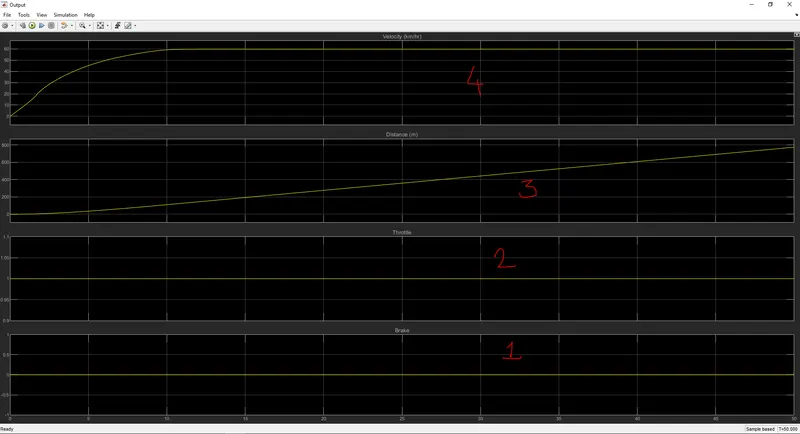
====================================================================================================
4th model:
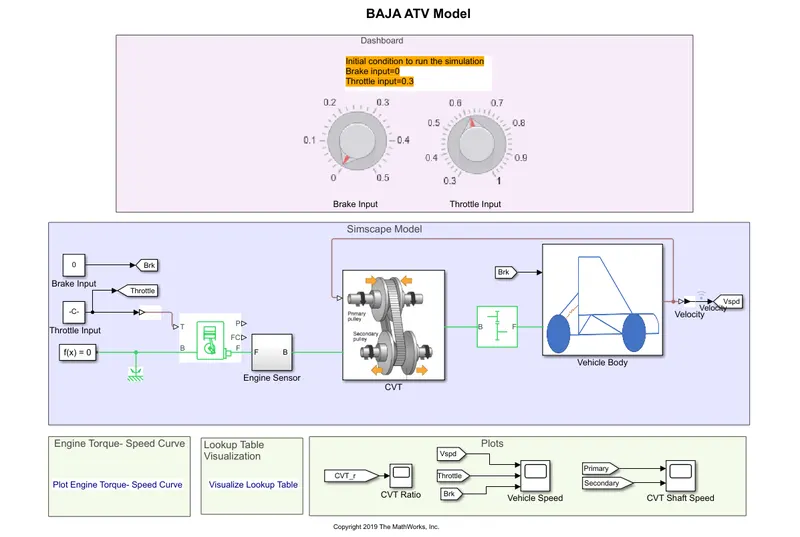
the above model is same, but it takes feedback signal from output velocity of body then sends back to secondary pulley of CVT.
if you look inside the CVT, you see the marked block
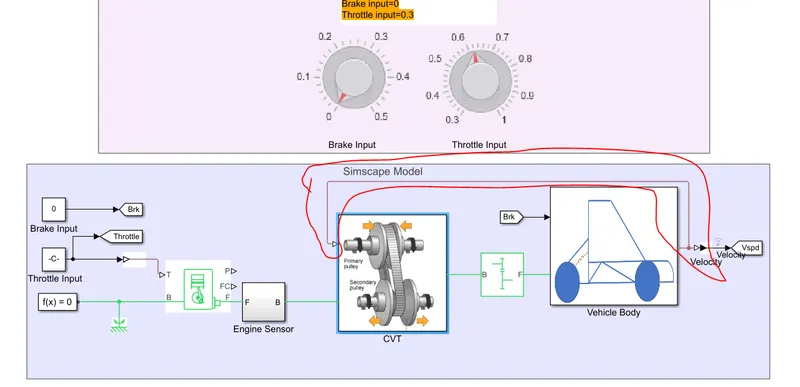
start the simulation and try your input by sliding brake and throttle lever manually.
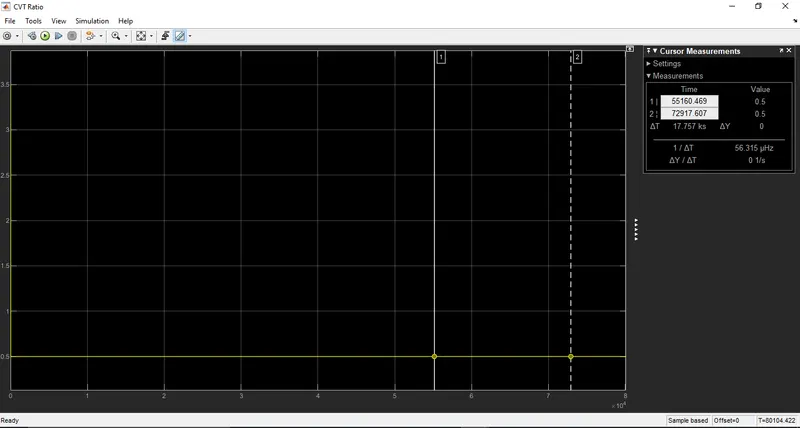
above figure is: CVT ratio that 0.5
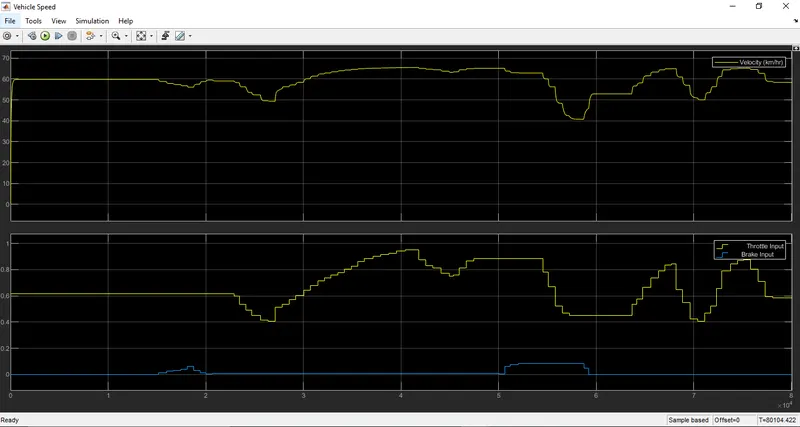
you can see, as the throttle incresed the Velocity increased. when the point of brake is applied the velocity is also goes down.
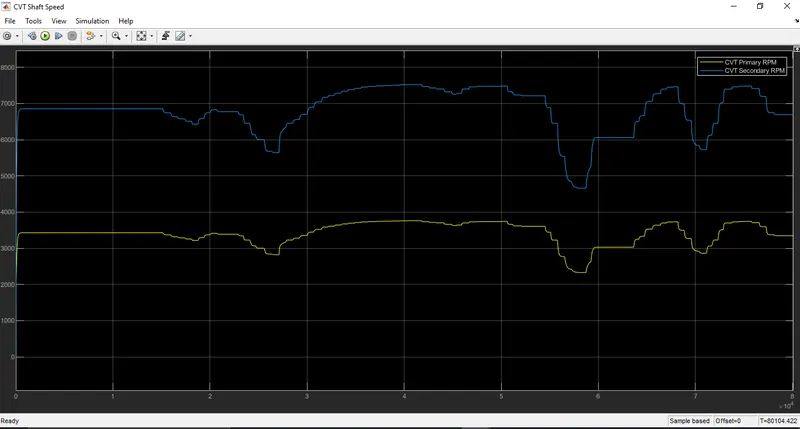
You can see CVT primary & Secondary pulley RPM.
===========================================================================================