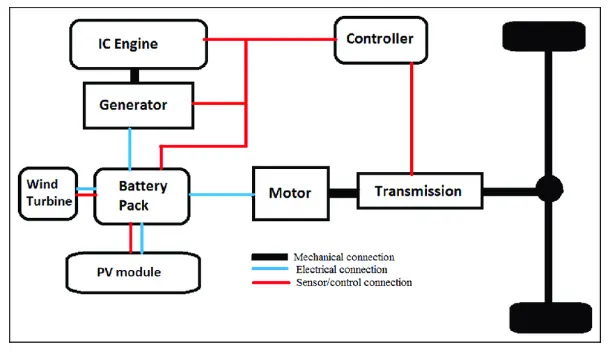
Project-1: Powertrain for aircraft in runways
1.Search and list out the total weight of various types of aircrafts.
Weight is a force that exists due to the force of gravity of the earth that acts on a body with a mass. Airplanes are designed with numerous components of different sizes and weights such as the wings, the engine the fuselage the tail, etc. Since every component of the airplane has a weight the total weight of the airplane is given by the summation of the weight of each component.
There are various weights that are considered when designing an aircraft and are mentioned in the specifications of different aircraft. These various weights can be divided into design weight limits and authorized weight limits. Design weight limits are the limits that engineers set during the design state of aircraft and are the maximum permissible weights that the aircraft can carry. Authorized weight limits are those that are set by authorities in aircraft flight manuals (AFMs). The authorized weight limits may be lesser than or equal to the design weight limits but they can never exceed them during aircraft operation e.g. taxing, take off, landing, en-route.
Maximum design taxi weight (MDTW)
The maximum design taxi weight (also known as the maximum design ramp weight (MDRW)) is the maximum weight certificated for aircraft maneuvering on the ground (taxiing or towing) as limited by aircraft strength and airworthiness requirements.
Maximum design takeoff weight (MDTOW)
Is the maximum certificated design weight when the brakes are released for takeoff and are the greatest weight for compliance with the relevant structural and engineering requirements demonstrated by the manufacturer.
Maximum design landing weight (MLW)
The maximum certificated design weight at which the aircraft meets the appropriate landing certification requirements. It generally depends on the landing gear strength or the landing impact loads on certain parts of the wing structure.
The MDLW must not exceed the MDTOW.
The maximum landing weight is typically designed for 10 feet per second (600 feet per minute) sink rate at touch down with no structural damage.
Maximum design zero-fuel weight (MDZFW)
The maximum certificated design weight of the aircraft less all usable fule and other specified usable agents (engine injection fluid, and other consumable propulsion agents). It is the maximum weight permitted before usable fuel and other specified usable fluids are loaded in specified sections of the airplane. The MDZFW is limited by strength and airworthiness requirements. The subsequent addition of fuel will not result in the aircraft design strength being exceeded at this weight. The weight difference between the MDTOW and the MDZFW may be utilized only for the addition of fuel.
Minimum flight weight (MFW)
Minimum certificated weight for flight as limited by aircraft strength and airworthiness requirements.
Maximum taxi weight (MTW)
The maximum taxi weight (MTW) (also known as the maximum ramp weight (MRW) is the maximum weight authorized for maneuvering (taxiing or towing) an aircraft on the ground as limited by aircraft strength and airworthiness requirements. It includes the weight of taxi and run-up fuel for the engines and the APU.
It is greater than the maximum takeoff weight due to the fuel that will be burned during the taxi and runup operations.
The difference between the maximum taxi/ramp weight and the maximum take-off weight (maximum taxi fuel allowance) depends on the size of the aircraft, the number of engines, APU operation, and engines/APU fuel consumption, and is typically assumed for 10 to 15 minutes allowance of taxi and run-up operations.
Payload
It is the carrying capacity of an aircraft. It includes cargo, people, extra fuel. In the case of a commercial airliner, it may refer only to revenue-generating cargo or paying passengers.
Maximum takeoff weight (MTOW)
The maximum takeoff weight (also known as the maximum brake-release weight) is the maximum weight authorized at brake release for takeoff, or at the start of the takeoff roll.
The maximum takeoff weight is always less than the maximum taxi/ramp weight to allow for fuel burned during taxi by the engines and the APU.
In operation, the maximum weight for takeoff may be limited to values less than the maximum takeoff weight due to aircraft performance, environmental conditions, airfield characteristics (takeoff field length, altitude), maximum tire speed and brake energy, obstacle clearances, and/or en route and landing weight requirements.
Regulated takeoff weight (RTOW)
Depending on different factors (e.g. flap setting, altitude, air temperature, length of runway), RTOW or maximum permissible takeoff weight varies for each takeoff. It can never be higher than MTOW.
Maximum landing weight (MLW)
The maximum weight is authorized for the normal landing of an aircraft.
The MLW must not exceed the MTOW.
The operation landing weight may be limited to a weight lower than the Maximum Landing Weight by the most restrictive of the following requirements:
Aircraft performance requirements for a given altitude and temperature:
landing field length requirements,
approach and landing climb requirements
Noise requirements
If the flight has been of short duration, fuel may have to be jettisoned to reduce the landing weight.
Overweight landings require a structural inspection or evaluation of the touch-down loads before the next aircraft operation.
Maximum zero-fuel weight (MZFW)
The maximum permissible weight of the aircraft less all usable fuel and other specified usable agents (engine injection fluid, and other consumable propulsion agents). It is the maximum weight permitted before usable fuel and other specified usable fluids are loaded in specified sections of the airplane.
The diagram below shows the various weight considered for the aircraft operation.
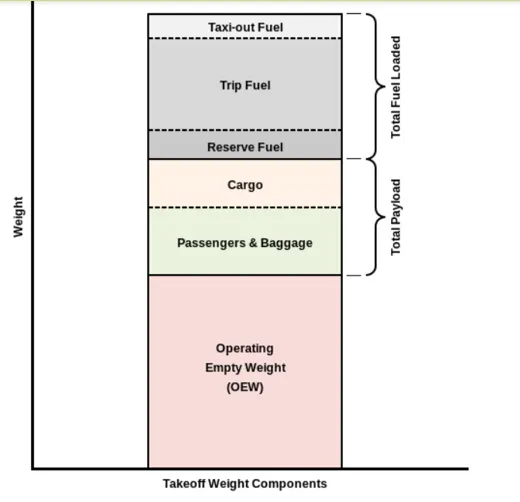
The table below shows the different models of the aircraft and their maximum weights.
|
Type |
MTOW [kg] |
MLW [tonnes] |
TOR [m] |
LR [m] |
||
|
640,000 |
591.7 |
3500 |
Heavy |
Super |
||
|
589,670 |
3660 |
Heavy |
Super |
|||
|
575,000 |
394 |
3100 |
1930 |
Super |
Super |
|
|
447,700 |
346.091 |
3100 |
1800 |
Heavy |
Heavy |
|
|
443,613 |
306.175 |
3100 |
Heavy |
Heavy |
||
|
412,770 |
295.742 |
3090 |
Heavy |
Heavy |
||
|
Antonov An-124-100M |
405,060 |
330 |
2520 |
900 |
Heavy |
Heavy |
|
396,900 |
295.742 |
3018 |
2179 |
Heavy |
Heavy |
|
|
381,000 |
288.417 |
2530 |
1494 |
Heavy |
Heavy |
|
|
377,840 |
285.700 |
3338 |
2109 |
Heavy |
Heavy |
|
|
377,840 |
260.320 |
3222 |
1905 |
Heavy |
Heavy |
|
|
371,950 |
240 |
3050 |
2010 |
Heavy |
Heavy |
|
|
367,400 |
256 |
3100 |
2100 |
Heavy |
Heavy |
|
|
347,800 |
260.816 |
2830 |
Heavy |
Heavy |
||
|
352,000 |
251.5 |
3100 |
Heavy |
Heavy |
||
|
351,800 |
251.29 |
3100 |
Heavy |
Heavy |
||
|
347,450 |
223.168 |
3000 |
Heavy |
Heavy |
||
|
340,200 |
265.300 |
Heavy |
Heavy |
|||
|
308,000 |
233.5 |
Heavy |
Heavy |
|||
|
299,370 |
237.683 |
3380 |
Heavy |
Heavy |
||
|
297,550 |
213.00 |
3380 |
1550 |
Heavy |
Heavy |
|
|
276,700 |
190 |
3000 |
1926 |
Heavy |
Heavy |
|
|
273,300 |
185 |
2990 |
1890 |
Heavy |
Heavy |
|
|
270,000 |
175 |
2670 |
1860 |
Heavy |
Heavy |
|
|
270,000 |
195.04 |
3115 |
2118 |
Heavy |
Heavy |
|
|
256,280 |
183 |
2990 |
1890 |
Heavy |
Heavy |
|
|
254,000 |
192.777 |
2900 |
Heavy |
Heavy |
||
|
254,000 |
201.849 |
Heavy |
Heavy |
|||
|
253,500 |
181 |
2990 |
Heavy |
Heavy |
||
|
250,000 |
175 |
2600 |
1980 |
Heavy |
Heavy |
|
|
242,000 |
185 |
2500 |
1750 |
Heavy |
Heavy |
|
|
242,000 |
180 |
2220 |
1750 |
Heavy |
Heavy |
|
|
231,300 |
166.92 |
2636 |
Heavy |
Heavy |
||
|
228,000 |
172.365 |
3300 |
1695 |
Heavy |
Heavy |
|
|
211,400 |
Heavy |
Heavy |
||||
|
208,000 |
175 |
Heavy |
Heavy |
|||
|
204,000 |
158.758 |
3414 |
Heavy |
Heavy |
||
|
192,000 |
140 |
2385 |
1555 |
Heavy |
Heavy |
|
|
187,000 |
136.08 |
2713 |
1676 |
Heavy |
Heavy |
|
|
185,000 |
111.1 |
3440 |
2220 |
Heavy |
Heavy |
|
|
163,000 |
138 |
2324 |
1536 |
Heavy |
Heavy |
|
|
159,000 |
136.078 |
2713 |
1676 |
Heavy |
Heavy |
|
|
157,000 |
124 |
2290 |
1490 |
Heavy |
Heavy |
|
|
152,000 |
151.9 |
Heavy |
Heavy |
|||
|
151,000 |
97.5 |
Heavy |
Heavy |
|||
|
151,000 |
112.1 |
Heavy |
Heavy |
|||
|
147,000 |
Heavy |
Heavy |
||||
|
142,000 |
123 |
1860 |
1480 |
Heavy |
Heavy |
|
|
141,000 |
122 |
980 |
770 |
Heavy |
Heavy |
|
|
140,000 |
Heavy |
Heavy |
||||
|
125,000 |
Medium |
Large |
||||
|
124,000 |
101.6 |
2550 |
1750 |
Medium |
Large |
|
|
117,000 |
86.3 |
Medium |
Large |
|||
|
116,000 |
89.9 |
2347 |
1555 |
Medium |
Large |
|
|
106,000 |
79.5 |
Medium |
Large |
|||
|
104,000 |
79.5 |
Medium |
Large |
|||
|
104,000 |
80 |
Medium |
Large |
|||
|
104,000 |
87.5 |
2250 |
Medium |
Large |
||
|
87,500 |
Medium |
Large |
||||
|
85,000 |
66.36 |
2500 |
1704 |
Medium |
Large |
|
|
85,000 |
71.35 |
2804 |
1829 |
Medium |
Large |
|
|
84,000 |
70.1 |
Medium |
Large |
|||
|
Airbus A321-100 |
83,000 |
77.8 |
2200 |
1540 |
Medium |
Large |
|
79,000 |
65.32 |
2308 |
1634 |
Medium |
Large |
|
|
78,000 |
68.1 |
Medium |
Large |
|||
|
73,000 |
63.28 |
Medium |
Large |
|||
|
72,500 |
62.4 |
Medium |
Large |
|||
|
72,500 |
62.4 |
Medium |
Large |
|||
|
71,000 |
64.41 |
2165 |
1520 |
Medium |
Large |
|
|
70,700 |
Medium |
Large |
||||
|
70,000 |
58.06 |
1921 |
1415 |
Medium |
Large |
|
|
Airbus A320-100 |
68,000 |
66 |
1955 |
1490 |
Medium |
Large |
|
68,000 |
54.9 |
2540 |
1540 |
Medium |
Large |
|
|
68,000 |
Medium |
Large |
||||
|
67,000 |
Medium |
Large |
||||
|
66,000 |
54.66 |
1796 |
1340 |
Medium |
Large |
|
|
65,000 |
57.61 |
1890 |
1494 |
Medium |
Large |
|
|
65,000 |
Medium |
Large |
||||
|
64,000 |
62.5 |
1850 |
1470 |
Medium |
Large |
|
|
63,000 |
51.7 |
1939 |
1396 |
Medium |
Large |
|
|
60,000 |
49.9 |
1832 |
1360 |
Medium |
Large |
|
|
59,000 |
50.80 |
1463 |
1356 |
Medium |
Large |
|
|
59,000 |
57.5 |
1375 |
1340 |
Medium |
Large |
|
|
55,000 |
47.174 |
1950 |
Medium |
Large |
||
|
55,000 |
Medium |
Large |
||||
|
54,000 |
Medium |
Large |
||||
|
50,000 |
46.265 |
1950 |
Medium |
Large |
||
|
50,000 |
Medium |
Large |
||||
|
48,600 |
Medium |
Large |
||||
|
48,500 |
Medium |
Large |
||||
|
48,000 |
43 |
2056 |
1323 |
Medium |
Large |
|
|
46,000 |
Medium |
Large |
||||
|
46,000 |
39.95 |
1621 |
1350 |
Medium |
Large |
|
|
44,000 |
Medium |
Large |
||||
|
42,000 |
36.74 |
Medium |
Large |
|||
|
39,000 |
Medium |
Large |
||||
|
37,500 |
32.8 |
2244 |
1304 |
Medium |
Large |
|
|
36,500 |
33.345 |
1778 |
1596 |
Medium |
Large |
|
|
36,000 |
32.8 |
1644 |
1274 |
Medium |
Large |
|
|
33,000 |
30.39 |
1564 |
1478 |
Medium |
Large |
|
|
33,000 |
Medium |
Large |
||||
|
30,400 |
Medium |
Large |
||||
|
28,000 |
28.01 |
1219 |
1295 |
Medium |
Large |
|
|
23,000 |
21.319 |
1918 |
1479 |
Medium |
Large |
|
|
22,800 |
22.35 |
1333 |
914 |
Medium |
Large |
|
|
22,800 |
21.5 |
1300 |
Medium |
Large |
||
|
22,000 |
19.3 |
2270 |
1380 |
Medium |
Large |
|
|
18,600 |
18.3 |
1165 |
1126 |
Medium |
Small |
|
|
13,150 |
12.930 |
1300 |
1030 |
Medium |
Small |
|
|
11,500 |
11.25 |
1560 |
1380 |
Medium |
Small |
|
|
10,890 |
10.570 |
1493 |
826 |
Medium |
Small |
|
|
9,752 |
8.709 |
1353 |
811 |
Medium |
Small |
|
|
8,300 |
7.665 |
893 |
724 |
Medium |
Small |
|
|
8,150 |
7.65 |
956 |
677 |
Medium |
Small |
|
|
7,765 |
7.605 |
1036 |
853 |
Medium |
Small |
|
|
7,761 |
7.103 |
1039 |
896 |
Medium |
Small |
|
|
7,000 |
Medium |
Small |
||||
|
4,800 |
4.43 |
975 |
741 |
Light |
Small |
2. Is there any difference between ground speed and air speed?
An aircraft has two different terms for the velocity at which it is moving with. The ground speed of an aircraft is a measure of how fast the aircraft is moving relative to a fixed point on the ground. It can also be thought of how fast the shadow of an aircraft is moving across land. The ground speed is a horizontal speed meaning that if the aircraft was moving vertically upwards or downwards, it would have no ground speed. The air speed however is the speed at which the aircraft is moving with its own power relative to the air it is flying in. The air speed is calculated by subtracting the wind speed from the ground speed. It can also be thought of the speed of the air flowing around the wings of an aircraft. This means that if there was no effect of wind resistance, the ground speed would be equal to the air speed. If an aircraft in the air is moving in the same direction as the wind blows, it will experience tail wind meaning that its ground speed is higher than its air speed. However, if the aircraft moves in the opposite direction to that of which the wind blows, it will experience head wind meaning that its ground speed is lower than its air speed.
Consider the example below:
Suppose an aircraft was travelling in the air with an air speed of 500 miles per hour (mph) and has to travel a distance of 2000 miles. If there was no wind at all, the air speed would be equal to the ground speed i.e. the ground speed would also be 500mph. This would mean that that the aircraft would arrive at its destination in 4 hours.
However, if there was a wind blowing with a speed of 100mph in the opposite direction to that of which the aircraft is moving, the aircraft would experience headwind. So, we know that the ground speed would be lesser than the air speed in this condition.
Vground=Vair+Vω
If we were to consider the direction of the aircraft's velocity as positive, then the wind velocity would be negative. This would rearrange the equation to:
Vground=Vair−Vω
Vground=500−100
Vground=400mph
So, we can see that the ground speed of the aircraft is 400mph even though the air speed of the aircraft is 500mph. Due to this, the time taken for the aircraft to reach its destination will extend with it now taking 5 hours.
Consider the opposite effect:
If the wind was blowing with the same speed of 100mph in the same direction as that of which the aircraft is moving, the aircraft would experience tailwind now. In this condition, the ground speed of the flight will be greater than the air speed.
As the wind velocity and the air speed are in the same direction, we can consider both as being in the positive direction.
Vground=Vair+Vω
Vground=500+100
Vground=600mph
So, we can see that the ground speed is 100mph greater than the air speed and this will mean that the aircraft will arrive at its destination in 3 hours and 20 minutes.
3. Why is it not recommended to use aircraft engine power to move it on the ground at Airport?
Unlike ground-based vehicles, airplanes do not have a direct connection between the engine power and the wheels. The engines of an aircraft produce a thrust by sucking in air from the front and accelerating it backward through a jet engine or propeller. This thrust action is what allows the aircraft to move forward. Whether an aircraft is traveling in the air or on the ground, the way in which it uses the propulsive power from the jet engines is the same whether it has to move forwards or backward. This means to say that an aircraft uses its jet engines for propulsion in the air and on the ground.
"Pushback" is the procedure in which a tug vehicle is towed to the front of the airplane and are used to help reverse the airplane to tug it to a safe distance from the terminal/gate before takeoff. Tug vehicles are used for this purpose because even though they have a small size compared to the airplane, they have high torque and mass. In spite of using the tug vehicles for the pushback procedure, the engines of an airplane are more than capable of performing this procedure on their own. This can be done by using a 'reverse thrust' wherein the blades of the propeller are twisted in order for them to be able to take in air from behind the aircraft as opposed to the front and accelerate it forward. In this way, the airplane can use this propulsive power to move backward however, it is very rarely used.
This is because using the reverse thrust to push back from the terminal/gate consumes a lot of engine power and is also a very noisy operation when done on the ground. The usage of reverse thrust to push back from the terminal/gate is also potentially hazardous. This is because the usage of the reverse thrust can cause debris to blow toward the airplane which creates a foreign object hazard. This foreign object hazard is dangerous in many ways. For instance, the ground staff are at risk, because the reverse thrust can create an air flow which can blow them away and damage their ground operations equipment. The passengers in the airplane are also at risk because the debris can damage the jet engines of the aircraft which can create a fire hazard that can create an explosion due to the flammability of the fuel. The debris can also pose a risk to the potential passengers waiting at the terminal/gate because it can break through the glass windows. Due to the possible dangers, the tug vehicle is used for reversing the airplane until it is a safe distance from the terminal/gate and the airport ground staff. By using the taxiing vehicle, the fuel can be saved, and it can save the lives of the ground staff and their equipment and people at the terminal/gate.
4. How an aircraft is pushed to runway when its ready to take off?
Once all the passengers have boarded and the pilots have authorization from the flight control, the aircraft begins the first stage of a flight procedure which is called 'push back'. In this stage, the front of the airplane is connected to a tug vehicle which helps to push back i.e. reverse the airplane from the terminal/gate. The airplane pushes back from the terminal/gate and once this is done, it is ready for "taxiing".
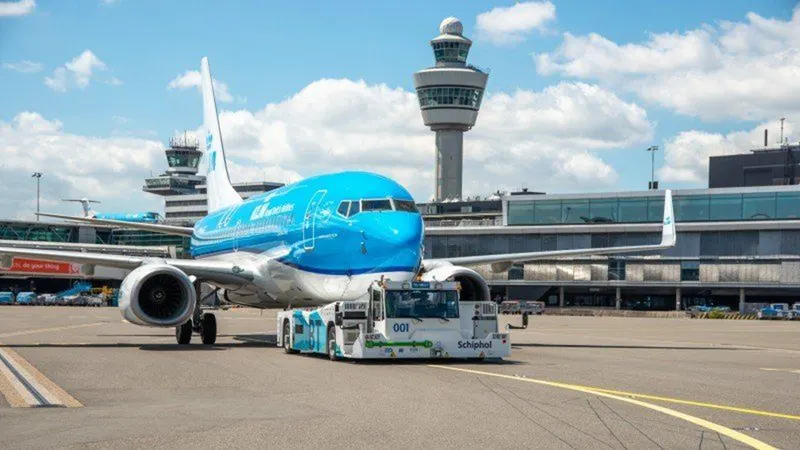
Taxiing is the next procedure before the flight in which the aircraft moves on the ground using its own power on its wheels without the assistance of any tug or towing vehicles. The same propulsive power that the jet engines produce for thrust during flight is used for moving forwards on the ground. Since the taxiing procedure occurs with the engine power of an aircraft, this procedure only occurs once an aircraft is at a safe distance from the terminal/gate, as well as from the ground staff after pushback. This is because there are several dangers that exist when an aircraft uses the thrust from the jet engines for movement on the ground. It is for this reason that a pushback vehicle is used to guide the aircraft away from the potential danger zones before taxiing can take place. During the taxiing procedure, the aircraft will move along taxiways.
Taxiways are paths on an airport ground which connect runways, terminals/gates, hangars and other facilities. The airplane moves along these taxiways at a relatively low speed of 20 - 30 knots (23 - 35 mph or 37 - 56kmph) because of speed limits for safety reasons set by operators and aircraft manufacturers. The taxiways like roads, have markings on their surface to show the direction in which to conduct the taxiing procedure in. Also, the taxiways have signboards that are used to identify runways, taxiways, etc. These sign boards may be either operational guidance signs or mandatory instruction signs. Taxiways also use various types of lights and are mainly used for the purpose of guiding an aircraft to the runway from a taxiway or vice versa when the visibility is low.
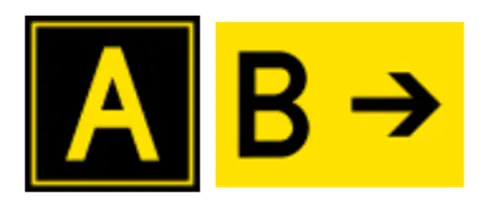
Operation guidance signs:
The 'A' symbol is a location sign for a taxiway whereas the 'B' symbol refers to the direction of the taxiway with the designation 'Bravo'.
Mandatory instruction signs:
This symbol is used as the stop sign on taxiways.

Taxiway lights:
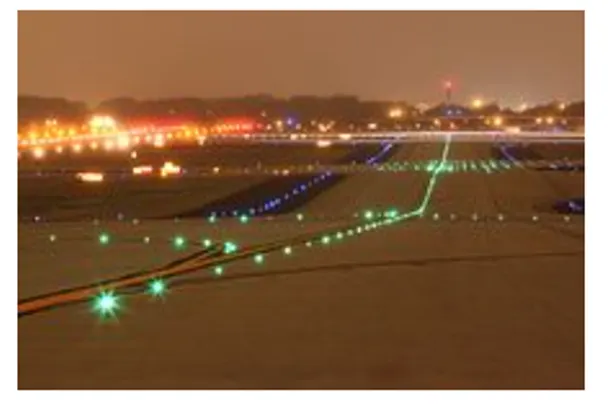
5. Learn about take off power, tyre design, rolling resistance, tyre pressure, brake forces when landing.
Takeoff Power
Takeoff is the phase of flight in which an aircraft leaves the ground and becomes airborne. To be able to takeoff, an aircraft's wings are designed with an airfoil shape which is able to generate a lift force when moved relative to the air (when the aircraft moves). This lift force is needed to lift an aircraft off of the ground during takeoff and is also needed in flight to keep the aircraft in the air. The lift force is generated because of the way in which air flows around the airfoil shape. When the airfoil moves relative to the air, a "down wash" is created which creates a pressure gradient between the top and the bottom of the airfoil. The bottom of the airfoil will experience a higher pressure whereas the top of the airfoil will experience lower pressure. Due to this pressure gradient, a lift force is generated. The amount of force that is generated depends on 3 factors:
the air speed
the angle of attack
the shape of the airfoil
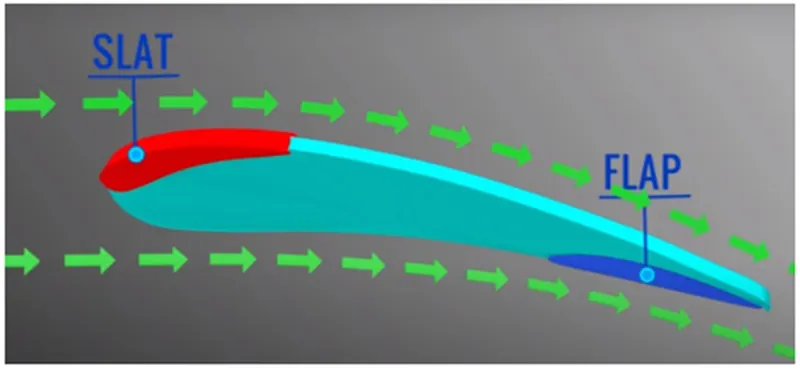
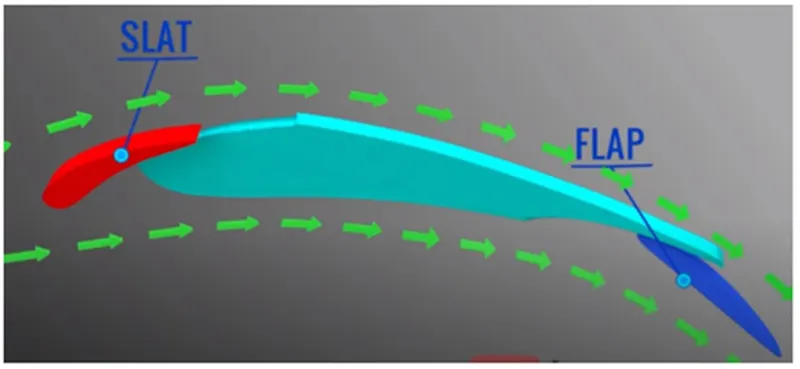
The angle between the reference line of an airfoil and the direction of the velocity of the wind is referred to as the "angle of attack". The higher the angle of attack, the greater the down wash and hence the greater the lift force that is generated. The greater the velocity of the air flowing over the airfoil will also increase the lift force. Similarly, changing the shape of the airfoil also affects the lift force. The shape of the airfoil can be altered by the use of slats and flaps. The slats and flaps increase the camber of the airfoil and allows it to generate more lift force at lower speeds. When the slats and flaps are activated, they extend and alter the shape of the airfoil in such a way that they increase the area of the wings which increases the lift force.
To control the lift force that the aircraft experiences, there are other components aside from the slats and flaps that can be adjusted. One component are the ailerons located on the wings. The ailerons have flaps also which can move up to generate less lift force and down to generate more. Other components are found at the tail of the aircraft and are called the rudders and the elevators. Adjustment of the elevators allow for the control of the vertical forces whereas adjustment of the rudder allows for the horizontal forces to be controlled.
During takeoff, the lift force generated needs to be greater than the weight of the aircraft. All the three aforementioned techniques of the airfoil are utilised to generate sufficient lift force that makes takeoff successful. First, the speed of the aircraft needs to increase by increasing the thrust force from the jet engines. This will generate some lift force but to increase it further, the pilots activate the slats and flaps. When the aircraft has accelerated to the required speed for takeoff, the pilots then activate the elevators upwards which produces a tail force tilting the aircraft upwards. In doing so, the angle of attack of the airfoil is increased, which produces a sudden increase in the lift force that makes the aircraft takeoff. An angle of attack of 15 degrees is needed for takeoff and is maintained during ascension.
The images below show the slat and flat on the airfoil. The first image shows their default position and the image below it shows their adjusted position for more lift.
Takeoff Performance
The takeoff performance of an aircraft can be predicted by measuring its acceleration on the runway and observing the forces acting on it. Using Newton's second law of motion, the resultant force, F acting on a body is given by:
F=ma
Ft−Fd−Fr=ma
a=Ft−Fd−Frm
where
Thrust force - Ft
Drag force - Fd
Rolling resistance force - Fr
acceleration - a
mass - m
This acceleration will continue until the aircraft achieves a safe flying speed referred to as the rotation velocity, Vr. At this speed, the pilot can rotate the aircraft to an attitude which will create enough lift to takeoff from the ground. The rotation velocity i.e. takeoff speed depends on various factors e.g. air density (affected by air temperature and field elevation), aircraft gross weight and the aircraft configuration (slats and flaps position). Typical takeoff speeds for commercial jetliners range from 240 - 285kmph or 149 - 177mph. For smaller aircrafts, this speed becomes lower with light aircrafts e.g. Cessna 150 having a takeoff speed of 100kmph.
Aircrafts that operate in the transport category use a system of "V-speeds" and there are 3 of them: V1, V2 and Vr.
V1 is referred to as the decision speed (critical engine speed) and it is the speed at which any decision to abort takeoff must be made. If the aircraft exceeds V1, it must continue on to takeoff unless there is a reason to believe that takeoff will be unsuccessful. For instance, if an engine failure is detected before V1, takeoff can and should be aborted. Vr is the rotational speed as mentioned before and it must be greater than V1. V2 is the takeoff safety speed which is the speed at which the aircraft must achieve at the 35 feet height at the end of the runway distance.
The rotational speed is a function of the aircraft gross weight and the flap settings but it also depends on the environmental conditions. The rotational speed is usually determined as being 1.1 times greater than the stall speed. The stall speed is the lowest speed at which an aircraft can be flown before the airflow begins to separate from the wings and the angle of attack becomes too large. Since we know that the lift force must be equal to the weight of the aircraft for a flight to be maintained at a constant level, the stall speed is calculated as shown below:
Vstall=√[(2*W)/(Clmax*ρ*A)
Where,
Stall speed - Vstall
Weight of the aircraft - W
Coefficient of lift at stall speed - Clmax
Air density - ρ
Wing area - A
The rotational speed is given by
Vr=1.1⋅Vstall
Tire Design
Aircraft tires are designed in such a way that they can withstand extremely high loads for short durations of time. The number of tires on an aircraft is proportional to its weight, meaning that the heavier the aircraft is, the more tires it will need. This is because for a given weight of an aircraft, if the number of tires is insufficient, the weight cannot be distributed evenly enough amongst the tires. The tread patterns on aircraft tires are designed in such a way that they can provide stability to flights during crosswind conditions. The tread design also helps to direct water off of the tires to prevent hydroplaning and they also aid in the braking action.
Aircraft tires are designed with fusible plugs. A fusible plug is a threaded metal cylinder made of bronze, brass and gunmetal with a drilled hole that extends through its entire length. This hole is filled with a metal of low melting point. When the temperature of the metal exceeds its melting point, this will cause the deflation of the tires. During emergency landings or aborted takeoffs, an aircraft’s wheels experience high friction with the runway surface and the use of the plugs will control the deflation of the tires in a safe manner. Without them, there is a risk of an explosion which can damage the aircraft and other nearby objects.
Tire Pressure
Aircraft tires are inflated with an inert gas and the most commonly used is Nitrogen. Inert gases are used for inflation because they are non – reactive and not flammable. When the ambient air temperature and pressure changes, the Nitrogen gas helps to minimize the expansion and contraction of the aircraft tires. Using oxygen for the inflation of aircraft tires is very dangerous since it is flammable. Using Nitrogen instead eliminates any risk of there being a tire explosion.
General commercial airliners use tires that can withstand a pressure of 800psi before they burst. A Boeing 777-300ER has 12 tires and each one is inflated to a pressure of 220psi and has a diameter of 134cm and a weight of 120kg. Each tire costs $5000 and has to be changed after 300 cycles whereas the brakes are changed every 2000 cycles.
It is very important to check that the aircraft tires have been properly inflated using a calibrated gauge. This is because aircraft tires operate at high temperatures and pressures and they do not retain their air perfectly. The tire pressure can reduce by 5% in 24 hours. Michelin, one of the 4 main aircraft tire manufacturers, recommends that the air pressure of the tires be checked before the first flight that day or before each flight if the aircraft isn’t flown daily.
It is better to check before flight rather than after because the tires need to be cold when performing the pressure check. If we were to perform the check after the flight, the tires would be very hot due to its recent usage and this makes it very difficult to determine what the proper pressure should be. Michelin recommends that the tire pressure is checked no earlier than 3 hours before a flight after it has last been in use.
When performing the pressure checks during servicing, we need to consider the ambient temperature’s effect on the tires. Every 3 degree change in the ambient temperature results in a 1% change in the tire pressure. To account for this, manufacturers such as Michelin recommend that the tires be serviced in a way that the tire pressure is overshot to 105% of the operating pressure. So it is a guideline that the highest pressure in the aircraft maintenance manual (AMM) be targeted.
There are two main types of tires used for aircraft applications:
Bias ply tire
Radial ply tire
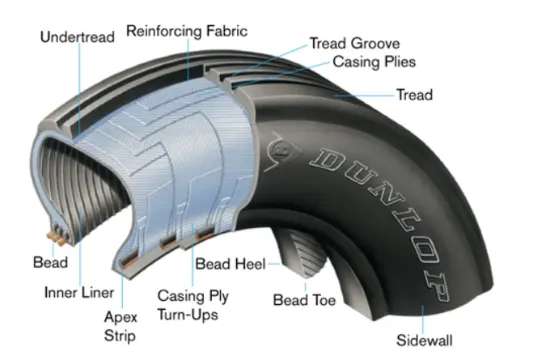
Bias ply tires are used for their long durability and hence long working life as well as for their retreadability. Their construction is explained below:
Tread
The tread is made of rubber and other additives that are used to obtain desired properties such as high durability, high toughness and high resistance to wear. The pattern of the tread has a ribbed design which helps provide excellent traction in different runway conditions whether good or bad.
Sidewall
This is a protective layer of rubber that covers the outer casing ply and it extends from the tread edge to the bead area.
Tread Reinforcing Ply
This consists of one or more layers of a fabric that strengthens and stabilizes the tread area when the aircraft ground speed is high. It also helps as a reference for the buffing process during retreading of the tires.
Buff Line Cushion
This is a cushion made of a rubbery fabric that increases the adhesion between the tread reinforcing ply and the breakers.
Breakers
These are reinforcing plies of rubber coated fabric that are placed under the buff line cushion and help to stabilize and strengthen the tread area.
Casing Plies
These are alternate layers of rubber coated fabric which run at opposite angles to each other and provide the strength of the tires.
Wire Beads
These are hoops of high tensile strength steel which anchor the casing plies and provide a firm mounting surface on the wheel.
Apex Strip
This is a wedge of rubber fixed to the top of the bead bundle. Flippers
These are layers of rubberized fabric which help to anchor the bead wires to the casing. They also improve the durability of the tire.
Ply Turnups
The casing plies are wrapped around the wire beads to anchor them which forms ply turnups.
Chafer
This is a protective layer or rubber or fabric located between the casing plies and the wheel to keep chafing to a minimum.
Liner
In a tubeless tire, the liner is a layer of low permeability rubber that acts as a built in tube and prevents the diffusion of gas in to the casing plies. In tube tires, the liner layer is thinner to prevent chafing between the tube and the inside ply.
The image below shows a diagram of a bias ply tire.
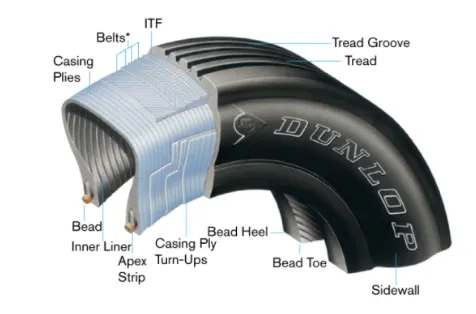
Radial ply tires are used in aircrafts because they have a rigid belt that allows them to be used for increase landings and have lower rolling resistance than bias ply tires. They also weigh lesser than bias ply tires and have fewer components and are yet the same size. The different components of radial ply tires is mentioned below:
Overlay
This is a layer of reinforcing rubber coated fabric which is placed on top of the rigid belts and help them when aircrafts move with high ground speed.
Belt Plies
This is a composite structure which stiffens the tread area and increase the tire strength in the tread are for increased landings.
Casing Plies
These are the same as those found in bias ply tires in that they consist of layer of rubber coated fabric. But instead of running at opposite angles to each other, these run radially from the bead to the head.
Chippers
These are layers of rubber coated fabric which are applied at diagonal angles to improve the durability of the tires in the bead area.
The image below show a diagram of a radial ply tire.
Rolling Resistance
The rolling resistance or rolling friction is a force that resists the motion of a body that rolls on a surface. In the case of aircrafts, the rolling resistance force exists between the aircraft tires and the runway surface it rolls upon. For a given body, its rolling resistance is mathematically expressed as the product of the coefficient of rolling resistance and the normal force, which is the force that is acting perpendicularly to the surface on which rolling action occurs.
Frr=μrr*N
Where
Rolling resistance - Frr
Coefficient of rolling resistance - μrr
Normal Force - N
Braking Forces
Aircrafts use brakes mainly during the landing procedure. During braking, the kinetic energy of the aircraft is converted to heat energy when friction occurs between the aircraft tires and the runway surface. Braking is a very crucial part of flight because there is only a limited distance on the runway that the aircraft can use to reduce its speed. Braking has to be done in such a way that the aircraft or its passengers or its equipment does not get damaged in the process. There are a few different systems that an aircraft uses to perform braking.
Working of Disc Brakes
The main brake that is used on an aircraft is the disc brake which work by manipulating the friction between the stationary disc and rotating disc found inside the disc brake. First, a command signal is sent to the disc brakes by the pilot pressing the brake pedal in the cockpit. This causes the actuators in the brake to move a piston to squeeze the stationary and rotary discs together. This creates a frictional force which is used to slow down the tires and hence the aircraft. As the friction in braking generates high amounts of heat energy, the disc brakes are designed as heat sinks to absorb this heat. Temperatures of the disc brake can reach 1800 degrees Celsius.
The disc brakes are found on a carrier assembly which consists of a torque tube that transmits braking torque to the landing gear. Placed between the carrier assembly and a backing plate, the discs are arranged in an alternating pattern of stators and rotors. Each rotor has grooves and notches that allow it to fit in with a wheel with corresponding geometry so that the rotor rotates with it. The stators are fitted to the torque tube and is stationary because the torque tube is connected to the axle and the landing gear structure both of which are stationary. Cylindrical spaces in the carrier assembly contain the pistons which move to cause the squeezing of the two discs bringing about braking.
Design of Brakes
The main design considerations of the disc brakes are the number of discs they will hold, the diameter of the discs, and their material. The brakes are also designed considering worst case scenarios. One such scenario is when takeoff is aborted at the decision speed, V1. If V1 was exceeded, then the aircraft cannot safely abort takeoff because it is at risk of not being able to stop before the end of the runway. In that scenario the brakes would need to be able to absorb more kinetic energy than in any other worst case scenario. Consider this scenario with an Airbus A380 which is the world’s biggest passenger plane. Its specifications are mentioned below:
Maximum Takeoff Weight (MTOW) = 575000kg
Maximum Decision Speed, V1 = 170 knots (195mph or 87 m/s)
Number of Disc Brakes – 16
We need to calculate the kinetic energy of the aircraft ignoring the effect of air brake reverse thrust headwinds and tailwinds.
Ek=(1/2)*m*v^2
Ek=(1/2)*575000*(87)^2
Ek=2.2GJ
This is the amount of energy that is required by the combined efforts of all brakes to completely brake the aircraft.
To be able to generate this much frictional force, there are multiple discs per brake are needed and brakes need to be on most, if not all of them. An A380 has 22 tires that are distributed on 5 landing gear legs. Two wheels support the nose on a leg, eight wheels split between 2 legs to support the left and right wings, and 12 body wheels split between 2 legs under the fuselage. Only 16 of these 22 wheels have brakes.
Each of the 16 brake assemblies has 5 rotors made of Honeywell Carbenix 4000 carbon – carbon composite. The brake assemblies within the wheels are made of 2014 T-6 aluminum alloy and are attached to the axle and landing gears which are made of 300M high strength alloy steel, titanium and aluminium components.
Materials
Until 1963, the most common material used in brake discs was steel. Later, Beryllium was used instead because of its better thermal properties however it was expensive to handle since its oxide was toxic. Eventually, the industry shifted towards carbon brakes. They are made of carbon fibers in a graphite matrix. They were used because they were lighter, more durable and were less thermally sensitive. They also had higher absorption of thermal energy and cooled faster than compared to steel brakes. Carbon has a higher specific heat of energy compared to steel meaning this can reduce the brake weight. Carbon has a higher thermal conductivity meaning the heat will be distributed uniformly throughout the disc. It has a lower thermal expansion, higher thermal shock resistance and a higher temperature limit than steel. In addition, carbon’s specific strength remains consistent under different temperatures unlike Steel and Beryllium can.
Brake Cooling
Brakes need to cool due to the high heat buildup and they do this in two main ways:
Passive cooling
This cooling occurs via natural conduction from the brake disc material to the surrounding components. Cooling occurs via radiation of heat that comes off the brakes as well as by natural convection as air flows past and through the brake assembly.
Active cooling
This is done using fans that force air through the brakes to cool them down.
6. A. With necessary assumptions, calculate the force and power required to push / pull an aircraft by a towing vehicle
Let us Assume :
Weight of the Aircraft = 500000kg
Rolling Resistance Coefficient of an aircraft tire = 0.005
Wight of the Towing Tractor = 50000kg
Rolling Resistance Coefficient of Towing Vehicle = 0.002
The Velocity of the Aircraft while Towing = 18KMPH = 5m/s
Density of Air medium = 1.225 kg/m^3
The Frontal area of the Aircraft = 20 'm^2'
The Coefficient of Drag of the Aircraft = 0.26
Towing Tractor Gear ratio(G- for high torque output) = 11
Towing Tractor tyre radius(r) = 0.5 m
The forces that are acting on the aircraft are
- i) Rolling Resistance
- ii) Drag Force
- i) Rolling Resistance for the Aircraft
Now, Here the Rolling resistance be
Fr = c* mr* ag
Let,
Fr = Rolling resistance
c = coefficient of rolling resistance
mr = rolling mass
ag = Acceleration of gravity
Now Substituting the values in the above formula gives us the Rolling resistance of the Aircraft
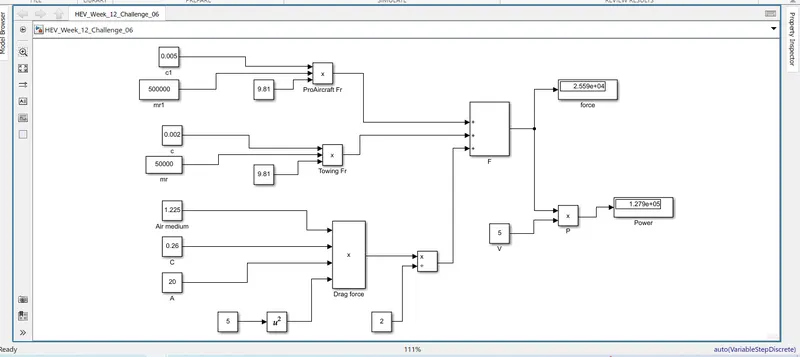
Fr = 0.005(500000 kg)(9.81 m/s^2)
Therefore the Rolling resistance of the aircraft Fr = 24.525 KN.
Rolling Resistance for the Towing Vehicle
Now let us calculate the rolling resistance for the Towing Vehicle
Fr = c* mr* ag
Fr = 0.002(50000 kg)(9.81 m/s^2)
Therefore the Rolling resistance of the Towing vehicle Fr = 0.981 KN.
- ii) Drag Force
D=(1/2)*Cρ*A*V^2
Where,
D = Drag force
C = Drag Coefficient
V = Velocity of Towing Vehicle
A = Frontal area
Now Substituting the assumed values in the above formula gives us the Drag force of the Towing vehicle
Drag Force = 0.5 * (0.26*1.225*20*5*5)
= 0.079 KN
Therefore the Drag force is = 0.079625 KN
Now to get the total force to push the aircraft by the towing vehicle
we add the Rolling resistance of the Aircraft + Rolling resistance of Towing Vehicle + Drag Force
= 24.525 KN + 0.981 KN + 0.079625 KN
Therefore the Total force required for a towing vehicle to push the aircraft is = 25.585625 KN = 25585.625 N
Power required to the towing vehicle to pull the aircraft
In this case, Power = force * velocity
= 25.585625 * 5.0
= 127.928125 KW
Therefore the power required for the towing vehicle to pull the aircraft = 127.928125 KW = 127928.125 W
Simulink model for the calculation of the force and power
7. A. Design an electric powertrain with type of motor, it’s power rating, and energy requirement to fulfill aircraft towing application in Simulink. Estimate the duty cycle range to control the aircraft speed from zero to highest. Make all required assumptions. Prepare a table of assumed parameters. Draw a block diagram of powertrain.
(Hint :DC7 Block)
B. Also, Design the parameters in excel sheet.
Let us Assume :
Weight of the Aircraft = 500000kg
Rolling Resistance Coefficient of an aircraft tire = 0.005
Wight of the Towing Tractor = 50000kg
Rolling Resistance Coefficient of Towing Vehicle = 0.002
The Velocity of the Aircraft while Towing = 18KMPH = 5m/s
Density of Air medium = 1.225 kg/m^3
The Frontal area of the Aircraft = 20 'm^2'
The Coefficient of Drag of the Aircraft = 0.26
Towing Tractor Gear ratio(G- for high torque output) = 11
Towing Tractor tyre radus(r) =0.5 m
Operational time of the Towing for one cycle = 0.25 Hour (15min)
Power converters used Bidirectional DC-DC Boost Converter
We taking calculated values from above quation -
Total force required to a towing vehicle to push the aircraft is = 25.585625 KN = 25585.625 N
Power required for the towing vehicle to pull the aircraft = 127.928125 KW = 127928.125 W
Torque Required with the wheels of towing vehicle to push the aircraft
Torque = force * ( radius / Gear ratio )
= 25.585 * ( 0.5 / 11 )
Torque = 1.1629 KNm
Therefore the Torque required to the towing vehicle to push the aircraft = 1.1629 KNm
- i) Energy Requirements :
The Energy requirement for an EV similar to the Towing vehicle to Push/Pull the aircraft is calculated on the Basis of Time
Let, Energy = Power x Time taken by the towing vehicle to push/pull the aircraft
So, Energy = 127.928 x 0.25
= 31.982 KWh
Therefore power required for one single towing is = 31.982 KWh
Therefore the battery must be able to store the energy 31.982 KWH and should deliver the energy throughout the run time in order for the motor to produce the 1.1629 KNm of torque . Thus the storage of energy in batteries with high performance Ultracapacitors are selected to fulfill the required power deliver.
Motor Selection :
Here we have selected a Permanent-Magnet Synchronous Motor (PMSM) type that has a power rating of 127.928 kw and with the gear ratio and the transmission it should be able to deliver 1.1629 KNm of torque instantaneously.
Motor Parameters :
Type = PMSM
Model No. = APEV80- 12(16)
Phase = 3
Application = Electric bus, Truck , passenger car
AC Voltage = 200-750
Pole = 12
Direct Current Voltage (VDC) = 540
Rated current (A) = 255
Peak Current (A) = 650
Rated Power (kW) = 150
Peak Power (kW) = 220
Rated Speed (RPM) = 1,650
Peak Speed (RPM) = 3,300
Rated Torque (N.m) = 868
Peak Torque (N.m) = 3,000
BEMF (VAC)/rpm = 660/ 2401
Insulation Grade = H
Protection Class = IP67
Cooling = Water
Weight (Kg) = 260
Efficiency of motor = 90 % (Assumed Parameter)
- ii) Duty Cycle :
Here in this case the Duty cycle of the electric power train is calculated by the output power by the input power.
By this we get the efficiency of the duty cycle,
Duty Cycle = Output Power / Input Power
We Know that,
Output Power = 127.92 kW
Input Power = Rated Motor Power / Motor Efficiency = 150 / 0.9 = 166.666 kW
Then the Duty Cycle is = 127.92 / 166.666
= 0.76
= 76 %
Therefore the Efficiency of the Duty cycle that we get for this electric power train is = 0 to 76 %
Block Diagram of powertrain