Project 1 - Patient monitoring system Design - Electronic System part
Patient monitoring system is an application which continuously/periodically monitors and collects patient vitals viz., SPO2, ECG, Temperature, Pulse rate etc., and displayed on a monitor as well as save for recording purposes. This is a Class-1 medical device approved for hospital use.
What Is Patient Monitoring?
Continuous measurement of patient parameters such as heart rate and rhythm, respiratory rate, blood pressure, blood-oxygen saturation, and many other parameters have become a common feature of the care of critically ill patients. When accurate and immediate decision-making is crucial for effective patient care, electronic monitors frequently are used to collect and display physiological data. Increasingly, such data are collected using non-invasive sensors from less seriously ill patients in a hospital’s medical-surgical units, labor and delivery suites, nursing homes, or patients’ own homes to detect unexpected life-threatening conditions or to record routine but required data efficiently. We usually think of a patient monitor as something that watches for—and warns against—serious or life-threatening events in patients, critically ill or otherwise. Patient monitoring can be rigorously defined as “repeated or continuous observations or measurements of the patient, his or her physiological function, and the function of life support equipment, for the purpose of guiding management decisions, including when to make therapeutic interventions, and assessment of those interventions” (Hudson, 1985, p. 630). A patient monitor may not only alert caregivers to potentially life-threatening events; many also provide physiologic input data used to control directly connected lifesupport devices.
These days, the expansion of innovations by wellbeing specialists is exploiting these electronic devices [1]. IoT devices are profoundly utilized in the clinical area. In this paper, the research is about an IoT-based health monitoring system. In particular, for COVID-19 patients, high blood pressure patients, hypertension patients, diabetic patients, etc., in a country territory, in rural areas, the number of doctors is not exactly the same as in urban areas. Medical equipment is not readily available in rural areas, except for government medical centers. The percentage of patients in these clinics is greater than that in government medical facilities. Similarly, the equipment has, for the most part, ended. As a result, if an emergency situation arises, this hardware component will send a report to the physicians or medical professionals as soon as possible. The remaining work will be done by doctors based on their reports. The IoT health-monitoring platform has provided us with a significant benefit in the advancement of contemporary medicine. IoT devices are widely used in the medical sector. And the technology we are talking about is a patient health monitoring system that uses the IoT. A sensor in this health monitoring system will collect information about the patient’s health condition. It is smaller in size, faster, and more affordable. This system can be used to measure the oxygen saturation level, heart rate, and temperature of the human body and display the results on a web-based platform. The physical, logical, and application layers are the three layers of the system. It is a multiparameter monitoring system that will monitor oxygen saturation level, heart rate, and temperature simultaneously.
To begin with, as an apparatus layer that enables connections through the use of sensors and improvements, heart rate, oxygen saturation level, respiratory flow rate, temperature, and other parameters are all measured using sensors. The primary goal of this IoT is to enhance a cosmology-based response with the ability to track the state of health. One of the “important indicators,” or important measures of wellbeing in the human body, is heart rate. It counts how many times the heart contracts or beats per minute [2]. Because of continuous work, security threats, and passionate responses, the heartbeat speed changes. The resting pulse refers to a person’s pulse while he or she is relaxed. While relaxing, a person’s pulse rate should be between 60 and 100 beats per minute after the age of ten. During exercise, the heart beats faster. There is a recommended maximum heart rate that varies based on the person’s age. It is not just the rate at which your heart beats that matters. The heartbeat state is also important, and an irregular beating can indicate a serious medical problem. The heart is a powerful organ located in the center of the chest. When the heart thumps, it transports oxygen- and nutrient-rich blood around the body while also returning waste products. A healthy heart supplies the body with just the appropriate amount of blood at precisely the right time for whatever it is doing at the time. The pulse is frequently confused with the heartbeat, which refers to how often the supply pathways expand and contract as a result of the heart’s siphoning activity. Because the compressions of the heart create the expansion of pulse rate in the channels that lead to a noticeable pulse, the beat rate is probably the same as the pulse. Measuring the pulse is an instantaneous percentage of the heart in this method. The typical pulse rate for adults over the age of ten, especially elderly people, is somewhere between 60 and 100 beats per minute (bpm). Competitors who have been thoroughly prepared may have a resting pulse of less than 60 beats per minute, with some reaching 40 beats per minute. It is noticed that the heartbeats of the patients change continuously. The heart rate is not stable for patients with chronic diseases like asthma, hypertension, heart disease, Chronic Obstructive Pulmonary Disease (COPD), etc. In addition, for the COVID-19-affected people, the heart rate also varies very quickly. It is critical to keep track of these patients’ heartbeats in real time, which can be done with the help of an IoT-based real-time patient monitoring system.
While individuals with coronavirus illness feel ill, their oxygen levels are often insufficient [3]. Low oxygen levels could be a precursor to the need for medical intervention. Pulse oximetry is a technology for determining the amount of oxygen-carrying hemoglobin in the blood. Most people consider it to be a vital indicator, analogous to blood pressure. With the help of a pulse oximeter, a light emission passes through the fingertip. By measuring how much light is taken in as it passes through the fingertip, the oxygen level, or saturation (SpO2), is managed. In any case, normal SpO2 levels for humans are often greater than 95%. A small number of patients with chronic lung disease or sleep apnea may have normal values of approximately 90%. A clinical expert should be counseled for SpO2 perusing underneath pattern or per office convention if the patient is a drawn-out consideration office occupant or has been recently assessed by a doctor for coronavirus-related concerns. Supplemental oxygen or different medicines may be required. Others in the network should contact a medical care supplier in the event that they experience wind or when the estimated SpO2 is less than 95%. The CDC identifies serious sickness from coronavirus in individuals who have a respiratory recurrence of more than 30 breaths every moment, SpO2, and a lower than 94% at room air adrift level (or, for patients with ongoing hypoxemia, an abatement from the pattern of more than3%). There are many patients with chronic diseases like asthma, COPD, and heart-related problems in the world. In COVID-19-affected people, the SpO2 level changes very rapidly and, without continuous monitoring, can cause death as well. It is essential to keep continuous real-time monitoring of the SpO2 level of the above-mentioned patients. Body temperature is another vital physiological parameter of humans. People with illnesses find it very essential to monitor their body temperature. High fever is one of the main symptoms of COVID-19 patients. It is very important to monitor the body temperature of such patients continuously. An IoT-based real-time SpO2 level, heart rate, and temperature monitoring system is very helpful now in the modern age. This motivates the development of an IoT-based health monitoring system.
Due to IoT-based health monitoring systems, it has become possible for users to get the necessary physiological information while sitting at home. This system has made life easier for elderly patients, as for them, the long way to the hospital can be both difficult and tiring. In this paper, we have chosen some specific sensors to detect certain problems. The system will collect data on the patient’s heartbeat, oxygen saturation level, temperature, and other parameters.
IoT-based patient monitoring systems using sensors to detect, evaluate, and monitor two basic vital signs are discussed in a paper [4]. They used the Arduino Mega 2560 and ESP8266 Wi-Fi Module and two sensors modules to design an IoT-based patient monitoring system that can detect two primary vital signs of body temperature and respiratory rate, analyze the level of vital signs according to the patient’s age, provide alerts for abnormal conditions, and display the results wirelessly through Android apps. Wearable IoT-enabled real-time health monitoring system [5–9] is another work, in which the authors developed a wearable IoT-cloud-based health monitoring system for real-time individual health monitoring. The researchers used a variety of wearable sensors, including heartbeat, body temperature, and blood pressure monitors. Another example is a review of IoT-based health monitoring systems using Raspberry Pi, LPC2129, and wearable biomedical devices [10], in which researchers discussed IoT-based health monitoring systems utilizing Raspberry Pi, LPC2129, and wearable biomedical devices. An Android-based pulse monitoring system is presented in [11]. In [12], the author uses both MAX30100 and Lm35, so the author is measuring, but they show the value on the website, not on the mobile applications that are more widely available to people nowadays. The papers [1, 13] and [14] measure heartbeat and body temperature but not the oxygen level and also do not show the data in the mobile app or on the LCD display. The author of the paper [13] also measured the electrocardiogram (ECG) parameters alongside body temperature and pulse rate and showed the data on a web-based platform. Finally, in [14], the author measures everything except SpO2 and does not display the results on a mobile application. In the paper [14], the authors made this system using a different microcontroller called the ESP32, and the health parameters they discussed were body temperature and heart rate. All of them measure the heart rate and body temperature, but we also need to measure the oxygen level in our body. In the paper [15], the author used the ESP32 to connect the sensors, not the Arduino Uno. In the paper [16], the author measured body temperature and heart rate and showed the data on a website platform. In the paper [17], the author measured respiration rate alongside body temperature and heart rate and showed the value on an LCD display. In the paper [18], the author developed a system to calculate the heart rate, body temperature, and respiration rate, and the measurements will be shown in the mobile application. The author of the paper [19] introduced a solution that uses a Raspberry Pi microprocessor to record the patient’s pulse rate and blood pressure and is wearable. In the paper [20], the author has made a system that can measure body temperature, heart rate, diabetes, BP, and cough detection and send the data to a mobile application as well as a wearable device. In [21], the authors have not used mobile applications in their design. In the paper [22], the author measures heart rate, body temperature, and blood pressure using an Arduino Mega. T. Y. Hoe et al. introduced a patient-centered IoT-based ECG monitoring system. In this case, the researchers only employed an ECG sensor to measure the ECG of patients [23]. In this study, the sensor is limited.
The development of an IoT-based health monitoring system is described in this study. The paper’s main contribution is to create an IoT-based real-time health monitoring system. Various sensors have been used to measure the data of patients in real-time. A mobile application has also been developed. It was tested after the entire system had been developed. In this investigation, three separate real-life human test volunteers were used. In a country like Bangladesh, where most people from rural areas do not get enough medical facilities or cannot do regular testing of various types of health parameters such as pulse rate, oxygen level, body temperature, blood test, ECG, and diabetes. Since regular testing is quite costly, people from rural areas cannot go to hospitals or medical centers daily. In Bangladesh, especially in remote areas, healthcare facilities are not available. People need to travel a very long distance to get medical testing and treatment services. This system will help people who can not afford regular checkups such as pulse rate, oxygen level, and body temperature. This system is not only cost-friendly, but also easy to use. Our system will be helpful to all ages of people, particularly the elderly or Intensive Care Unit (ICU) patients. It will measure the heartbeat, oxygen saturation level, and body temperature of the patient and transfer the outcome to the web server and mobile applications.
A patient monitoring system is a system or device that helps healthcare providers to monitor physiological signals of a patient's health. It is used for observation and measurement of patient's health parameters such as heart rate, respiratory rate, temperature, blood-oxygen saturation, and many other parameters of critically ill patients. Such accurate and immediate information are useful for making crucial decision for effective patient care.
WHAT IS A PATIENT MONITOR?
A patient monitor is a device used to record, measure and display multiple biometric values such as heart rate, blood pressure, body temperature, SpO2 and more. The patient monitoring device can be used to monitor the health conditions of infants as well as adults.
HOW TO READ A PATIENT MONITOR?
The sensors connected to the patient's body carry the information that is displayed on the patient monitor. You can read the parameters such as heart rate, blood pressure, body temperature, oxygen saturation displayed on the machine. Here's how you can interpret the numbers shown in the display -
Heart Rate: Typically, the resting heart rate of a healthy adult is between 60-100 beats per minute.
Blood Pressure: Blood pressure numbers in the range 120/80 are considered to be normal.
Body Temperature: Temperature is reported in degrees Fahrenheit or degrees Celsius. It can be anywhere from just under 98 degrees F to a little over 99.
Oxygen Saturation (SpO2): It is the measure of the amount of oxygen in the patient's blood. The SpO2 is normally 95 or higher.
Respiratory Rate (RR): A resting adult typically breathes 12 to 16 times a minute. It is reported in breaths per minute.
DEVICES IN AN IMPLEMENTATION
In order to implement the health analysis system, it is necessary to identify the necessary health issues for maintaining them. Usually, these sensors like temperature sensor, BP sensor, heart rate sensor, an ECG sensor, acceleration sensor, raspberry Pi with GSM have discussed in the following.
A. ECG sensor
Electrocardiography (ECG) is used to record heat-beat activities through on the top of the skin. It can detect a change of an electric cylinder every minute on the top of the skin. An ECG amplifier is the responsibility to get qualified data. An electrocardiogram is a graphic tracing of voltage produced by heart muscle during heart rate. ECG is used to measure the heartbeat by using MCU. Heart rate calculation is the main focus by the electrodes is simplified to two connections, one for the right hand and the other for the other.
B. Heartbeat sensor
It is used to measure the heartbeat of the patient. Here, the heart rate sensor uses + 5V DC voltage. This gives the digital result, which is placed on the hand artery nerves. This works on the principle of light modulation through the blood flow of the arterial nerve at each pulse. The heart rate should be between about 60-100bpm.
C. Blood pressure sensor
Hypertension sensor measures blood pressure, including systolic, diastolic pressure and pulse rate of the body. This approach provides accurate and reliable results than the sphygmomanometer. The existed procedure used airborne gall bladder armor and a stethoscope to measure the blood pressure. In general, blood pressure sensors gather the blood pressure from the vessel walls or arteries.
D. Temperature sensor
This sensor measures the body temperature with a voltage. The sensor LM35 has an advantage about conversion from Kelvin to the centigrade, and is also suitable for wireless applications and which is better than the thermostat.
E. Acceleration sensor
The accelerometer sensor ADXL335 used here is a full -3-axis accelerometer with small, thin, low power, signal outputs. This measures the full range of acceleration (± 3g). This sensor is able to find the gravitational fixed-acceleration in various applications. The user sensor uses the X, Y and Z capacitors at XOUT, YOUT, and ZOUT pins. Bandwidths range from 0.5 Hz to 1600 Hz for X and Y axes, and range from 0.5 Hz to 550 Hz for Z Axis.
F. Respiration
This sensor is able to finds breaths per minute in humans. The regular respiratory rate of humans is 12 to 18 breaths per minute. Below the 10-year-old children will breathe 30 to 60 per minute. Here, two sensors used to measure the breath, which connected with the resistor bridge network. The bridge network terminals are used to connect the LM741 amplifier by an inverting input terminal.
Block Diagram
The system’s structure is depicted in Figure 1. Here, patients will measure their pulse rate and SpO2 using the max30100 sensor and body temperature using the Lm35 sensor, and patients can see measurement data in the mobile app and LCD display. The data will be shown in the mobile app with the help of a Bluetooth module that will receive data from the Arduino and save it in the cloud. From there, the data will be transferred into the mobile application, and the patients can view the measurement of the health parameters. After measuring the physiological vital data of the human body, it will be sent to the Arduino UNO, which will process the analog data into digital. After that, the data via Bluetooth module will appear on the mobile application. Measured data from the human body can be seen on the LCD display as well.
Hardware Design
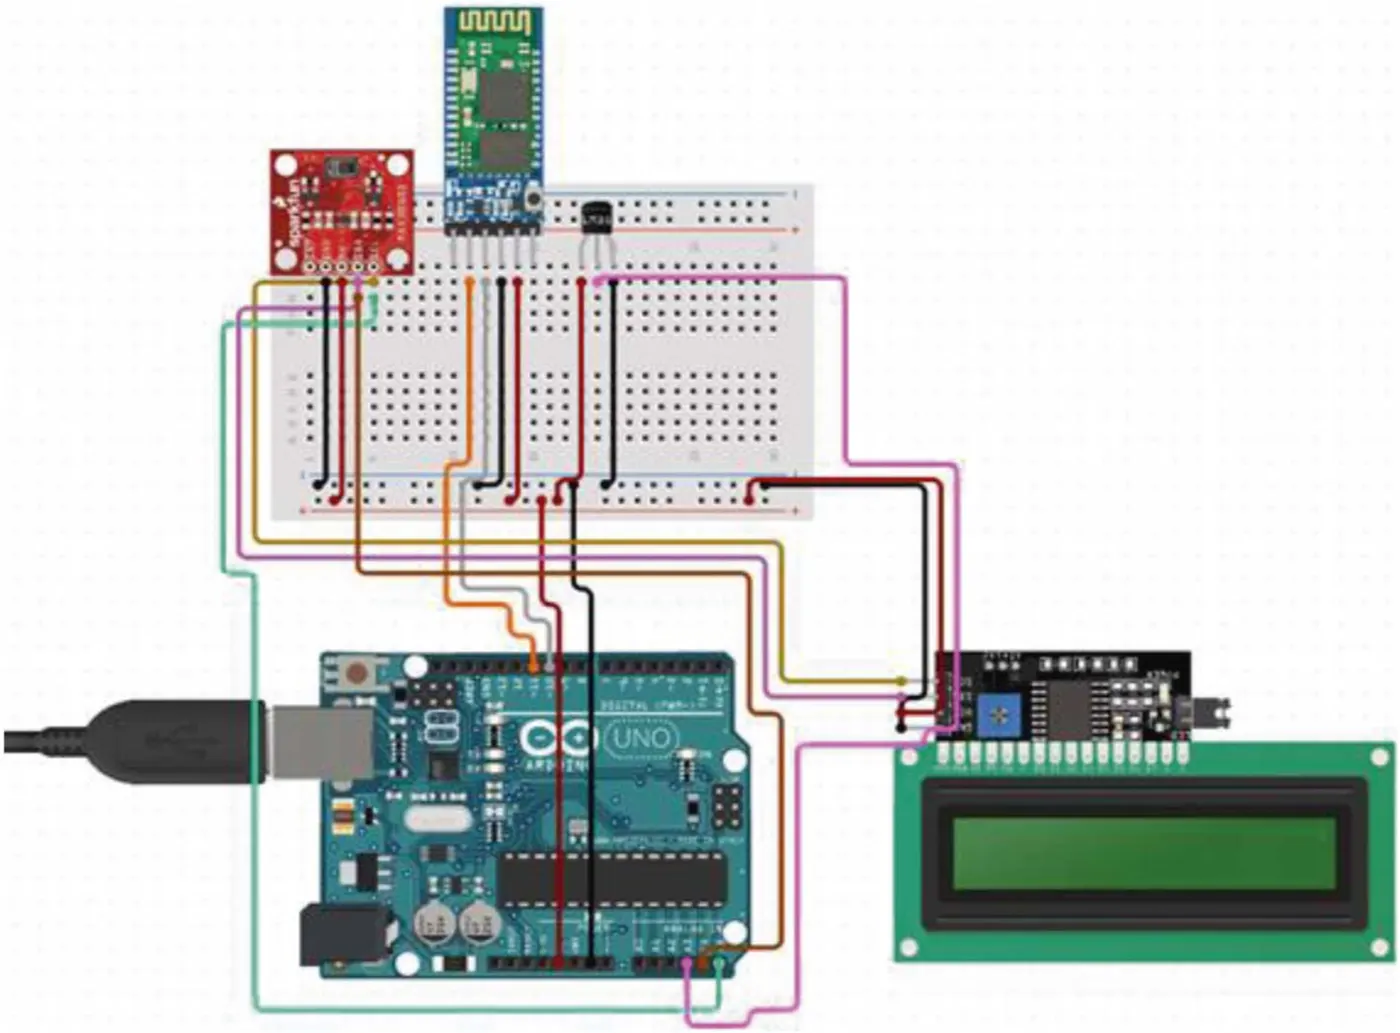
This health monitoring system consists of sensors and a microcontroller. We used the Arduino Uno as the microcontroller, and the sensors are MAX30100 (pulse rate and SPo2 measurement sensor) and LM35 (body temperature measurement sensor). And there are more components we are using, such as an HC-05 (Bluetooth module), to connect the Arduino with the mobile application and LCD display. All the needed components for the health monitoring system are described
| Components | Description |
| Arduino Uno | An open-source microcontroller based on the 8 bit ATmega238p microchip. It will work as an interface between the sensor and the mobile application described in this paper. This consists of additional components that help the microcontroller, such as a crystal oscillator, serial contact, voltage controller, etc. The Arduino Uno has 14 pins, including 6 pins for analog input, a link to the universal serial bus (USB), an ICSP header, and a reset button. The Arduino Uno provides an ICSP case. |
| Max 30100 | The MAX30100 is a pulse oximetry and heart rate monitor sensor that can be powered by 1.8 V or 3.3 V power supply. A host microcontroller uses the I2C interface to communicate. The MAX30100 pulse oximetry subsystem consists of the ALC, a 16 bit sigma-delta ADC, and a patented disconnected time filter. It is ultra-low-powered, making it suitable for systems operating on batteries. |
| LM35 | The LM35 is an integrated circuit temperature sensor with a temperature-dependent output voltage. It’s a compact, low-cost IC that can determine temperature anywhere between -55 and 150 degrees Celsius. It can easily be interfaced with any ADC or development platform, like an Arduino microcontroller. It can be linked. |
| Bluetooth module HC-05 | The HC-05 is a module that can provide wireless functionality. We are using this module to set up communication between the Arduino and the mobile application. The HC-05 module can easily be coupled with microcontrollers because it uses the serial port protocol (SPP). Power the module simply by using +5V and connecting the module’s rx pin to the tx and the tx module pin to the MCU rx, as shown below. |
| LCD display | A 16 × 2 LCD display with I2C can show 16 characters in 2 lines. This means that you will only have four pins for the LCD display: VCC, GND, and SDA, as well as SCL. |
| Jumper wires | Without the requirement for soldering, flexible wire with connections on each end can be connected to other jumper wires or a pin header. |
| Bread board | It’s a construction base. |
The circuit diagram for the system. An Arduino Uno microcontroller, two sensors (MAX30100 and LM35), a 16 × 2 I2C LCD display, and a Bluetooth module make up the circuit. The whole system is powered by 5V. The microcontroller (Arduino Uno) is connected to the computer using a USB (Universal Serial Bus) that sends commands to the device. The circuit was designed on an online circuit designing app called circuito.io.
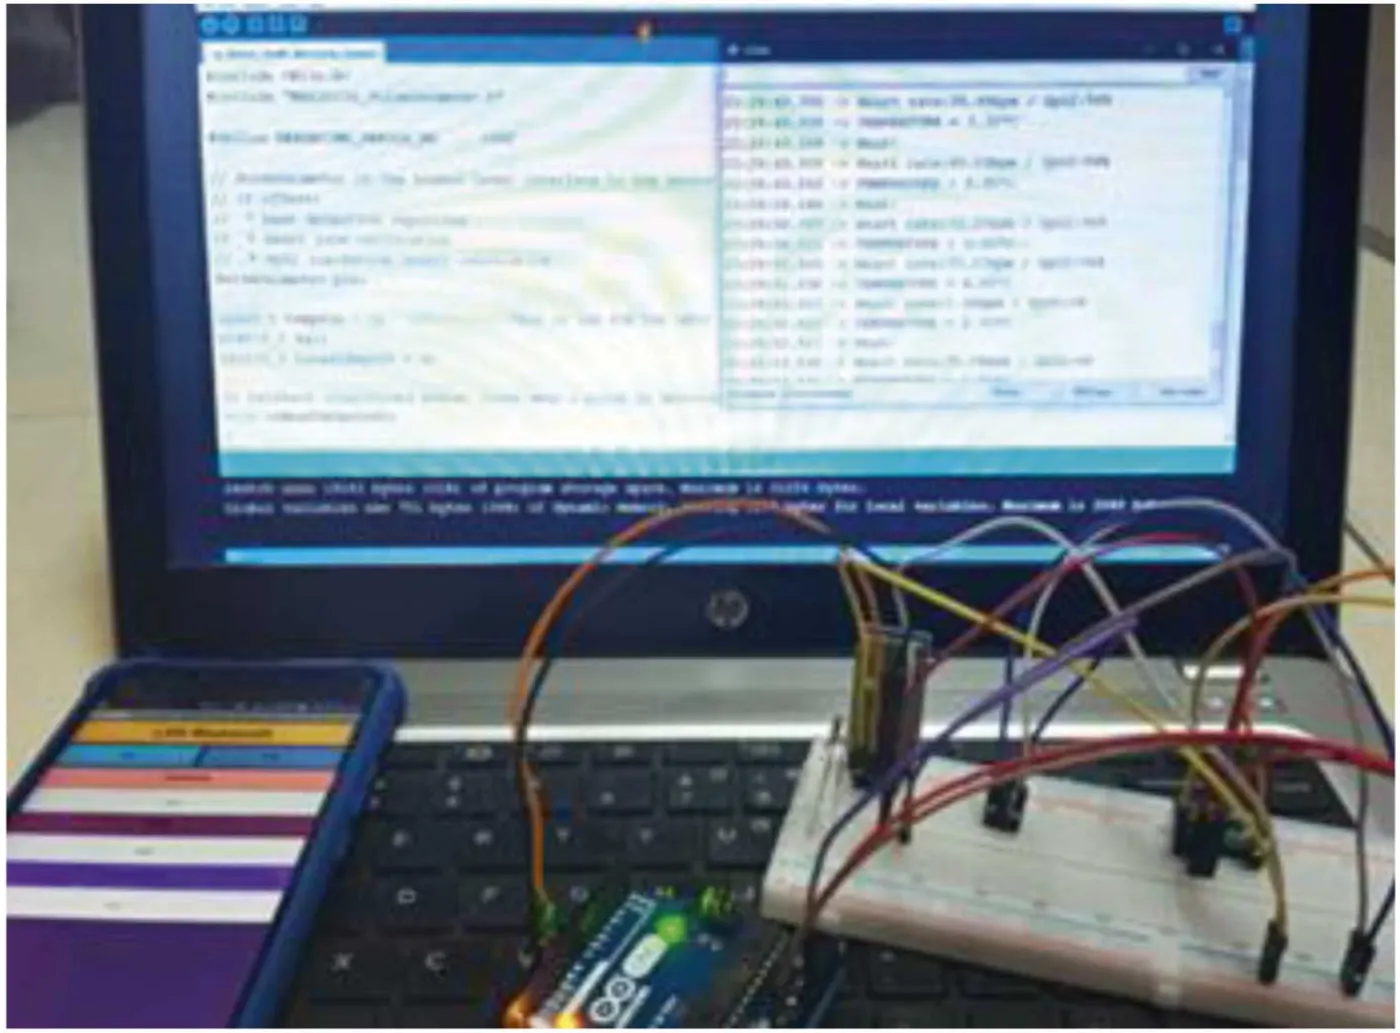
The prototype of the whole health monitoring system. In Figure 3, the connections between the sensors, Bluetooth module, and microcontroller are shown, as is the connection between the microcontroller and a device using a USB. Also, the data is received in the mobile application, and the serial monitor of the Arduino IDE is shown in Figure 3. The circuit is mainly made with an Arduino Uno and two sensors that can measure three human body parameters. A 5 V power supply powers the sensors, LCD display, and microcontroller. The microcontroller is connected to a laptop using a USB that sends commands to the sensors. There is also a Bluetooth module that helps mobile applications read data from the system .
Software Materials
The mobile application was developed by the MIT inventor App. After developing the application, we simply load it onto the mobile device, and a link will be provided to download the application. After connecting the Bluetooth device to the application through scanning with the mobile, a connected message will be viewed. Then, after performing the required process, we can show our collected results on the screen. Users will use the visual block language to build applications by dragging and dropping components into the design view. This tool enables individuals worldwide to create digital solutions to pressing problems. With the help of the Bluetooth module HC-05, the microcontroller will now be connected to the mobile application. Figure 4 showcases the system from the MIT inventor’s view.
Result and Analysis
The system created for this research study is shown in this section, along with the results obtained by the system. The completed system consists of the pulse rate and SpO2 sensors and the body temperature sensor connected to an Arduino Uno. The Arduino is connected to a device with the help of a USB, which will help power up the system. When we upload data to the Arduino, the system starts working, and the measurement data will be shown in the serial monitor of the Arduino Integrated Development Environment (IDE) and the Liquid Crystal Display (LCD) display, and the data will also be shown in a mobile application with the help of a Bluetooth module.
The full system diagram is shown in Figure 5, including the measurements of the pulse rate, SpO2, and body temperature, shown in the serial monitor of the Arduino IDE and in the mobile application. Figure 6 shows the data of the measurements of all the parameters in the serial monitor of the Arduino IDE. The data value is taken from the sensors MAX30100 and LM35.
The Bluetooth in the system is turned on or off via the options in Part “LED Bluetooth” in the mobile application. Before turning the Bluetooth “On,” a default sign “--” representing nil will show on the screen for heartbeat, SpO2, and temperature measurement. Figure 8 shows the diagram showing measurements in the mobile application after Bluetooth is “on.” When we turn the Bluetooth “on” in Figure 8, the data will be sent into the IoT system we built via the Bluetooth device. After collecting the data, the collected results will be visible in the mobile application. It might take a moment of time, depending on the available data connection. In Figure 8, the measured heartbeat, Spo2, and temperature are displayed on the mobile application.
we examined an individual to measure their heartbeat, Spo2, and body temperature. We addressed this individual as “Patient 1.” In the figure, their immediate data is collected and shown in the mobile application. The data shows that “Patient 1″ has normal health and nothing to be concerned about. And thus, they do not need to contact medical assistance.
we examined an individual whom we will refer to as “Patient 2.” A similar process to “Patient 1″ has been followed, and thus, their health data was determined. However, we could see that their body temperatures were unusually high. It might mean that this individual has a high fever. Thus, this individual could monitor their health instantly and get medical assistance over the following days. If their heartbeat rate goes high or low, they could contact doctors with their data over the course of testing.
we examined ‘‘Patient 3’’ to measure their health data in the same pattern. ‘‘Patient 3’’ has a higher heartbeat rate. Over the next few days, they would be able to measure their health data and figure out their own health through medical help again and again.
The test results and analysis of all the patients’ measurements for each health parameter are provided below. To test the system, three real human test subjects were used for this study. Measurement results were obtained using our developed system in this study. Real-life measurement and implementation of the system were carried out. The real-life test results obtained using the systems are shown in the following tables, consecutively. Table 3 shows body temperature measurement analysis on three different people. During the measurement, the temperature data was taken three times for each patient case. The temperature values are very close for each measurement setting of a test subject. However, due to different human bodies, the data varies slightly for each test subject.
Body temperature test results on three different people of the proposed system.
|
||||||||||||||||||||||||||||
Shows the pulse rate measurement analysis on three different people. The same people were used in this case as were used for the temperature measurement case. it is noted that the heart rates of three different people are comparable. The results obtained using the proposed system show standard values for heart rate. We know that the heart rates of different people can vary. However, the proposed system shows good results.
Pulse rate test results on three different people of the proposed system.
|
||||||||||||||||||||||||||||
The SpO2 measurement analysis on three different people. In this SpO2 measurement setting, the same people were used as were used in the other two cases. From Table 5, it is observed that the SpO2 levels for three people are quite close. For different test subjects, the measured SpO2 values changed slightly. The proposed system shows standard values for SpO2.
SpO2 test results on three different people of the proposed system.
| SpO2 | Patient-1 (%) | Patient-2 (%) | Patient-3 (%) |
| Take-1 | 97 | 97 | 98 |
| Take-2 | 97 | 97 | 98 |
| Take-3 | 97 | 97 | 98 |
| Average | 97 | 97 | 98 |
Hardware comparison with other articles.
|
||||||||||||||||||||||||||||||||||||||||||||||||||||||||||||||||||||||||||||||||||||||||||||||||||||||||||||||||
The design and implementation of a health monitoring system using IoT are presented in this study. This IoT-based device allows users to determine their health parameters, which could help regulate their health over time. Eventually, the patients could seek medical assistance if the need arises. They could easily share their health parameter data instantly within one application with the doctor. As we know, the IoT is now considered one of the most desirable solutions in health monitoring. It makes sure that the parameter data is secured inside the cloud, and the most important thing is that any doctor can monitor the health of any patient at any distance. The paper is about an IoT-based health monitoring system using Arduino that has been developed. The system will measure a patient’s body temperature, heartbeat, and the SpO2 levels in the blood and send the data to an app via Bluetooth. This information is also transmitted to the LCD panel, allowing the patient to see their current health state quickly. Elderly patients, asthma patients, COPD patients, patients with chronic diseases, COVID-19 patients, and diabetic patients will be able to keep their health in check over time with the help of the system we developed. The system could be improved and adjusted in a variety of ways in the future.