Project 1
Design a Multi-Parameter Patient Monitoring System to acquire physiological signals and display them on a color LED screen. The system should have the capability to work on mains and batteries. The following are the design parameters:
Physiological monitoring
- As the name suggests it is the monitoring of the physiological condition of a patient in a hospital or home environment
- It is done round the clock on a monitor
Multiparameter monitor-
- Various critical parameters are monitored through this monitor hence it is known as a multipara/parameter monitor or the basic module is known as the vital signs monitor
Vital signs
- These vital signs are basically measurements of the body's most basic functions
- 4 main vital signs are routinely monitored by the healthcare professionals and providers
- Body temperature
- Pulse rate
- Respiration rate
- ECG and heart rate
- These signs are useful in monitoring or detecting medical problems
- The vital signs can be measured in a medical setting, at the site of a medical emergency or at home, or elsewhere
Other Critical parameters in the Intensive Care Unit
- Temperature
- Cardiac output-
- The volume of the blood pumped by the heart in 1 minute
- Reflects the efficiency of the heart
- SpO2
- Define blood O2 content and O2 delivery
- Invasive and non-invasive Blood Pressure
- Invasive blood pressure monitoring used in the ICU and operating theatre
- Direct measurements of the arterial pressure by inserting into a suitable artery through a cannula needle
- Non-invasive blood pressure is Measurement to through cuffed method in a non-invasive way
- EtCO2
- End-tidal carbon dioxide
- Level of CO2 which is released at the end of an exhaled breath
Specific Physiological Monitoring
- It can be incorporated as a specific need
- Hemodynamic monitors
- Monitor
- Hemodynamic parameters like stroke volume, cardiac output, etc of the blood flow
- Anesthesia gas monitoring
- Neurological monitoring
- It is done through EEG and intracranial pressure monitoring
- Blood glucose monitors
- Monitor blood glucose levels
To design the multiparameter physiological monitoring system I have considered the following parameters
The following parameters are considered for monitoring
- Pulse oximeter-(SPO2)Oxygen saturation monitoring
- ECG- specifications
- Frequency:0.05 Hz-150 Hz
- Amplitude: 0.25 - 1 mV
- Blood Pressure (Systolic and Diastolic) (Invasive/Non-invasive)
- Body temperature
- Heart Rate
- It is derived from the ECG
- 40- 220 beats per minute
- Pulse Rate
- Derived from the pulse oximeter
- Respiration rate
- Specifications
- 2-50 breaths/min
- Frequency: 0.1 -10Hz
- Respiratory parameters
- Total Lung Capacity
- Tidal Volume
- Respiratory Volume
- Expiratory reserve volume
- Functional Residual Capacity
- Residual Volume
- Vital capacity
- Inspiratory reserve volume
- FVC
Components of the Medical Monitor :
- Sensors and Transducers
- It converts the physiological signals into the electrical signals
- Sensors -
- Thermal Temperature sensor
- Pressure sensor
- Pulse sensor
- Transducer
- Temperature Transducer
- SPO2 monitor- Dual length Transducer
- Pressure transducer
Fig: Invasive BP sensor and NIBP cuff and connector . Fig: SpO2 sensor board .
Fig: ECG sensor and sensor board.
Fig: Temperature sensor.
Modules
- It processes the electrical signals for displaying on monitors
Display device
- LCD/LED/TFT display device
Communication link
- Central monitoring device interface
Alarm
- Audio and visual Alarms
- For critical parameters
Power units
- Power various Modules
- Mains/rechargeable battery
Fig: Power supply unit and fuse
Technical specifications of the parameters
- NIBP
- Oscillometry method
- Modes- Manual/Auto/Continuous
- The automatic measure time is adjustable
- Measurement range:10-270 mmHg
- ECG
- Lead mode- 5 Lead
- Lead selection - RA,RL,LL,LA,V
- Heart rate range-
- 40-220 bpm
- Frequency : 0.05 Hz -150Hz
- S-T segment detection
- Measurement range: 0.25 mV~1 mV
- SPO2
- Measurement range 0-100%
- Accuracy can be 70 to 100% ,may vary
- Respiration rate
- Method
- RA-LL impedance
- 2-50 breaths/min
- The range for adults is 0-120 rpm
- The range for Pediatric/neonatal: 0-150 rpm
- An alarm is given
- Method
- Pulse rate
- Range 20-254 BPM
- Temperature
- Range from 0-50°C
- Dual channel Temperature transducer
Multiparameter physiological monitor specifications
- Real-time remote monitoring of patients
- It can transmit and receive the data remotely
- Vital parameters can be monitored from the hospital through home monitoring
- The patient data monitored in the ambulance can be transferred to the emergency room in the telemedicine center in the hospital. It helps the doctors to be ready with the treatment protocols according to the vital signs
- All the data acquired can be sent to the cloud for an expert or second opinion of the experts
- In the intensive care unit, 8 to 9 monitoring systems are connected to the central nursing where all the vital information can be monitored by the doctor or healthcare provider
2. Draw the detailed block schematic of the multi-parameter monitoring system with all the features required as a monitoring system
Fig: Block diagram of the multi-parameter monitoring system
Features for designing the multiparameter physiological monitoring system and their choosing specifications are given below-
5 Lead ECG Monitoring
- Using the 5 leads such as RA, LA, LL, RL, and V where we can get all the 6 leads to acquire the signals which are 3 bipolar limb leads and 3 augmented voltage leads
- Single lead for the chest region
- Place this from V1 to V6 to monitor the leads as in need basis
- We can also use all the 12 leads if Front end amplifier is used but here we are considering only 5 leads for the ECG monitoring
Fig: 5 lead electrode placement
Signal conditioning for the ECG
- ECG data acquisition and processing
- Respiration Acquisition
- Respiration signals are derived from the ECG signals
- Low current is applied to the RA and LA of a person due to the inspiration and expiration variation of the chest region of a person. The resistance is going to vary and is going to be measured
- The impedance is fed into the circuitry and we can measure a slow variation of the waveform due to the thoracic movement of a person due to respiration
Data processing
- The acquired data is processed
- Respiration rate can be obtained
NIBP
- Invasive and non Invasive BP
- Invasive BP
- The catheter is directly inserted into the arterial of the patient and the blood pressure is measured directly
- Non-invasive Blood pressure
- It measures the systolic and diastolic pressure
- Blood pressure levels are measured at regular intervals
Interface
- The interface is present in the data acquisition system and the data is acquired
Pulse Oximeter
- In the pulse oximeter, the SP02 and the pulse rate will be continuously monitored
Body temperature
- A temperature sensor is placed in the patient to measure the variation of temperature
Data acquisition and control
- A single board computer monitor which is going to interface all the sensors
- Sensor for the body temperature measurement and all this data going to be acquired by this single board computer or any kind of a digital signal processing board
- Based on the cost we can choose whether to use a single board computer or a signal processing board
After the data acquisition and control system, the following steps will be considered as the final step in the designing
Signal processing
- The signals derived from all the physiological parameters are processed and then further it has been displayed
Display
- Display of the data through the LCD display
Wireless communication
- The processed data can be used for telemedicine or for wireless communication
- The wireless transmission used for the centralized monitoring system
Store
- All the data can be stored for the further analysis
Alarms
- The alarms can be generated by using some upper and lower threshold limits
- Alarms can be visual or audible Alarms
- If any abnormalities going to be detected then an alarm may indicate the severity of the patient
Report
- The data can be stored in a hard printout format or in a soft copy to be accessible to the healthcare provider and the patient itself
Power and Battery
- Rechargeable batteries are used to give power to the system
- Sometimes mains power connection from the current board is given through the plug of the monitoring system
Other configurations of the multiparameter physiological monitoring system
Calibration
- 1 millivolt signals
- It checks the complete amplifiers before any of the monitoring starts
- All the amplifiers are going to be calibrated
- To know whether the amplifier is going to have a proper gain as per the design parameters
Defibrillation protection
- In case if defibrillation is given to the patient for a medical emergency to ensure the front end amplifier protection; defibrillator protection diodes are placed to protect the circuitry
Pacemaker pulse elimination
- By signal processing or any other means, the pacemaker signals need to be removed
Leads Fault Indicator
- Any fault in the 5 leads can be detected by the leads Fault detector beforehand.
3. What types of processing requirement is required to catered in the design? Explain them briefly.
The processing requirement required to be catered in the design are-
- Analog to digital signal processing
- Signals need to be digitized
- Calibration of the signals
- Signals and power isolation
- Isolation of circuits and power to avoid leakage currents
- Automatic change in scale to fit the waveform in the viewable screen
- The following signals processing should be required to monitor
- ECG Signal Processing
- Processing specific requirements
- Frequency range: 0.05 Hz to 150 Hz(Diagnostic quality)
- Leakage current should be less than 10 microampere
- Signal and power isolation
- Defibrillation protection
- Pacemaker pulse elimination
- Invasive blood pressure data acquisition and processing
- Respiratory parameters data acquisition and processing
4. What are the safety requirements to be catered to in the design?
Safety requirements to be catered to in the design are
- Defibrillation protection
- Defibrillators are given to the patient for medical emergencies to ensure the front-end amplifier protection defibrillator protection diodes are placed to protect the circuitry
- Pacemaker pulse elimination
- Pacemaker signals need to be removed which may interfere during the signal acquisition
- Calibration pulse
- 1 millivolt signals.
- It checks the complete amplifiers before any of the monitoring starts.
- All the amplifiers are going to be calibrated.
- To know whether the amplifier is going to have a proper gain as per the design parameters.
- Leads off or fault detector to detect whether the leads are off or on before the measurements.
- Any fault in the 5 leads can be detected by the leads Fault detector beforehand.
- Verify whether the probe detecting the functions works correctly or not before the monitoring.
- Routine maintenance needs to be considered including safety examination.
- Protective grounding impedance, insulation resistance test, or leakage current test.
5. How is the device proposed to be qualified? How is device calibration proposed to be done?
The device is proposed to be qualified in the following criteria
Qualification procedure:
- To be qualified, the monitor should undergo a satisfactory maintenance program by the qualified professionals otherwise it may get disabled and harm the patient's health
- To perform protective ground impedance, leakage current, and insulation resistance test
- To replace the ECG cable/lead wires if it is damaged or aging
- To observe for the cable and Transducer damage or if they have deteriorated then it is prohibited for further use
Before the factory sale, the monitor needs to be calibrated so that there is no need to calibrate it during its life cycle
- The ECG signal amplification accuracy can be verified by the built-in 1 mV calibration signal
- The pressure management accuracy and air leakage in the pneumatic system can be verified by a built-in pressure verification function and a precision pressure meter
- A specific calibration curve known as the R curve should be selected when SPO2 simulator precision accuracy is verified
- The battery should be used once a month to ensure its power capability and long service life. Recharge it after it ran out of its power capacity
6. Draw the screen layout for displaying the parameters on the display?
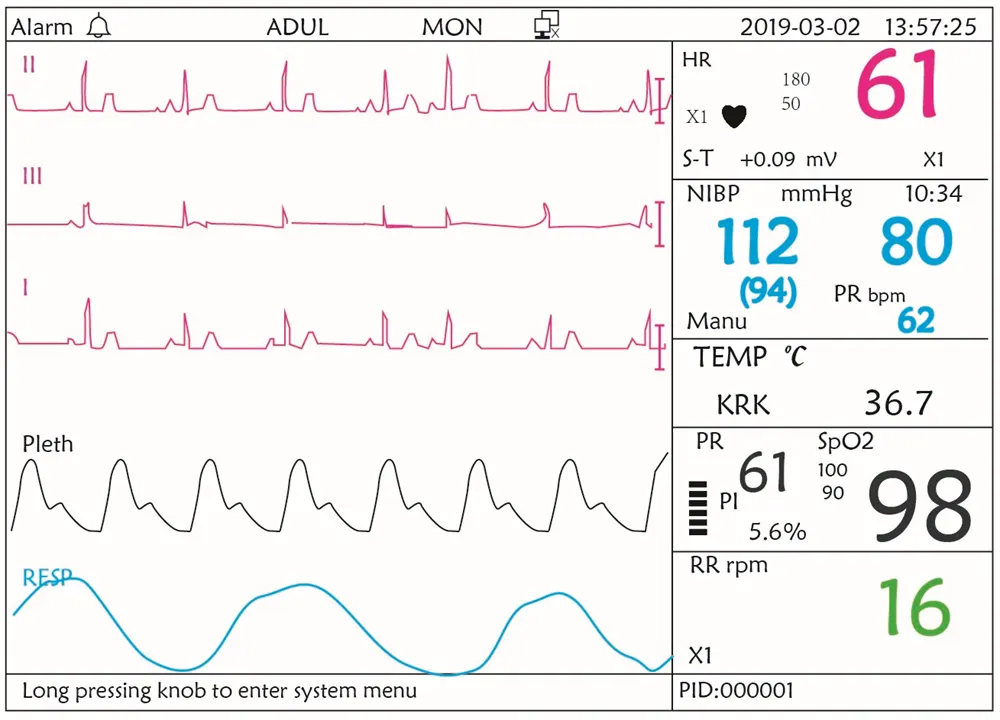
Screen layout (refer to actual screen)
Fig1: Screen layout for displaying the parameters on the display
<!--[endif]--><!-- [if mso & !supportInlineShapes & supportFields]>
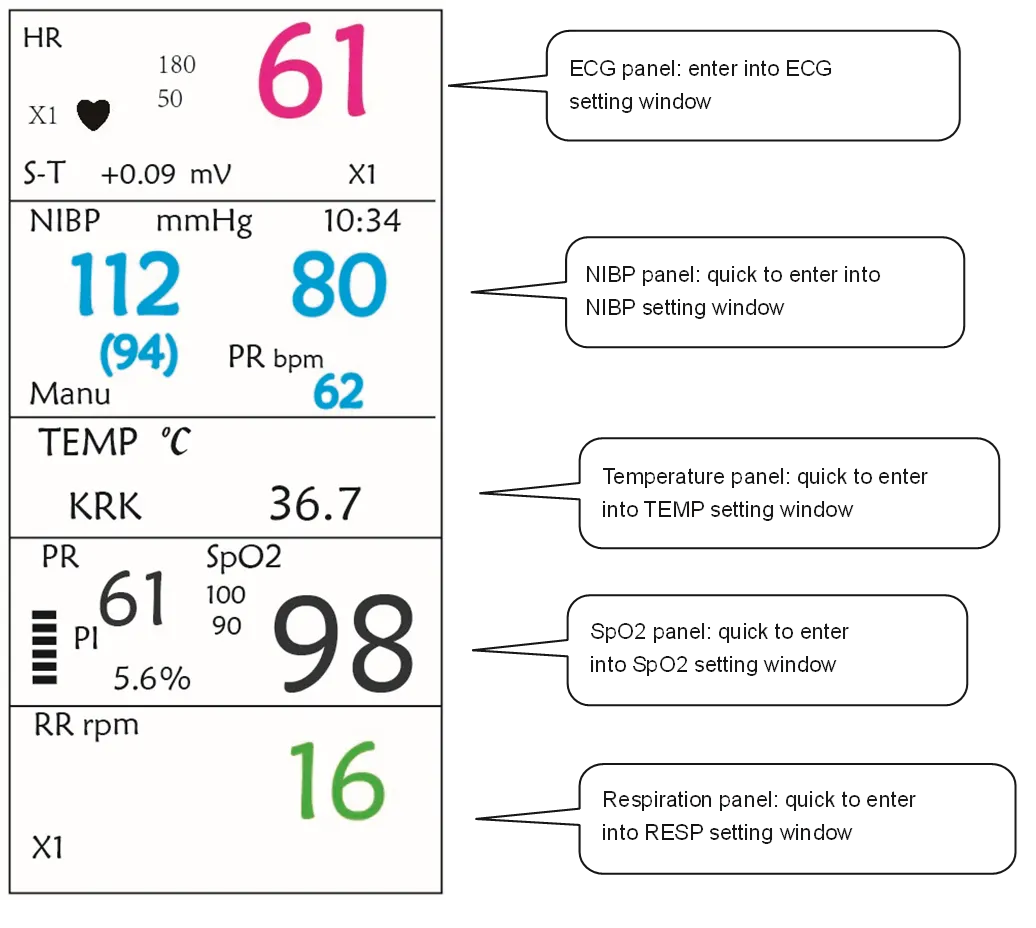
Fig2: Different parameters setting window
Fig1: Diagram shows the front panel Fig2 : The left and right panels of the monitoring system
- Power switch
- AC power indicator
- Built-in power indicator
- ECG lead
- Alarm silence
- Freeze the waveforms to observe
- NIBP
- DISP: Display mode
- Navigation Knob
- Alarm indicators
7. How is the data proposed to be acquired and stored in the database?
Data is acquired and stored in the database through the following methods
- The data is stored and can be displayed through a hard printout
- Sometimes the stored data can be wirelessly transmitted through telemedicine
- The data is uploaded in the cloud base network for further analysis by the healthcare professionals
- It can be uploaded to the computer via provided USB cable for data management and review
Fig: Diagram shows data acquisition sensing transmission, data concentration cloudlet processing, Cloud processing Analytics Visualization
8. Design ICU with 8 beds using the multi-parameter monitor and how is it proposed to be networked. How is the Central Nursing station proposed to be designed and explained in detail?
In the ICU the central nursing station basically offers a time-synchronized review for quick analysis of live and recent patient data. It helps to review full disclosure waveforms, and tabular and graphical trends in different view windows.
Fig: Design of an ICU with 8 beds(6 adult ICU beds and 2 Neonatal ICU beds) using the multi-parameter monitor connected to the Central Nursing station and other network server.
- As we can see from the diagram the 8 subject multi parameters monitoring ICU are connected to the Central nursing station.
- Multiple patient receiver units receive the wireless signals from the transmitters and send the signals to the Central nursing station
- As shown in the diagram HL7 gateway (Server allows for data communication between the clinic and hospital information system)connects the network to the hospital information system(HIS) or Clinical information system(CIS)
- The Network connection permits the review of real-time patient data and history from anywhere on the PC via a web browser
- A viewer software allows access to the real-time monitoring information on the 8 different patients at any time, anyplace on the Android or iPad/iPhone
Fig: Block diagram shows the use of computers in the patient monitoring system
Central Nursing station :
- A multi-connector cable connects the output from the 8 subject monitoring sites which are located at the bedside of each Intensive care bed to the central nurse's station
- ECG is continuously displayed for each subject via a four-channel CRT display
- These signals are recorded continuously on a memory loop tape recorder
- It contains the previous one-minute ECG for every 8 subjects by recording the ECG on the tape loop for 1 minute in length
- Sometimes some central stations duplicate the physiological indicators for the relative respiratory activity, blood pressure, and body temperature
- Indicators can be manually switched between the eight beds or the switching may get activated by the alarm system. During this situation, the alarm system with the monitors is automatically switched to the bed providing the alarm signal
- After this when the alarm is received at the central nurse's station the healthcare providers receive the information about the patient's urgency
- The central nursing station is also connected to the ECG signal chart recorder
- The alarm logic started the ECG chart recorder
9. What type of network connectivity is proposed if the system is planned for remote monitoring?
Fig: Block diagram showing wireless communication process
- Wireless communication equipment is used for network connection to be used as a remote monitoring system
- The patient data monitored in the ambulance can be transferred to the emergency room in the telemedicine center in the hospital. It helps the doctors to be ready with the treatment protocols according to the vital signs
- All the data acquired can be sent to the cloud for an expert or second opinion of the experts
- In the intensive care unit, 8 to 9 monitoring systems are connected to the central nursing where all the vital information can be monitored by the doctor or healthcare provider
Fig: Diagram shows remote patient monitoring
10. Since this device is planned to be used in ICU, what types of alarms are proposed and when are they going to be generated.
The alarms can be of two types:
- Audible alarm
- Visual alarm
The following criteria are proposed to generate these two types of alarm. The highest and lowest thresholds are set for both the alarms if it exceeds or decreased from the threshold amount indicator will indicate through the visual or audible form. The tabular format of the alarm generation for different scenarios is given below
Audible alarm
|
Alarm |
Alarm sound |
|
High priority alarm |
Beep+Beep+double+Beep+pause+Beep+beep+double+beep |
|
Medium priority alarm |
Triple beep |
|
Low priority alarm |
Single beep |
Visual alarm
|
Lamp color |
Alarm level |
|
Red |
High priority alarm |
|
Yellow flashing |
Medium priority alarm |
|
Yellow |
Low priority alarm |
|
Green |
Normal |
11. How to export or copy or transfer the data to a pen drive or external storage device, what type of data formats are proposed?
- The system basically takes the data from different devices for getting information about the patient
- It converts the analog signal to the digital signal using the ADC of the microcontroller
Fig: Connection between the patient monitor and the computer.
Procedure for data upload
There are various data upload procedures available for different multi-parameter physiological monitors. These data upload procedure is used for the GIMA multiparameter patient monitor model:
- Step1: At first download the PC software “Patient Monitor Data Manager” from the website
- Step 2: Second, Install the software “Patient Monitor Data Manager” on the required computer.
- Step 3: For the third step we have to connect the Patient Monitor and computer by the provided USB data cable,refer to the below figure.
- Step 4: Double-click the shortcut on the computer to start running the Patient Monitor Data Manager
- Step 5: At last click the “Export” button to acquire data.
Methods to obtain data for storage or transfer purposes :
- The data can be uploaded to the computer via provided USB cable for data management and review
- It can be copied or transferred to the Pendrive or external storage device after being acquired in the computer through the USB cable
- The wireless patient discrete data of voltages is transmitted through the microcontroller where the serial data is converted into the USB-compatible data format which can be understood by the computer
- All the data transmitted wirelessly are uploaded cloud base which can further be viewed by the medical professionals for proper care of the patient.