Project 1 - Parsing NASA thermodynamic data
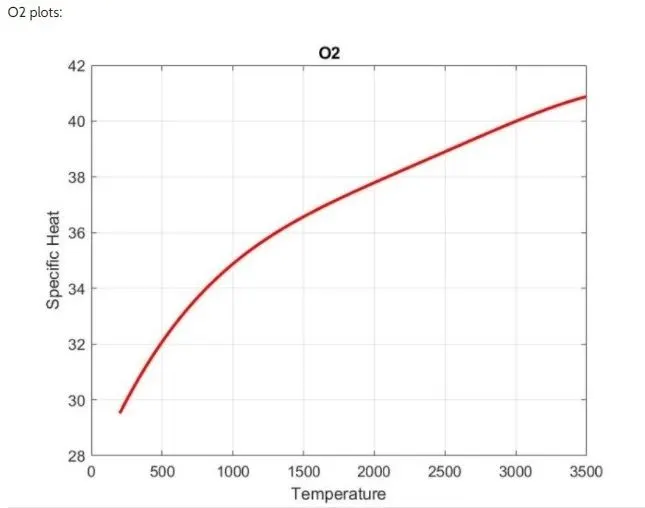
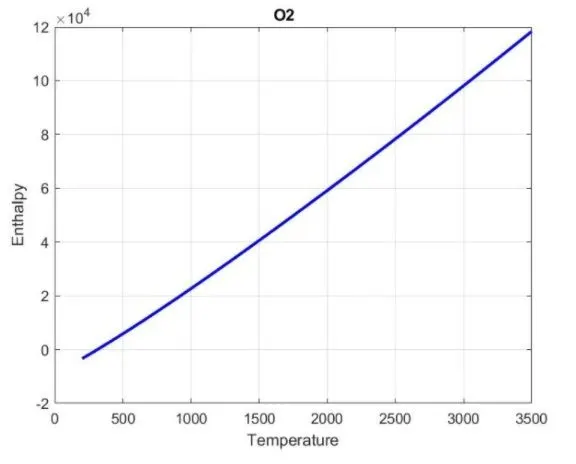
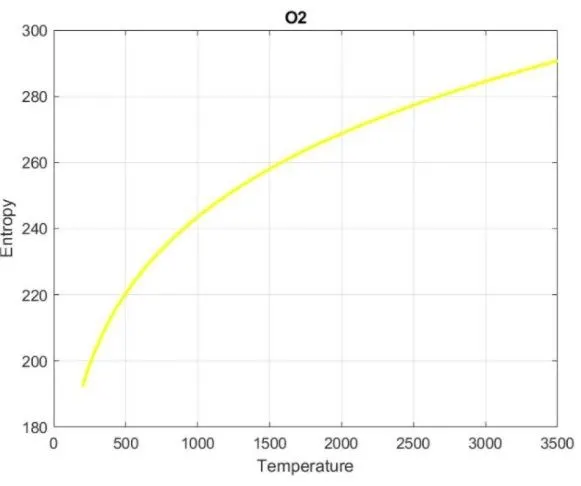
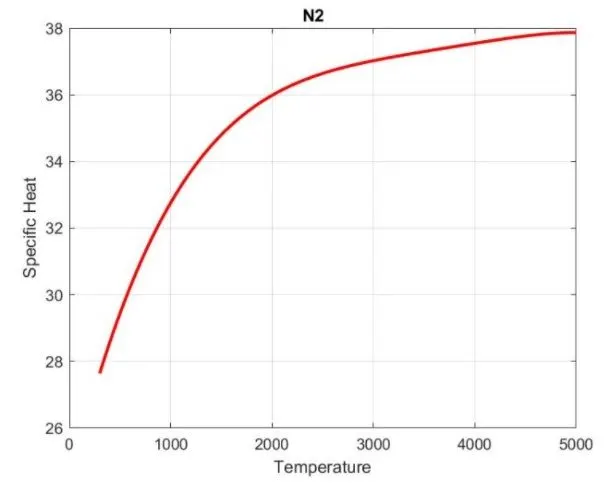
Aim:Write a function that extracts the 14 co-efficients and calculates the enthalpy, entropy and specific heats for all the species in the data file.and find out molecular massof each speciesad plot graph.
Theory:
- File parsing- it used to split the file or other input into pieses which can easily stored or manipulated ,we will be splitting string into parts then recognise the parts to convert into simpler than stringe. here we extract the thermodyanamic data file and calculate the enthalpy ,entropy,specific heatfor all spoecies and calculate the moleculer weight of each species, its plott arestored oin seprate file.
- Formula used: to clculTE the enthalpy,entropy,sp.heat below formula used.
- here temp. is vary for each species ,first 7 species used local temp.ad the last 7 coefficeint will use local low temp.and to calculate molecular wt.we use below formula.
- molecular wt.=(no.of atoms)*(Atomic wt.)
PROGRAME:
clear all
close all
clc
f1=fopen('THERMO.dat','r')
fgetl(f1);
line1=fgetl(f1);
A=strsplit(line,'.');
Global_low=str2double(A{2});
Global_mid=str2double(A{3});
Global_high=str2double(A{4});
%skipping next three lines
for i=1:3
    b=fgets(f1);
end
%extracting individulal specific information

for j=1:53


    species=fgetl(f1);
    t= strfind(species,'.');
    %local temperature for each species
    species(52-3:52+3)
    Tl=species(52-3:t(1)+3);
    Tl1=str2double(Tl);
    species(t(1)+6:62+3);
    Th= species(t(1)+6:t(2)+3);
    Th1=str2double(Th);
    species(t(2)+6:72+3);
    Tm=species(t(2)+6:t(3)+3);
    Tm1=str2double(Tm);
    sp_name=species(1:6);
    %coefficient of each species
    coeff_line_1=fgetl(f1);
    A11=strfind(coeff_line_1,'E');
    coeff_line_1(1:12+3);
    a1= coeff_line_1(1:A11(1)+3);
    c1=str2double(a1);
    a2=coeff_line_1(A11(1)+4:A11(2)+3);
    c2=str2double(a2);
    a3=coeff_line_1(A11(2)+4:A11(3)+3);
    c3=str2double(a3);
    a4=coeff_line_1(A11(3)+4:A11(4)+3);
    c4=str2double(a4);
    a5=coeff_line_1(A11(4)+4:A11(5)+3);
    c5=str2double(a5);
    coeff_line_2=fgetl(f1);
    A12=strfind(coeff_line_2,'E');
    coeff_line_2(1:12+3);
    a6=coeff_line_2(1:A12(1)+3);
    c6=str2double(a6);
    a7=coeff_line_2(A12(1)+4:A12(2)+3);
    c7=str2double(a7);
    a8=coeff_line_2(A12(2)+4:A12(3)+3);
    c8=str2double(a8);
    a9=coeff_line_2(A12(3)+4:A12(4)+3);
    c9=str2double(a9);
    a10=coeff_line_2(A2(4)+4:A12(5)+3);
    c10=str2double(a10);
    coeff_line_3=fgetl(F1);
    A13=strfind(coeff_line_3,'E');
    coeff_line_3(1:12+3);
    a11=coeff_line_3(1:A13(1)+3);
    c11=str2double(a11);
    a12=coeff_line_3(A13(1)+4:A13(2)+3);
    c12=str2double(a12);
    a13=coeff_line_3(A13(2)+4:A13(3)+3);
    c13=str2double(a13);
    a14=coeff_line_3(A13(3)+4:A13(4)+3);
    c14=str2double(a14);
    %creating the folder to save the plot
    mkdir('F:NASA File parsing/Species','sp_name')
end
% calculating the specific heat,Enthalpy,Entropy
T=linspace(Tl1,Th1,100);
R=8.314;
[Cp,H,S]=inputs(T,R,Tm1,c1,c2,c3,c4,c5,c6,c7,c8,c9,c10,c11,c12,c13,c14);


%plotting
figure(1)
plot(T,Cp,'lineWidth',2,'color','r')
grid on
title(sp_name)
xlabel('Temperature')
ylabel('Enthalpy')
figure(2)
plot(T,H,'linewidth',2,'Color','b')
grid on
title(sp_name)
xlabel('Temperature')
ylabel('Enthaply')
figure(3)
plot(T,S,'lineWidth',2,'color','y')
grid on
title(sp_name)
xlabel('Temperature')
ylabel('Entropy')
%changing the directory
program=(['F:/shirshak/matlab programs/Nasa file parsing/Species/',sp_name]);
cd(program)
%saving the plots
saveas(1,'Specific Heat.jpg')
saveas(2,'Enthalpy.jpg')
saveas(3,'Entropy.jpg')
cd=('F:/shirshak/matlab program/Nasa file parsing');
%specific heat ,Enthalpy,Entropy calculation
function[Cp,H,S]=inputs(T,R,Tm1,c1,c2,c3,c4,c5,c6,c7,c8,c9,c10,c11,c12,~,c14)
for i=1:length(T)
    if T(i)>Tm1
    Cp=(c1 + c2.*T+c3.T^2+c4.*T.^3+c5.*T.^4).*R;
    H=(c1+(c2.*T)./2 +(c3.*T.^2)./3 +(c4.*T.^3)./4+(c5.*T.^4)./5+c6./T).*T*R;
    S=(c1.*log(T)+c2.*T+(c3.*T.^2)./2+(c4.*T.^3)./3+(c5.*T.^4)./4+c7).*R;
    else
    Cp=(c8+c9.*T+c10.*T.^2+c11.*T.^3+c12.*T.^4).*R;
    H=(c8+(c9.*T)./2+(c10.*T.^2)./3+(c11.*T.^3)./4+(c12.*T.^4)./5+c6./T).*T.*R;
    S=(c8.*log(T)+c9.*T+(c10.*T.^2)./2+(c11.*T.^3)./3+(c12.*T.^4)./4+c14).*R;
end
end

%molecular weight calculation for each species
 function molecular_weight_calculation=molecular_weight(sp_name)
species=(sp_name);
elements=['H','C','O','N','A','S'];
atomic_weight=[1.00794 12.0101 15.999 14.0067 39.948 32.065];
molecular_weight_calculation=0;
for i=1:length(species)
    forj=1:length(elements);
    if strcmp(species(i),elements(1i))
        molecular_weight_calculation=molecuar_weight_calculation+ atomic_weight(1i);
        a=1i;
    end
end

n=str2num(species(i));
ifn>1;
molecular_weight_calculation=moplecular_weight_calculation + atomic_weight(a)*(n-1);
 end
 end
CODE EXPLAIN:
- we will open the Thermo.dat File by using fopen commad then extract the data by using fgetl command,first we will get the global temp. by using strsplit command then we skip some line bhy fget command ,now make the loop command to get all temp. and coefficient that are present in our file,bhy using finstr command we getting temp. and coefficient .now data which is obtained from file its converted into no.by using str2double command,
- now sp.heat,Ethalpy,Entropy calculated and create plotting by plot command ad give them laabel in x direction by xlabel command and y axis by using ylabel command
- by cd command changing the directory then save plotting by save command.
- function command is used for sp.heat,Enthalpy,Entropy and also for Moleculer weight
OUTPUT:
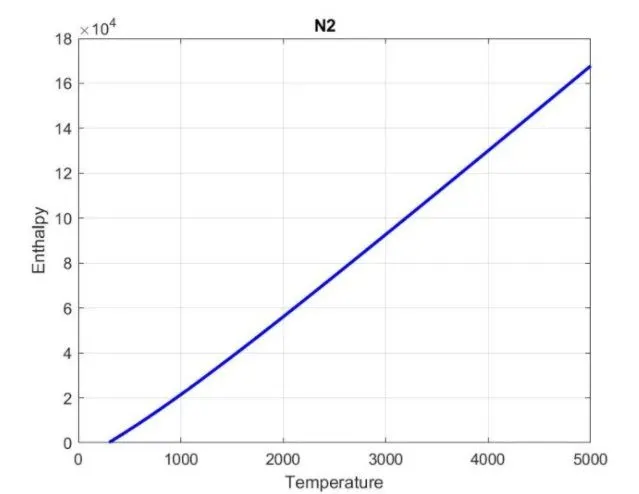
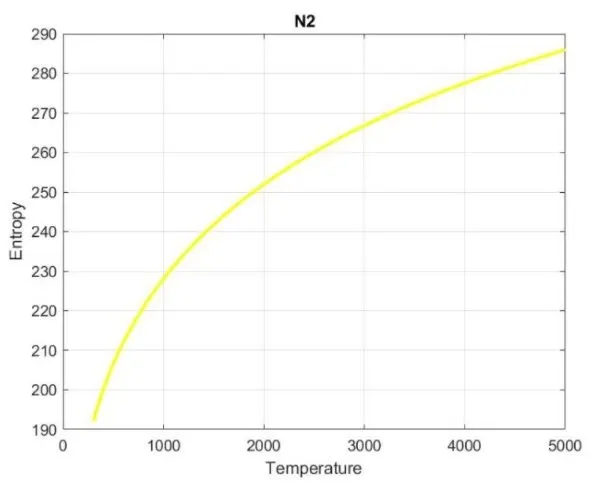
N2 PLOT:
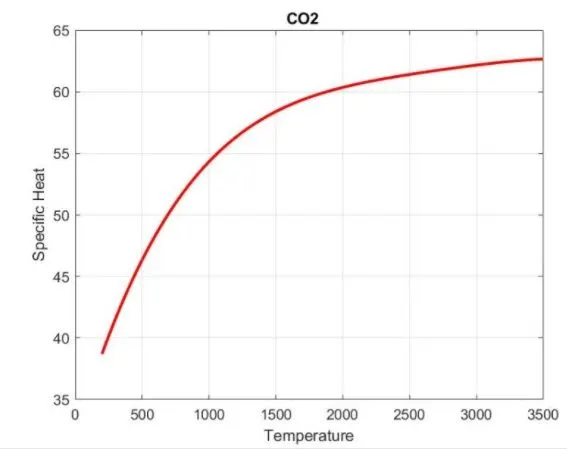
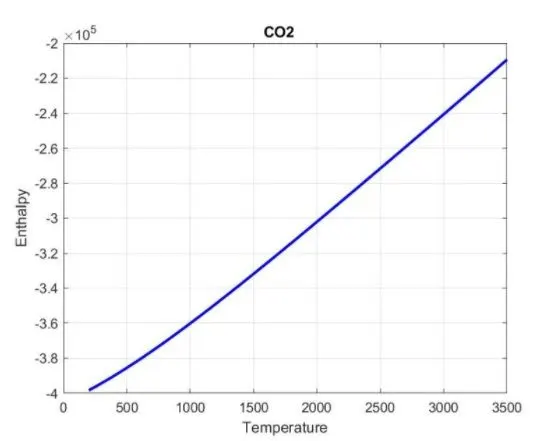
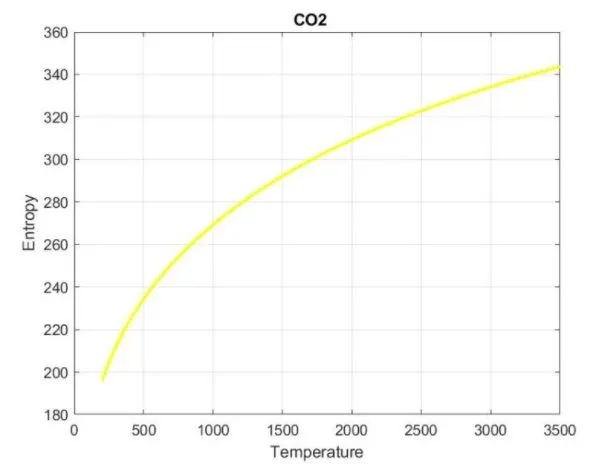
CO2 PLOT:
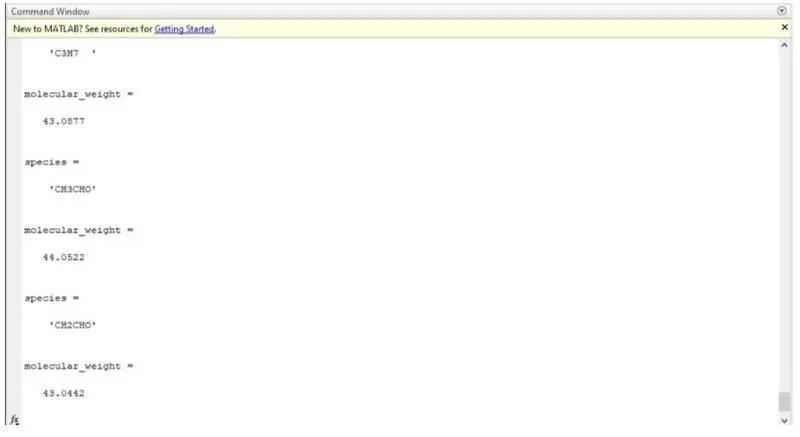
Molecular weight:
Results: