Project 1 - Parsing NASA thermodynamic data
Aim:
Write a function that extracts the 14 coefficients and calculates the enthalpy, entropy, and specific heats for all the species in the data file. You will be reading this file NASA thermodynamic data(Tip: use fopen and fgetl). The formulae are shown below.
Here R is the universal gas constant, T is the temperature
The FIRST 7 coefficients are HIGH-temperature coefficients and the SECOND 7 coefficients are LOW-temperature coefficients.
Also use the LOCAL TEMPERATURE RANGES which is unique for each individual species, not the GLOBAL TEMPERATURE RANGE.
2. Calculate the molecular weight of each species and display it in the command window.
3. Plot the Cp, Enthalpy, and Entropy for the local temperature range (low temperature: high temperature) specific for each species.
4. Save the plots as images with appropriate names and dump them in separate folders for each species with a suitable name. All these should be generated automatically.
5. The main program that you will submit will just take the "THERMO.dat" file as an input and generate Cp, H and S plots.
6. Please write a detailed report to describe your logic.
Logics:
- The parsing of the NASA thermodynamic data is fetched using the fopen command in the Matlab. the fgetl command is used to open the lines of the data one by one
- the process of fetching lines one by one is very lengthy and hasty, so I used while ~feof command to fetch the lines till the end of the data in the file.
- strssplit command is used to split the string data so that the values will not be taken as a whole.
- str2num command is used to change the value from the string into numbers
- strcmpi is used to compare the strings and the split data
- strfind is used to find the 'E' from the coefficients of the data which can further split into different variables like a1, a2, a3 .......,a15 .
- the different functions are written to calculate the specific heat, entropy, enthalpy, and molecular weight of the given elements.
- fprintf command is used to print the list of the molecule and to print the molecular weight in the command window
- the plot command is used to generate the plot between specific heat and temperature, enthalpy and temperature, and entropy and temperature.
- all the plots of the different elements are saved in the different folders with their respective names
Main code:
thermo = fopen('THERMO.dat','r');
fgetl(thermo)
tempdata = fgetl(thermo)
A = strsplit(tempdata,' ');
%changing global temp. string to number
lowgtemp = str2num(A{2});
midgtemp = str2num(A{3});
highgtemp = str2num(A{4});
% defining varibles to store the input

get = input(' Enter Species Name ','s')

while ~feof(thermo)
    data = fgetl(thermo);
    a= strsplit (data,' ');
    b =  a(1);

% compairing input and data of molecule
 match = strcmpi(b, get);
  if match == 1
      disp('species data available')
      %extracting coefficents of desired data
      line1 = fgetl(thermo);
      L1 = strfind(line1, 'E');
        coeff1 = line1(1:L1(1)+3);
        coeff2 = line1(L1(1)+4:L1(2)+3);
        coeff3 = line1(L1(2)+4:L1(3)+3);
        coeff4 = line1(L1(3)+4:L1(4)+3);
        coeff5 = line1(L1(4)+4:L1(5)+3);
     a1 = str2num(coeff1);
     a2 = str2num(coeff2);
     a3 = str2num(coeff3);
     a4 = str2num(coeff4);
     a5 = str2num(coeff5);


     line2 = fgetl (thermo)
     L2 = findstr(line2,'E');
        coeff6 = line2(1:L2(1)+3);
        coeff7 = line2(L2(1)+4:L2(2)+3);
        coeff8 = line2(L2(2)+4:L2(3)+3);
        coeff9 = line2(L2(3)+4:L2(4)+3);
        coeff10 = line2(L2(4)+4:L2(5)+3);
      a6 = str2num(coeff6);
      a7 = str2num(coeff7);
      a8 = str2num(coeff8);
      a9 = str2num(coeff9);
      a10 = str2num(coeff10);


    line3 = fgetl (thermo)
     L3 = findstr(line3,'E');
        coeff11 = line3(1:L3(1)+3);
        coeff12 = line3(L2(1)+4:L2(2)+3);
        coeff13 = line3(L2(2)+4:L2(3)+3);
        coeff14 = line3(L2(3)+4:L2(4)+3);

      a11 = str2num(coeff11);
      a12 = str2num(coeff12);
      a13 = str2num(coeff13);
      a14 = str2num(coeff14);
   % exrtarcting local temprature of the input molecule
    mltemp = a(end-1);
    midlt = str2double(mltemp);
    hltemp = a(end-2);
    highlt = str2double(hltemp);
    lltemp = a(end-3);
    lowlt = str2double(lltemp);

     Tr = linspace(100,10000,5000);
 R = 8.314;
 %obtaining value of specific heat
 Cp= specific_heat(a1,a2,a3,a4,a5,a8,a9,a10,a11,a12,midlt,Tr,R);

 %obtaining value of entropy
S  = entropy (a1,a2,a3,a4,a5,a6,a8,a9,a10,a11,a12,a13,a14,midlt,Tr,R);

 %obtaining value of enthalpy
  H = enthalpy (a1,a2,a3,a4,a5,a6,a8,a9,a10,a11,a12,a13,midlt,Tr,R);

  %calculate molecular weight

  molecularweight = MW(get);

  %read and write molecular list
  Molecular_list = fopen('molecular weight','a+');
  fprintf(Molecular_list,'molecular weight of %s is %d n',get,molecularweight);
  fclose(Molecular_list);


  %creating directory to store the plot
   %saving as a folder
   cur_dir = pwd;
   mkdir(get);
   cd(get);

  %plotting Cp v/s T
  figure (1)
  plot (Tr,Cp,'linewidth',3, 'color','g');
  grid on
  xlabel('Temprature range[K]')
  ylabel('Specific Heat [J/K]')
  title(sprintf('Specific_heat v/s temprature of %s',get));
  saveas(figure(1),'specific heat.jpg')

  %plotting  S v/s T
  figure (2)
  plot (Tr,S,'linewidth',3, 'color','r');
  grid on
  xlabel('Temprature range[K]')
  ylabel('Entropy [J/K]')
  title(sprintf('Entropy v/s temprature of %s',get));
  saveas(figure(2),'Entropy.jpg')

  %plotting H v/s T
  figure (3)
  plot (Tr,H,'linewidth',3, 'color','r');
  grid on
  xlabel('Temprature range[K]')
  ylabel('Enthalpy [J/K]')
  title(sprintf('Enthalpy v/s temprature of %s',get));
  saveas(figure(3),'Enthalpy.jpg')

  % defining current folder
  cd(cur_dir);

  %Molecular weight
  M = MW (get);


  f2 = fopen('molecular mass', 'w');


  fprintf('%s  %s  %f ','speices','Molecular mass = ',M)

  end
end
Results :
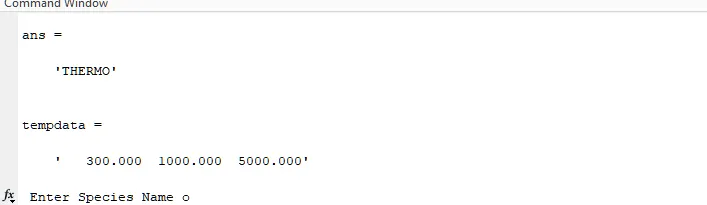
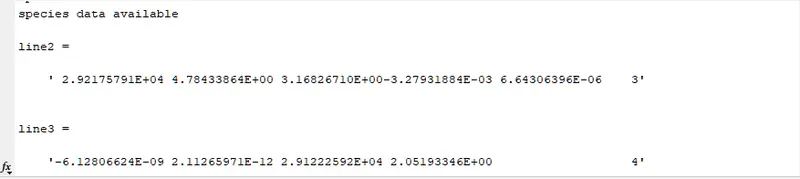
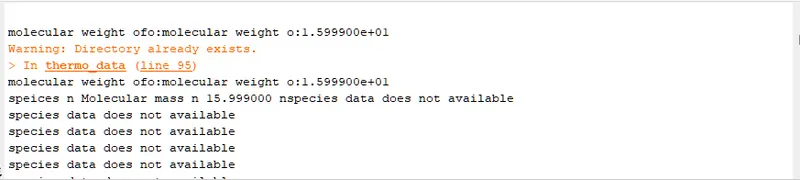
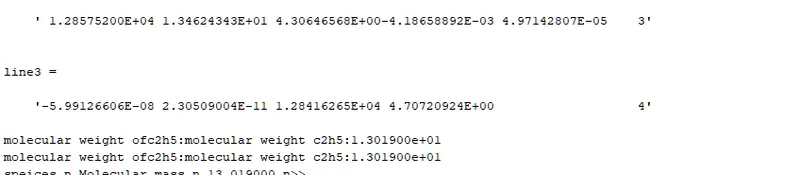
after entering species name:
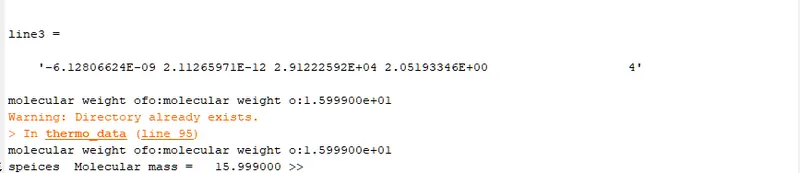
functions:
%molecular weight function
function molecularweight = MW(get)
 %standard atomic name
 atomic_name = ['H','C','N','O','A'];
 % hydrogen carbon nitrogen oxygen asrgon
 fprintf('molecular weight of');
 fprintf(get);
 fprintf (':');
 %standard atomic number
 Atomic_weight = [1.008 12.011 14.007 15.999 39.948];
 %starting range of molecule
molecularweight = 0;
%adding atomic number to obatain particular value
for i = 1:length(get)
     for j = 1:length(atomic_name);
         if strcmpi(get(i),atomic_name(j));
               molecularweight = molecularweight+Atomic_weight(j);
               position = j;
         end
     end
     n = str2num(get(1));
     if n>1
         molecularweight = molecularweight+Atomic_weight(position)*(n-1);
     end
end
fprintf('molecular weight %s:',get);
fprintf('%d',molecularweight)
disp(' ');
end
% function for cp
function  Cp = specific_heat(a1,a2,a3,a4,a5,a8,a9,a10,a11,a12,midlt,Tr,R)
%where Tr are used for temprature range
%where r is for gas constant
if (Tr>midlt)
    Cp = (a1+(a2*Tr)+(a3*(Tr).^2)+(a4*(Tr).^3)+(a5*(Tr).^4)).*R;
else
    Cp = (a8+(a9*Tr)+(a10*(Tr).^2)+(a11*(Tr).^3)+(a12*(Tr).^4)).*R;
end
end
%function for Enthalpy
function H = enthalpy (a1,a2,a3,a4,a5,a6,a8,a9,a10,a11,a12,a13,midlt,Tr,R)
if (Tr>midlt)
    H = ((a1+(a2*(Tr)/2))+(a3*((Tr).^2)/3)+(a4*((Tr).^3)/4)+(a5*((Tr).^4)/5)+(a6*((Tr).^5)/6)).*(R*Tr);
else
     H = (a8+(a9*(Tr)/2)+(a10*((Tr).^2)/3)+(a11*((Tr).^3)/4)+(a12*((Tr).^4)/5)+(a13*((Tr).^5)./6)).*(R*Tr);
end
end
%funtion for entropy
function S= entropy (a1,a2,a3,a4,a5,a6,a8,a9,a10,a11,a12,a13,a14,midlt,Tr,R)

if (Tr>midlt)
S = (((a1.*log(Tr))+(a2*Tr)+(a3*((Tr).^2)/2))+(a4*((Tr).^3)/3)+(a5*((Tr).^4)/4)+(a6*((Tr).^5)/5)+a7).*R;
else
S = ((a8.*log(Tr))+(a9*Tr)+(a10*((Tr).^2)/2)+(a11*((Tr).^3)/3)+(a12*((Tr).^4)/4)+(a13*((Tr).^5)/5)+a14).*R;
end
end
Conclusion:
hence the parsing of the NASA thermodynamic data is completed