Project 1 - Parsing NASA thermodynamic data
Aim:
- To write a code in Matlab which parse a NASA Thermodynamic data file
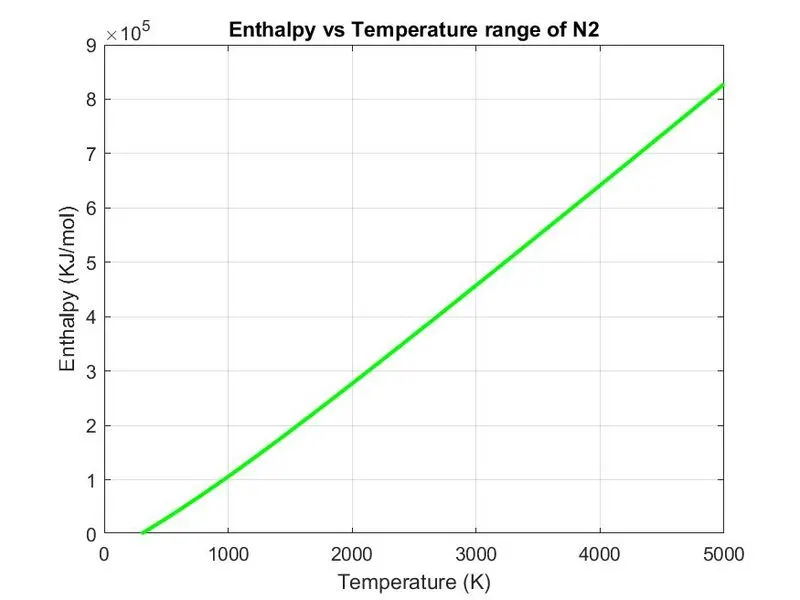
- The matlab code written should Plot the Cp, Enthalpy and Entropy for the local temperature range of the NASA Thermodynamic data file
Equation:

Here
R - Universal Gas Constant
T - Temperature
Cp - Specific Heat
H - Enthalpy
S - Entropy
Procedure:
- The code starts with clear all,close all,clc.
- Inputs are mentioned in the initial part the code.
- The fopen command is used to open the Thermo_1.dat file with appropriate delimiter.
- fgetl command is used to read the data line by line of the file.
- The local temperature and species are captured and stored in a different variables.
- A range of temperature is defined with the help of linspace command.
- Similarly the temperature co-efficients are captured with the help of fgetl,findstr command and str2num(converts strings to variables)
- The main logic is looped for other species with the for loop.
- Separate function code is written for specific heat, enthalpy,entropy and to calculate molecular weight.
- Also here we make use of if and else command to calculate high tempurature for the first 7 elements and low temperature for last 7 elements.
- Explaining the logic for calculating Molecular mass.Here we give atomic weight and atomic name as input to the species.Then we make use of for loop to calculate the molecular weight of each species individually.Then further we use command called strcmp to compare the species with the elements and calculate their molecular weight and the string is converted to number by using str2num command.
File Parsing main Code:
clear all
close all
clc

%Inputs
R=8.31446261815324


%opening the file
f_1 = fopen('THERMO_1.dat','r')

%reading first line
fgetl(f_1);

temperature = fgetl(f_1);
fgetl(f_1);
fgetl(f_1);
fgetl(f_1);

% logic
for i=1:53

tline = fgetl(f_1);
tline = strsplit(tline);
species = tline{1};
temp_low = str2num(tline{end-3});
temp_high = str2num(tline{end-2});
temp_med = str2num(tline{end-1});

T = linspace(temp_low,temp_high,100);

cline1 = fgetl(f_1);
findstr(cline1,'E');
o1 = strfind(cline1,'E');
a1 = cline1(1:o1(1)+3);
a1 = str2num(a1);
a2 = cline1(o1(1)+4:o1(2)+3);
a2 = str2num(a2)
a3 = cline1(o1(2)+4:o1(3)+3);
a3 = str2num(a3);
a4 = cline1(o1(3)+4:o1(4)+3);
a4 = str2num(a4);
a5 = cline1(o1(4)+4:o1(5)+3);
a5 = str2num(a5);

cline2 = fgetl(f_1);
findstr(cline2,'E')
o2 = strfind(cline2,'E');
a6 = str2num(cline2(1:o2(1)+3));
a7 = str2num(cline2(o2(1)+4:o2(2)+3));
a8 = str2num(cline2(o2(2)+4:o2(3)+3));
a9 = str2num(cline2(o2(3)+4:o2(4)+3));
a10 = str2num(cline2(o2(4)+4:o2(5)+3));

cline3 = fgetl(f_1);
findstr(cline3,'E');
o3 = strfind(cline3,'E');
a11 = str2num(cline3(1:o3(1)+3));
a12 = str2num(cline3(o3(1)+4:o3(2)+3));
a13 = str2num(cline3(o3(2)+4:o3(3)+3));
a14 = str2num(cline3(o3(3)+4:o3(4)+3));

% Function Calling
[c_p] = function_a1(T,temp_med,R,a1,a2,a3,a4,a5,a8,a9,a10,a11,a12);

[H] = enthalpy_func (T,temp_med,R,a1,a2,a3,a4,a5,a6,a8,a9,a10,a11,a12,a13);

[S] = entropy_function(T,temp_med,R,a1,a2,a3,a4,a5,a7,a8,a9,a10,a11,a12,a14);


cd ('E:\Matlab_skill_lync\Nasa_file_parsing_project\nasa_file_parsing\Final_species')
mkdir(species)
cd(species)

% Plotting
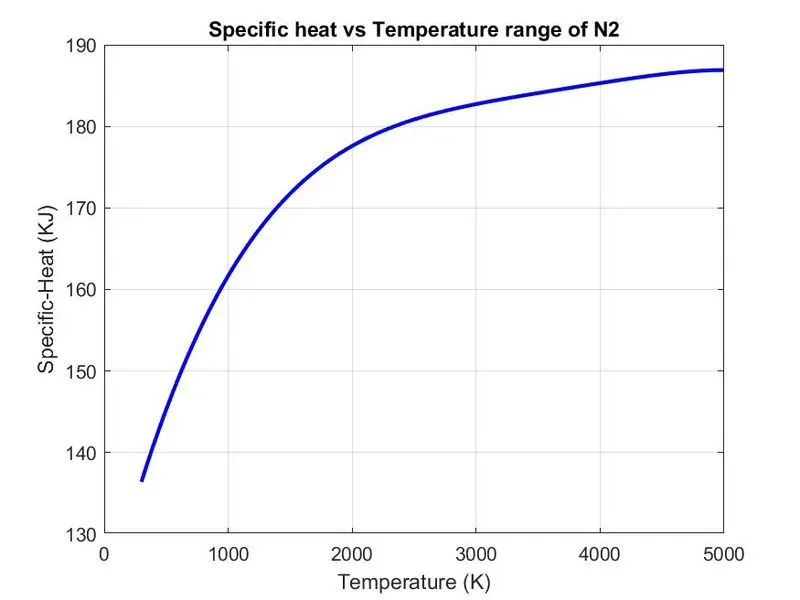
figure(1)
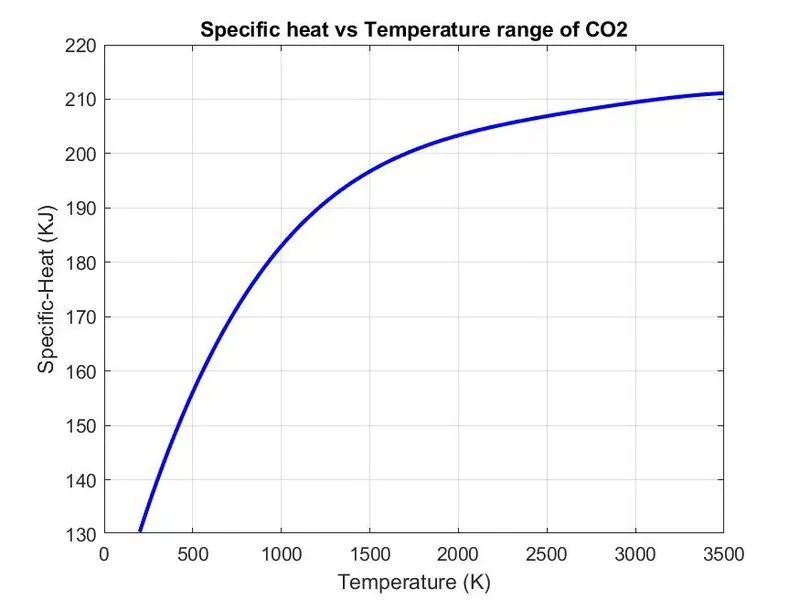
plot(T,c_p,'linewidth',2,'color','b');
xlabel('Temperature (K)');
ylabel('Specific-Heat (KJ)');
title(sprintf('Specific heat vs Temperature range of %s',species));
grid on
saveas(figure(1),'specific_heat.jpg');

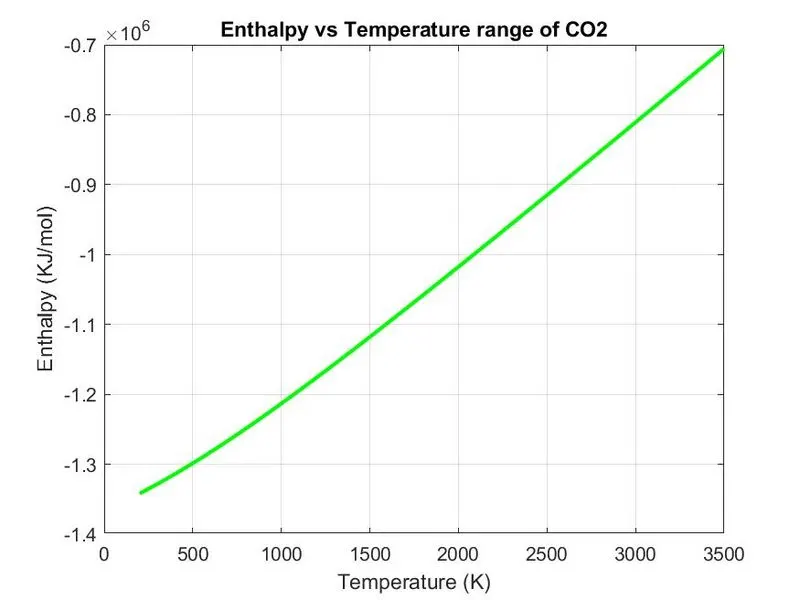
figure(2)
plot(T,H,'linewidth',2,'color','g');
xlabel('Temperature (K)');
ylabel('Enthalpy (KJ/mol)');
title(sprintf('Enthalpy vs Temperature range of %s',species));
grid on
saveas(figure(2),'Enthalpy.jpg');


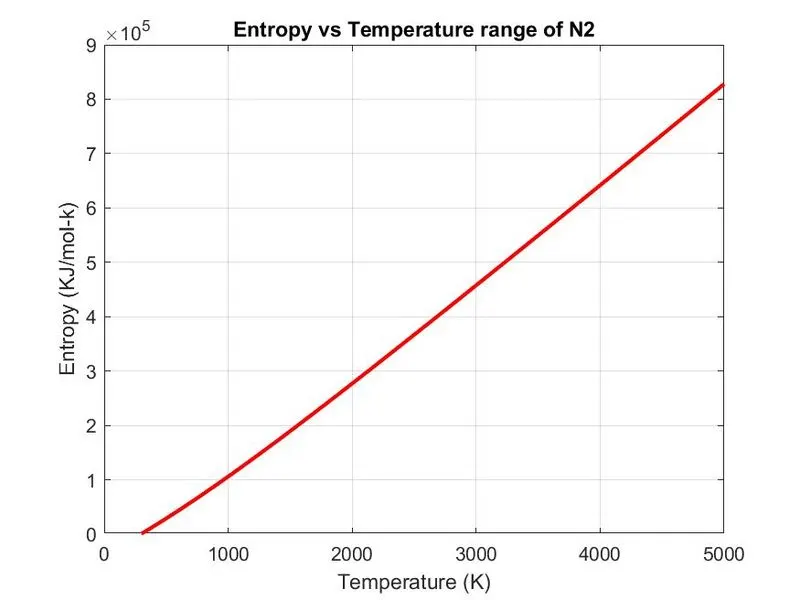
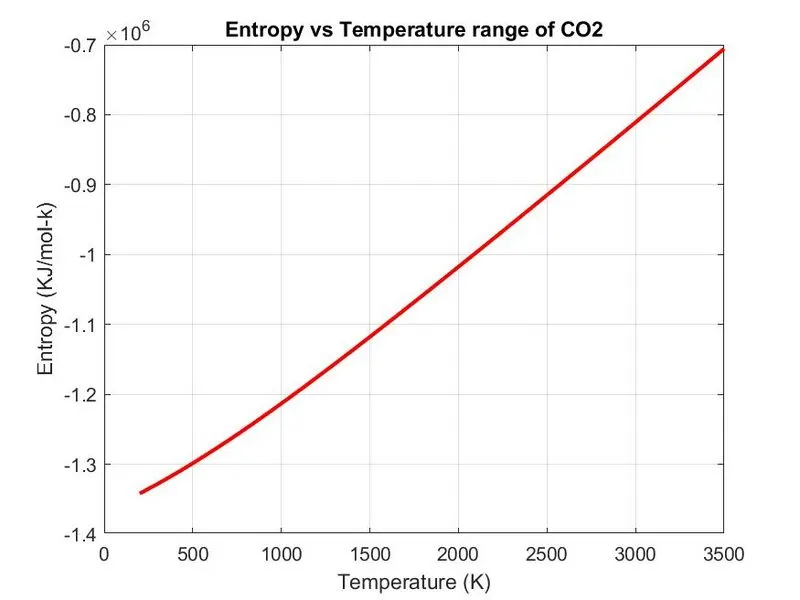
figure(3)
plot(T,H,'linewidth',2,'color','r')
xlabel('Temperature (K)')
ylabel('Entropy (KJ/mol-k)')
title(sprintf('Entropy vs Temperature range of %s',species))
grid on
saveas(figure(3),'Entropy.jpg')

[R] = molecular_weigth(species)

end
Function Code for specific heat:
function [c_p] = function_a1(T,temp_med,R,a1,a2,a3,a4,a5,a8,a9,a10,a11,a12)
if T>=temp_med

c_p = (a8 + a9*T + a10*(T).^2 + a11*(T).^3 + (a12*(T)).^4).*R

else

c_p = (a1 + a2*T + a3*(T).^2 + a4*(T).^3 + a5*(T).^4).*R


end
end
Function Code for Enthalpy:
function [H] = enthalpy_func (T,temp_med,R,a1,a2,a3,a4,a5,a6,a8,a9,a10,a11,a12,a13)
if T>=temp_med

H = (a8 + (a9*(T)/2)+((a10*((T).^2))/3) + ((a11*((T).^3))/4) +((a12*((T).^4))/5) + (a13./T)).*(R*T)

else
H = (a1 + (a2*((T)/2))+ ((a3*((T).^2))/3) + ((a4*((T).^3))/4) +((a5*((T).^4))/5) + (a6./T)).*(R*T)

end
end
Function Code for Entropy:
function [S] = entropy_function(T,temp_med,R,a1,a2,a3,a4,a5,a7,a8,a9,a10,a11,a12,a14)
if T>=temp_med

S = (a8.*(log(T)) +a9*T +a10*(((T).^2)/2) + a11*(((T).^3)/3) + a12*(((T).^4)/4) +a14).*R
else

S = (a1.*(log(T)) +a2*T + a3*(((T).^2)/2) + a4*(((T).^3)/3) + a5*(((T).^4)/4) +a7).*R

end
end
Function code for molecular weight:
function [R] = molecular_weigth(species)
atomic_names = ['H','C','O','N','Ar']
atomic_weights = [1.00784,12.0107,15.999,14.0067,39.948]

R=0
for i=1:length(species);
    for j=1:length(atomic_names);
        if species(i)== atomic_names(j);
            R = R+atomic_weights(j);
            pos = j;
        end
    end
    n = str2num(species(i));
    if n>=1
        R = R+(atomic_weights(pos)*(n-1));
   end
end
fprintf('Molecular_weight of%s = %s',species,R);
%disp('');
end
Output:
1) ScreenShot Of Folders Saved

Plot of O2:
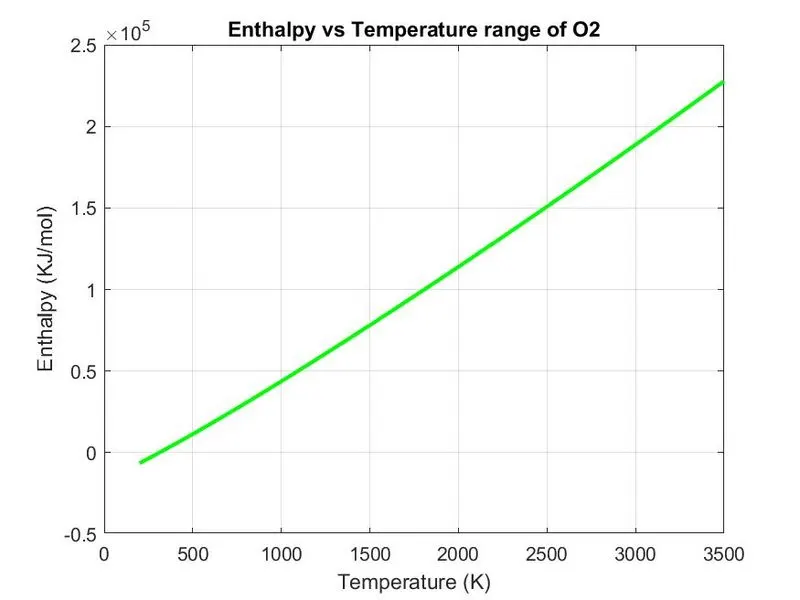
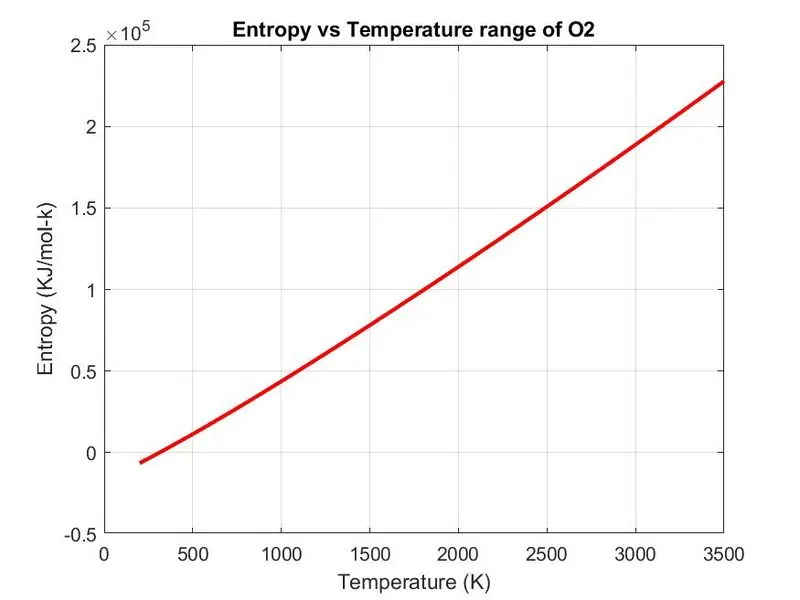
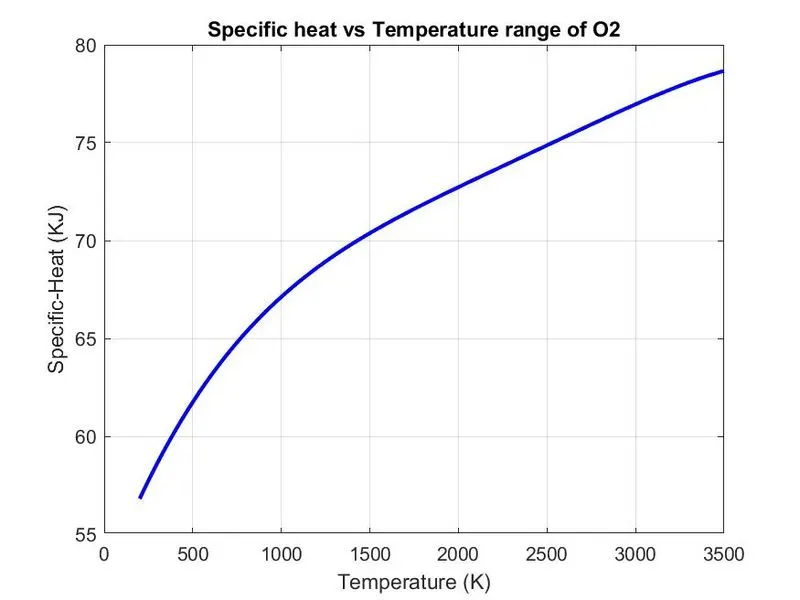
Plot of N2:
Plot of co2:
Error Occured:
Error1
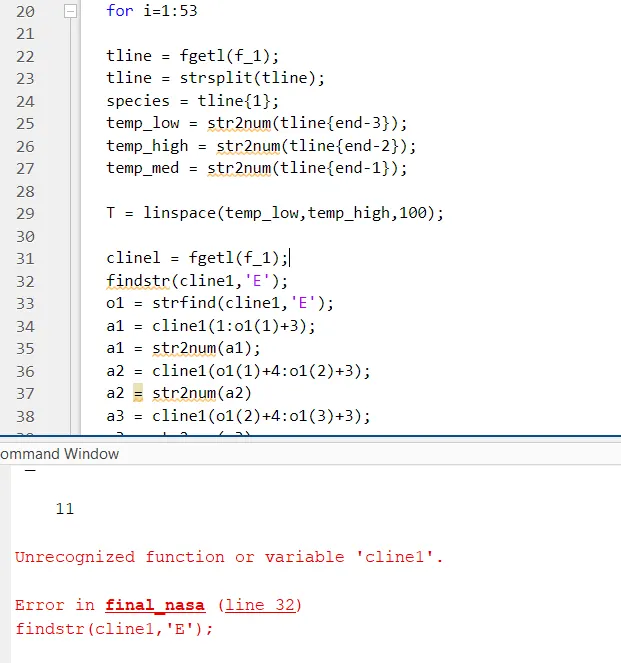
solution: the varible is clinel was corrected to cline1.
References:
https://in.mathworks.com/help/matlab/ref/fgetl.html?searchHighlight=fgetl&s_tid=srchtitle_fgetl_1
https://in.mathworks.com/help/matlab/ref/strfind.html?s_tid=doc_ta