Project 1 - Parsing NASA thermodynamic data
AIM :
Our main aim is to extract the coefficients & local temperatures values from the given data and find the enthalpy.entropy,specific heat,molecular weight of each and every species.
OBJECTIVE :
1. To Write a function that extracts the 14 co-efficients and calculates the enthalpy, entropy and specific heats for all the species in the data file. You will be reading this file NASA thermodynamic data(Tip: use fopen and fgetl).by using below formula
2. To Calculate the molecular weight of each species and display it in the command window.
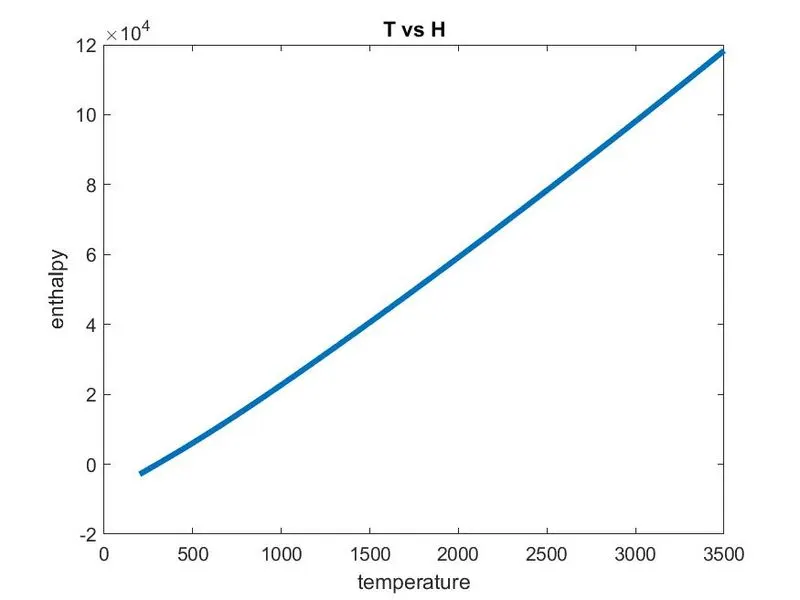
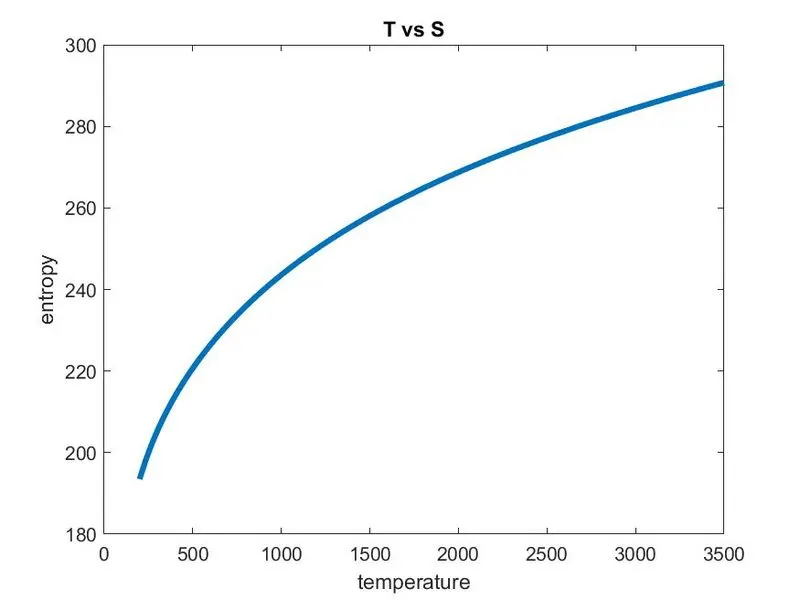
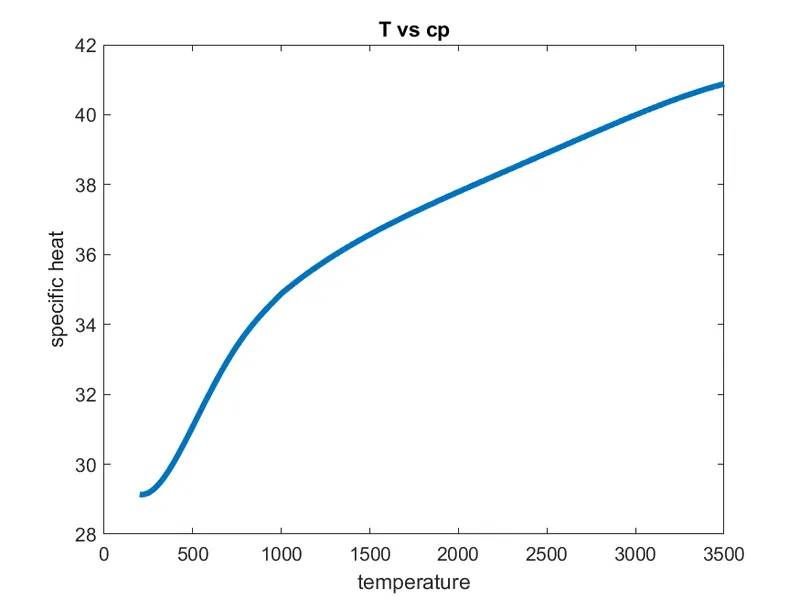
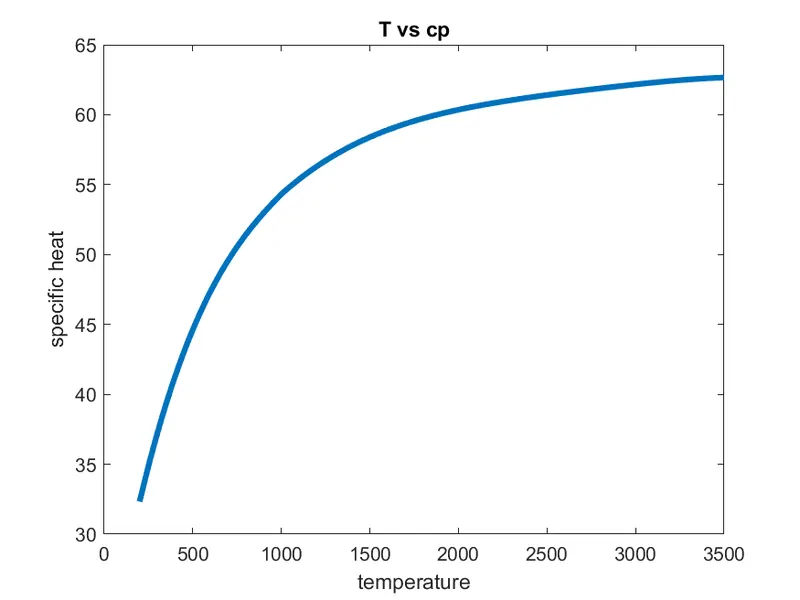
3. ToPlot the Cp, Enthalpy and Entropy for the local temperature range (low temperature : high temperature) specific for each species.
4.To Save the plots as images with appropriate names and dump them in separate folders for each species with suitable name. All these should be generated automatically.
5. The main program that you will submit will just take the "THERMO.dat" file as an input and generate Cp, H and S plots.
6. To write a detailed report to describe your logic.
Attachments to show
- Screenshot of the window where all the folders are saved.
- Plots for o2, N2 and Co2 species (your program should be case insensitive, if it is going to take the species name as an input).
EQUATION:
Here R is the universal gas constant, T is the temeprature
- The FIRST 7 coefficients are HIGH-temperature coefficients and the SECOND 7 coefficients are LOW-temperature coefficients.
- Also use the LOCAL TEMPERATURE RANGES which is unique for each individual species, not the GLOBAL TEMPERATURE RANGE.
HERE, Cp =specific heat (j/kg k)
T =temperature (degrees)
R =universal gas constant ; (j/k mol)
H= enthalpy; (j/kg)
S=entropy; (j/k)
Definition of the given properties :
ENTHALPY : a thermodynamic quantity equivalent to the total heat content of a system. It is equal to the internal energy of the system plus the product of pressure and volume.
- Enthalpy H can be written as, H = U + pV. Where, H = Enthalpy of the system. U = Internal energy of the system. p = Pressure of the system. V = Volume of the system. Enthalpy is not measured directly, however, the change in enthalpy (ΔH) is measured, which is the heat added or lost by the system.
Entropy :
-
the heat required to raise the temperature of the unit mass of a given substance by a given amount (usually one degree).
clear all
close all
clc

f1=fopen("THERMO.dat",'r')
for i=1:5
    a=fgetl(f1)
end
for i=1:53
%to get the   local temperature information
temp=fgetl(f1);
a=strsplit(temp,' ') %strsplit is used to split the strings into individual
species_name=(a{1}); %since we are dealing with the cell array we use curly braces
endl=length(a)
loc_min_temp=str2double(a(endl-3));
loc_mid_temp=str2double(a(endl-1));
loc_high_temp=str2double(a(endl-2));

%find the coefficient values of the above species
line_1=fgetl(f1);
l1=strfind(line_1,'E'); %strfind is used to find the string in the given line
a1=str2double(line_1(1:l1(1)+3));
a2=str2double(line_1(l1(1)+4:l1(2)+3));
a3=str2double(line_1(l1(2)+4:l1(3)+3));
a4=str2double(line_1(l1(3)+4:l1(4)+3));
a5=str2double(line_1(l1(4)+4:l1(5)+3));

line_2=fgetl(f1);
l2=strfind(line_2,'E');
a6=str2double(line_2(1:l2(1)+3));
a7=str2double(line_2(l2(1)+4:l2(2)+3));
a8=str2double(line_2(l2(2)+4:l2(3)+3));
a9=str2double(line_2(l2(3)+4:l2(4)+3));
a10=str2double(line_2(l2(4)+4:l2(5)+3));

line_3=fgetl(f1);
l3=strfind(line_3,'E');
a11=str2double(line_3(1:l3(1)+3));
a12=str2double(line_3(l3(1)+4:l2(2)+3));
a13=str2double(line_3(l3(2)+4:l3(3)+3));
a14=str2double(line_3(l3(3)+4:l3(4)+3));

T=linspace(loc_min_temp,loc_high_temp,1000);
R=8.314;

%find the entropy, enthalphy, specific heat by calling the function
[cp,H,S]=coeffs(a1,a2,a3,a4,a5,a6,a7,a8,a9,a10,a11,a12,a13,a14,loc_mid_temp,R,T)

%plotting T vs cp
figure(1)
plot(T,cp,'linewidth',3)
xlabel('temperature')
ylabel('specific heat')
title('T vs cp')

%plotting T vs H
figure(2)
plot(T,H,'linewidth',3)
xlabel('temperature')
ylabel('enthalpy')
title('T vs H')

%plotting T vs S
figure(3)
plot(T,S,'linewidth',3)
xlabel('temperature')
ylabel('entropy')
title('T vs S')

%creat folder and save all plots in that folder
mkdir(species_name);
cd(species_name);

%save plots
saveas(1,'specific heat','png')
saveas(2,'enthalpy','jpg')
saveas(3,'entropy','jpg')
cd ..
   mol_wt=molecular_wt(species_name)
   fprintf('molecular wt of %s = %.1f',species_name,mol_wt)
end

fclose(f1)
Function program for variables :
%to find thermodynamics properties cp,H,S
function [cp,H,S]=coeffs(a1,a2,a3,a4,a5,a6,a7,a8,a9,a10,a11,a12,a13,a14,loc_mid_temp,R,T)
for i=1:length(T)
 if T(i)>loc_mid_temp
     cp(i) = (a1+(a2*T(i))+(a3*T(i).^2)+(a4*T(i).^3)+(a5*T(i).^4))*R;
      H(i)=(a1+(a2*T(i)/2)+(a3*(T(i).^2)/3)+(a4*(T(i).^3)/4)+(a5*(T(i).^4)/5)+(a6./T(i))).*T(i)*R;
       S(i)=((a1*log(T(i)))+(a2*T(i))+(a3*(T(i).^2)/2)+(a4*(T(i).^3)/3)+(a5*(T(i).^4)/4)+a7)*R;
   else
       cp(i)=(a8+(a9*T(i))+a10*T(i).^2+a11*T(i).^3+a12*T(i).^4)*R;
        H(i)=(a8+(a9*T(i)/2)+(a10*(T(i).^2)/3)+(a11*(T(i).^3)/4)+(a12*(T(i).^4)/5)+(a13./T(i))).*T(i)*R;
         S(i)=((a8*log(T(i)))+(a9*T(i))+(a10*(T(i).^2)/2)+(a11*(T(i).^3)/3)+(a12*(T(i).^4)/4)+a14)*R;
  end
 end
end
function for molecular weight:
function mol_wt =molecular_wt(species)
element=['O','H','C','N','AR'];
atomic_wt=[16,2,12,14,40];
mol_wt=0;

for i=1:length(species)
    for j=1:length(atomic_wt)
        if strcmp(species(i),element(j))
            mol_wt=atomic_wt(j)+mol_wt;
            pos=j;
        end
    end

n=str2double(species(i));
if n>1
    mol_wt=mol_wt+atomic_wt(pos)*(n-1);
end
end
end
Steps followed for main script :
1)since we are writing a new script we have to erase all the existing variables in the editor wind,command window,workspace by using.clear all followed by close all followedby clc.
2)open & read the given file by using fopen followed by the file name since we are reading the values we should add r ,given a variable name called f1.
3)fgetl command is used to get the next line from the file.if we execute fgetl command every time we will get every next of the given file. since we don't have any useful data from the first 5 lines we are skillping those lines by using fgetl 5 times.
4)if we observe the file we have the species name and the temperture values in the string form.strsplt is the command is used to split the strings in individual.after store the species names in the variable called species_name.
5)To ge the local temperature values of middle,high,low temperature values use str2double since it is stored as a string.str2num command is used to convert thatstring to number.now it is feasible to use the temperature values.
6)extract the coefficient from the given file which is contained next three lines total of 15 coefficient values.coefficient values are in the exponential form and also same length.since it contains the string 'E' we have to find out the place of 'E' first .
7)after that by using str2 double and adding the remaining values presented after the string 'E' ,IN THIS PROCESS we will be able to fine the 14 coefficients by naming from a1 to a14.
8) as per the aim of the given challenge first 1st 7 coefficients are high temperature coefficients and the remaining are low temperature coefficients.we have to creat an array for the local minimum temperatures.
9)since we are finding two conditions and find the coefficients for 2 conditions we have to write a function for the given properties.and R here is universal gas contant law =8.314 which is constant
10)we are finding high temperature coefficients first so it should be greater than the local mid tempearature so we use if conditiom T>local middle temperature.we have pass this condition by using if ,pass the next condition or use else statement which will find out the remaining low temperature values and its properties values.
11)if we see we are trying to find the 3 properties{cp,h,s} in the same function.since we are doing this we have to creat a for loop for the temperature after the function. by using this possibly we will get the exact results since so many variables are containg the same function we are using for loop for the accurat result.
12)after creating the function we have to call the function in main program so that we will be able to get the cp,h,s properties
13)after that we will have to plot the temperature vs cp,h,s in three figures for better understanding purpose.
title and label command are used to get the proper axis names and the titile name for the curve.
14)save the plots by creating the directory name called mkdir is the command is to making the directory foloowed by the name that we want to give.cd isthe command is used to creat the directory after that use saveas followed by the figure name,name of the plot and add.png since it is a picture form.finally it will creat a folder for the graphs.we use the same method for the remaing two graphs.finally cd .. is used to get back from the directory.
15)molecular weight: creat function for molecular weight if we observe the given data we observe the one species contains 2 or 3 combination of atoms we use to find the atoms for each and every species inside the given data file.function name that we have given here is molecular weight.
16)we have to define the elements and the respective atomic weights.in which the order of the elements and the order of the atomic weights which we gave must be same.
17)then creat a for loop for both the elements and atomic wts and then compare this two loops.for comparing we use strcmp command so that it will compare with one on one.
18)take 02 for example it is in the combination of both string and number first we compare the 1st value in the o2.first value is 0 and it will compare to the atomic weight we will get the value of 16 & the second value is 2 which is in string form convert that to number form by using str2num .since the number to is greater than 1 the given condition is satisfied and it will take n=2 substite in the next eq molecular_wt=mol_wt+atomic_wt(pos)*(n-1),in this process we will get the atomic number for all the molecules.
19)call this molecular weight function in the main program we will get the molecular weight of the particular species.to get the values in a proper way we use fprintf ('molecular weight of %s : %f' ,species_name,mol_wt)
20).if we observe the data each species contains only 14 coefficients,3 different temperatures and aslo located in the same place and same length.the main thing is here to find properties and plots,local temperatures,molecular weights for all the species we use for loop for 53 times since the data positions is similar for all the species.
plot for O2 :
plots for N2 :
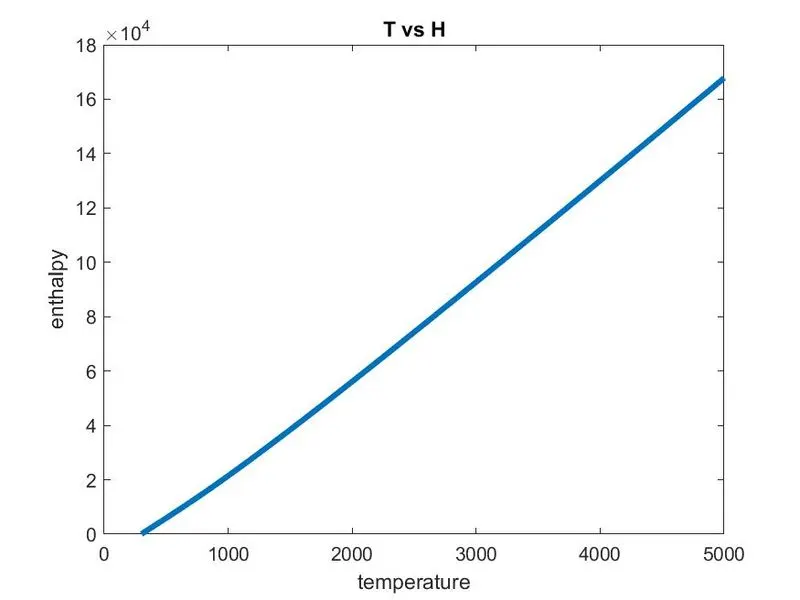
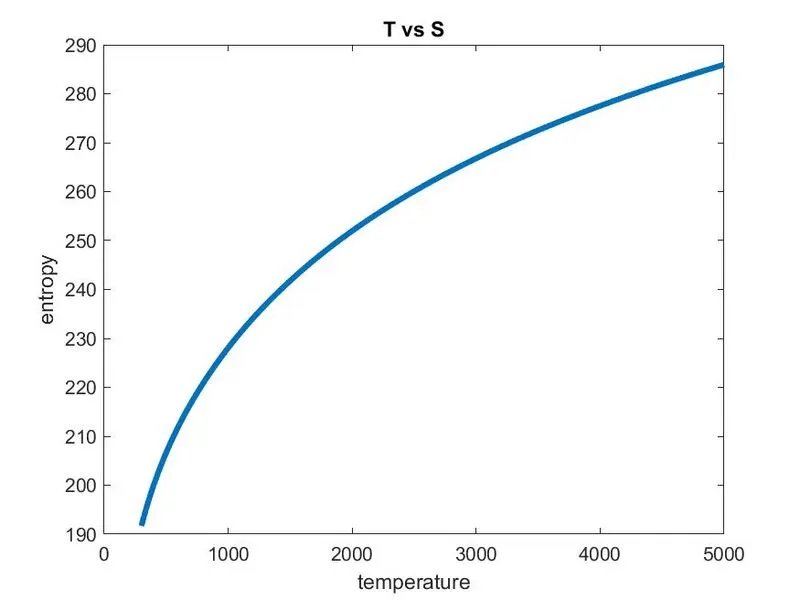
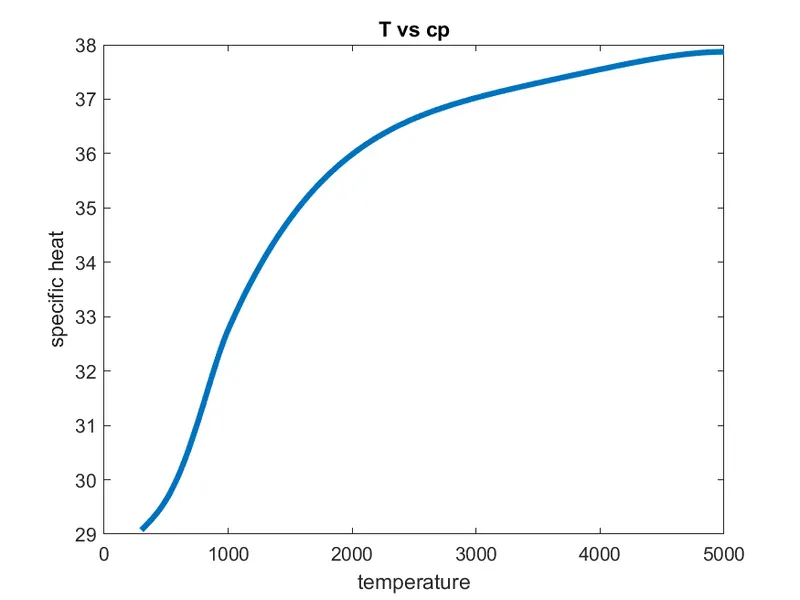
plots for CO2 :
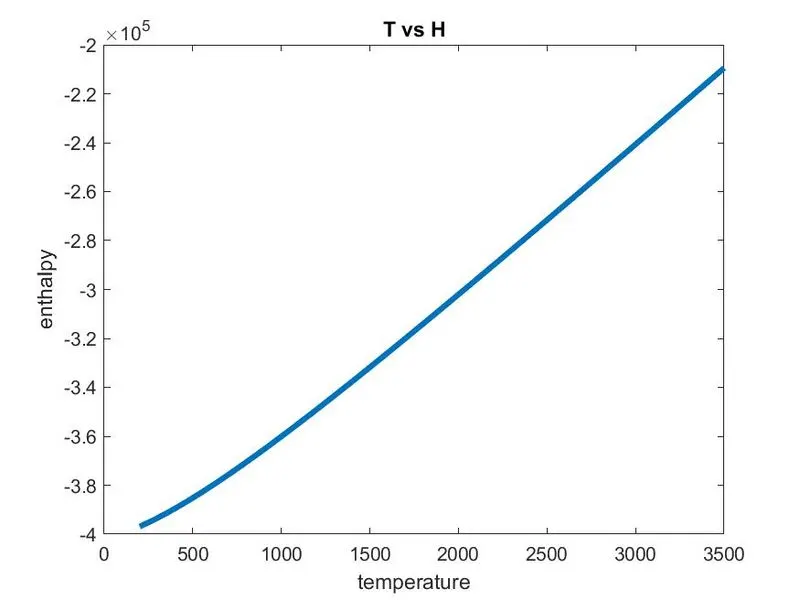
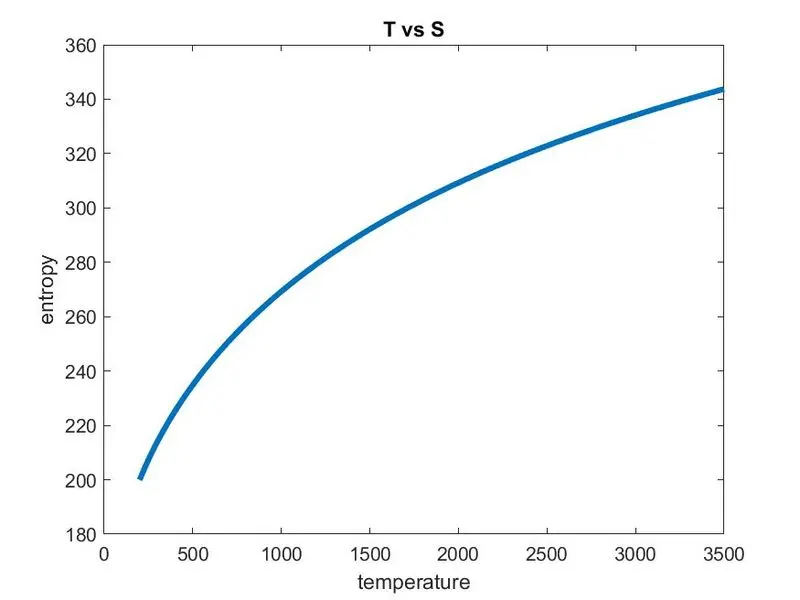
conclusion:
1)calculated the cp,h,s,molecular weights of all the species
2)extracted the coefficients ,local minimun temperatures,species names form the given file.
3)plotted the graphs for cp,h,s with respect to the temperature.
4)created a directory for all the species.
5)find out the higher and lower temperature coefficients of each species.
references :
1)mathworks official websites &mathworks community
2)matlab commands provided by skill lync.
3)youtube & mainly technical engineering support.