Project 1 - Parsing NASA thermodynamic data
Aim :- Write a Matlab program that extracts the 14 co-efficients and calculates the enthalpy, entropy and specific heats for all the species in the data file.
Objective :-
- Write a function program to calculate the specific heat, enthalpy, & entropy of the species.
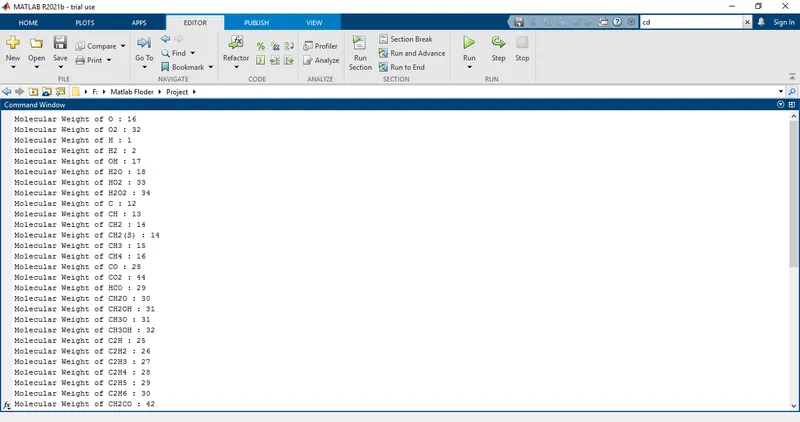
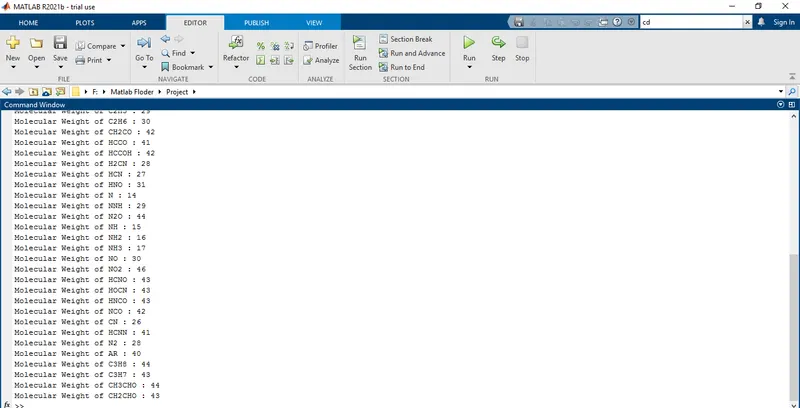
- Calculate the molecular weight of each species & display it in the command window.
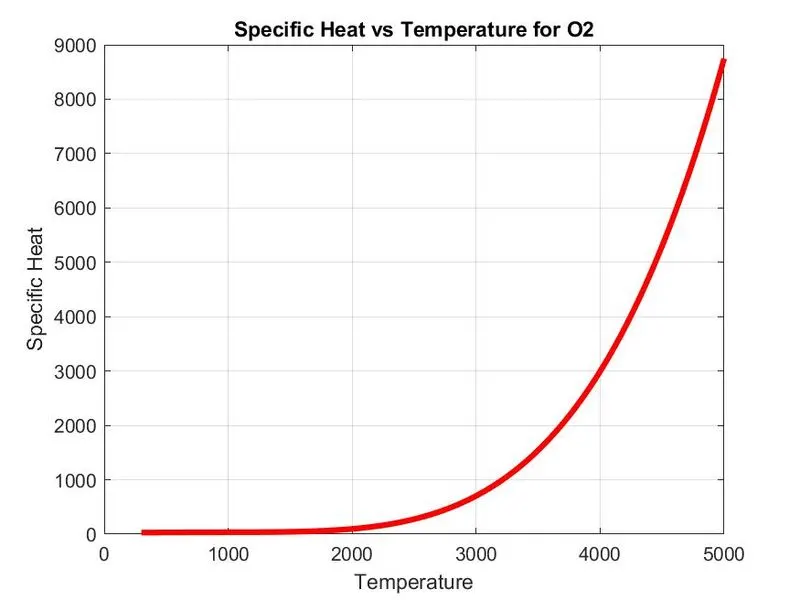
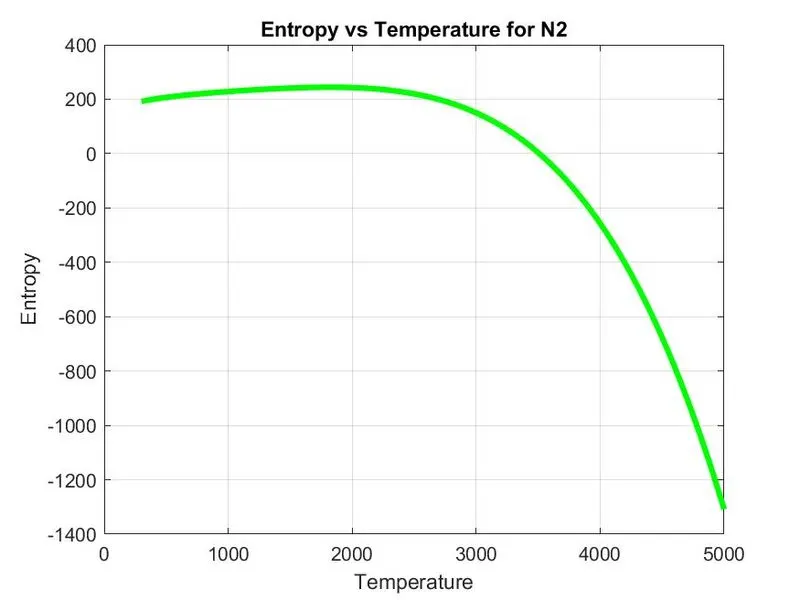
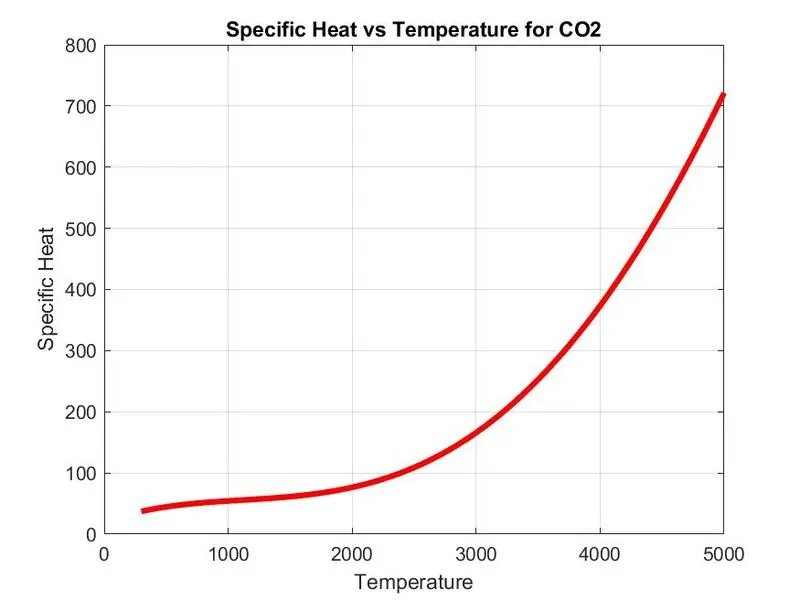
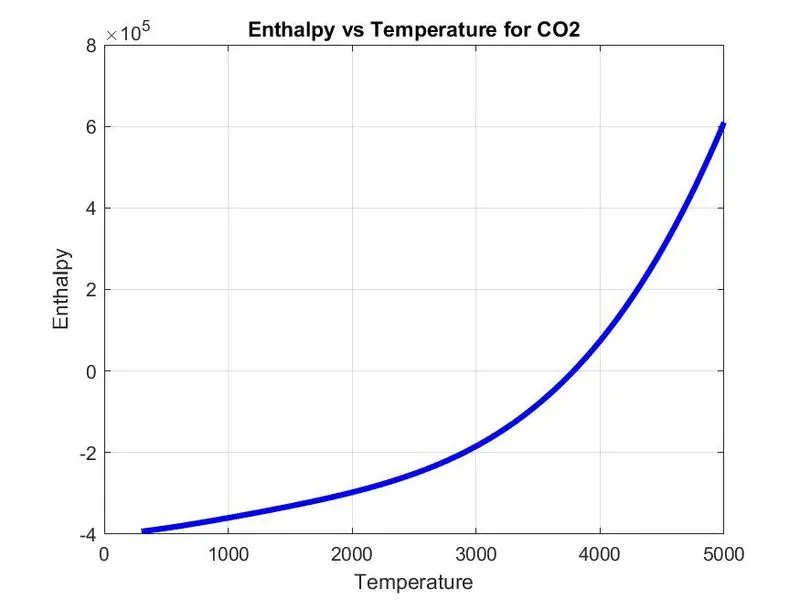
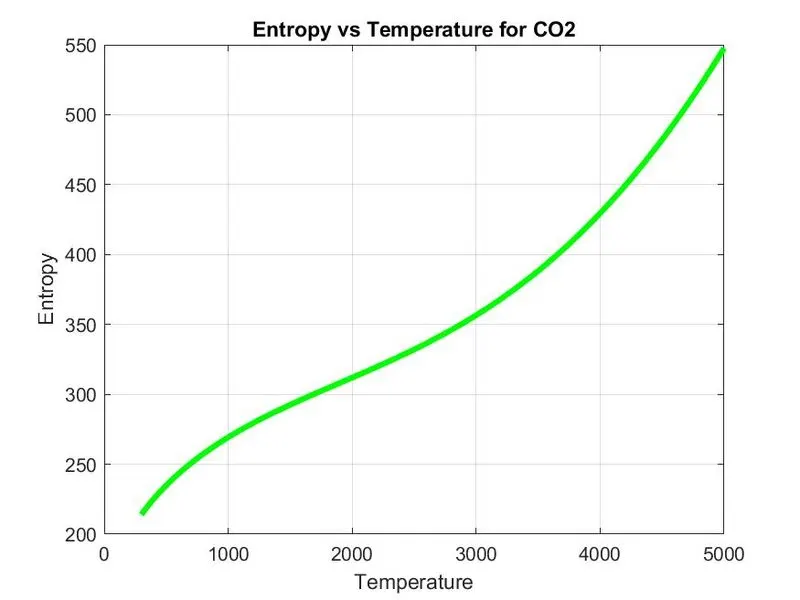
- Plot the specific heat, enthalpy, & entropy for local temperature range.
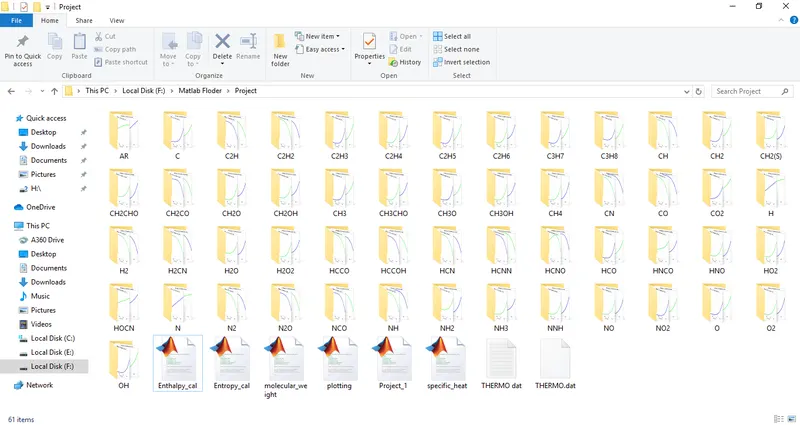
- Create separate folders for each species & save the plots as images.
Theory :-
Parsing :-
Parsing a file means reading in a data stream and building a memory model of the content of that data. This aims at facilitating perfoming some kind of transformation on the data. Parsing splits a file or other input into pieces of data that can be easily stored or manipulated.
File Parsing NASA thermodynamic data :-
NASA came up with polynomials that can be used to evaluate thermodynamic properties such as Cp, H and S. They have also documented the co-efficients that are required to evaluate these polynomials for 1000+ species.
Here we are Parsing 53 species from NASA thermodynamic data file i.e. 'THERMO.dat'.
In this we are calculating the '3' thermodynamic properties of elements & there species i.e. Specific Heat, Enthalpt, & Entropy.
The formulae which is used to calculate the following properties are given below

where,
Cp - Specific heat, J/Kg-k
H - Enthalpy, J
S - Entropy, J/k
R - Universal Gas constant for air, J/Kg-k
T - Temperature, k
a - Coefficients
1. Specific Heat (Cp) :- It is defined as the amount of heat needed to raise the temperature of 1 gram of a substance by 1 degree Celsius. The unit of Cp is 'J/Kg-k'.
2. Enthalpy (H) :- The enthalpy is defined to be the sum of the internal energy plus the product of the pressure and volume. In simple, it is the amount of heat or energy which is absored or required by the system to cause the change in the system. The unit of H is 'KJ/Kg'.
3. Entropy (S) :- It is the measure of a system’s thermal energy per unittemperature that is unavailable for doing useful work. Because work is obtained from ordered molecular motion. The amount of entropy is also a measure of the molecular disorder or randomness of a system. The unit of S is 'KJ/Kg-k'.
Main Matlab Code :-
clear all
close all
clc
% Write a matlab  Matlab program that extracts the 14 co-efficients.
% And calculates the Cp, H, & S for all the species in the data file.
f1 = fopen('THERMO.dat','r');
first_line = fgetl(f1);

% Obtaining global high, low & mid temperatures.
global_temp = fgetl(f1);
t_r = strsplit(global_temp,' ');
global_low_temp = str2num(t_r{2});
global_mid_temp = str2num(t_r{3});
global_high_temp = str2num(t_r{4});

% Range of temperature
T = linspace(global_low_temp,global_high_temp,1000);
R = 8.314;  % J/K_mol

% Skipping the next 3 comments in the file
for i = 3:5
    comments = fgetl(f1);
end

% Getting the coefficients of species
for i = 1:53
% Extracting line 1 & the name of species
l1 = fgetl(f1);
name = strtok(l1);

% Extracting higher & lower temperature coefficient
l2 = fgetl(f1);
l3 = fgetl(f1);
l4 = fgetl(f1);

a = strfind(l2,'E');
b = strfind(l3,'E');
c = strfind(l4,'E');

% Extracting higher temperature coefficients
a1 = str2num(l2(1:a(1)+3));
a2 = str2num(l2(a(1)+4:a(2)+3));
a3 = str2num(l2(a(2)+4:a(3)+3));
a4 = str2num(l2(a(3)+4:a(4)+3));
a5 = str2num(l2(a(4)+4:a(5)+3));
a6 = str2num(l3(1:b(1)+3));
a7 = str2num(l3(b(1)+4:b(2)+3));

% Extracting lower temperature coefficients
b1 = str2num(l3(b(2)+4:b(3)+3));
b2 = str2num(l3(b(3)+4:b(4)+3));
b3 = str2num(l3(b(4)+4:b(5)+3));
b4 = str2num(l4(1:c(1)+3));
b5 = str2num(l4(c(1)+4:c(2)+3));
b6 = str2num(l4(c(2)+4:c(3)+3));
b7 = str2num(l4(c(3)+4:c(4)+3));

% Specific heat calculation
Cp = specific_heat(a1,a2,a3,a4,a5,b1,b2,b3,b4,b5,T,R,global_mid_temp);

% Enthalpy Calculation
H = Enthalpy_cal(a1,a2,a3,a4,a5,a6,b1,b2,b3,b4,b5,b6,T,R,global_mid_temp);

% Entropy Calculation
S = Entropy_cal(a1,a2,a3,a4,a5,a7,b1,b2,b3,b4,b5,b7,T,R,global_mid_temp);

% Calculating molecular weight of species
molecular_wt(i) = molecular_weight(name);

% Creating seprate folder for each species & plotting
plotting(Cp,H,S,T,name)
cd ..
end
Explanation :-
- First we will save the 'THERMO.dat' file in the same folder were the Matlab files are saved.
- Then by 'fopen' & 'r' commands is used to open the 'THERMO.dat' file & read it. By header information we will extract the data from file using 'fgetl' command.
- Global temperature range is stored in the form of numbers using 'str2num' command.
- Then by using 'linspace' command we will assumed the temperature range of global low & global high temperatures to variable 'T'.
- The value of universal gas constant is assigned to variable 'R',
- Now, by using 'for-loop' we will skip the next 3 comments.
- Again by using 'for-loop' is used to read the data for all the 53 species one at a time.
- The required data will get from line 1 to line 4, line 1 describe the name of species & local temperature range for the species.
- Line 2 to line 4 contains 14 coefficients for the species out of which first 7 are high-temperature coefficients & the second 7 are low-temperature coefficients.
- These coefficients are extracted & converted from string data to numbers using 'str2num' command or we can use 'str2double' command also.
- Then the defined functions are called to calculate the corresponding properties of the species.
- Further, I have use plotting function to plot & save as 'png' files in seperate folder i.e. Cp vs T, H vs T, S vs T for each species.
Function Program :-
1. Program for calculation for Specific Heat
% Function program for calculation for Specific Heat
function[Cp] = specific_heat(a1,a2,a3,a4,a5,b1,b2,b3,b4,b5,T,R,global_mid_temp)
% Comparing with global temp.
% If temp is more it will take maximum coefficients.
 if T > global_mid_temp
     Cp = R.*(a1+a2.*T+a3.*T.^2+a4.*T.^3+a5.*T.^4);
 % If less than global it will take minimum coefficients.
 else
     Cp = R.*(b1+b2.*T+b3.*T.^2+b4.*T.^3+b5.*T.^4);
 end
end
2. Program for calcualtion of Enthalpy
% Function program for calculation of enthalpy
function [H] = Enthalpy_cal(a1,a2,a3,a4,a5,a6,b1,b2,b3,b4,b5,b6,T,R,global_mid_temp)
if T > global_mid_temp
    H = R.*(a1.*T+(a2.*T.^2)./2+(a3.*T.^3)./3+(a4.*T.^4)./4+(a5.*T.^5)./5+a6);
else
    H = R.*(b1.*T+(b2.*T.^2)./2+(b3.*T.^3)./3+(b4.*T.^4)./4+(b5.*T.^5)./5+b6);
end
end
3. Program for calculation of Entropy
% Function program for calculation of entropy
function[S] = Entropy_cal(a1,a2,a3,a4,a5,a7,b1,b2,b3,b4,b5,b7,T,R,global_mid_temp)
if T > global_mid_temp
    S = R*(a1.*log(T)+(a2.*T)+(a3.*(T.^2)./2)+(a4.*(T.^3)./3)+(a5.*(T.^4)./4)+a7);
else
    S = R*(b1.*log(T)+(b2.*T)+(b3.*(T.^2)./2)+(b4.*(T.^3)./3)+(b5.*(T.^4)./4)+b7);
end
end
4. Program for calculating Molecular Weight
% Function to calculate molecular weight
function [MW] = molecular_weight(name)
atoms = ['H','C','O','N','R'];
fprintf('Molecular Weight of ');
fprintf(name);
fprintf(' : ');
atomic_weight = [1 12 16 14 40];
MW = 0;
for i = 1:length(name)
    for j = 1:length(atoms)
        if strcmpi(name(i),atoms(j))
            MW = MW + atomic_weight(j);
            position = j;
        end
    end
    n = str2num(name(i));
    if n>1
        MW = MW + atomic_weight(position)*(n-1);
    end
end
fprintf('%d',MW);
disp(' ');
end
5. Program for plotting & creating the seperate folder for each species plot to save it.
% Function program for plotting & saving.
function plotting(Cp,H,S,T,name)
cd(pwd)
dir_name = name;
mkdir(dir_name);

figure(1)
plot(T,Cp,'linewidth',3,'color','r')
title(sprintf('Specific Heat vs Temperature for %s',name))
xlabel('Temperature')
ylabel('Specific Heat')
grid on

figure(2)
plot(T,H,'linewidth',3,'color','b')
title(sprintf('Enthalpy vs Temperature for %s',name))
xlabel('Temperature')
ylabel('Enthalpy')
grid on

figure(3)
plot(T,S,'linewidth',3,'color','g')
title(sprintf('Entropy vs Temperature for %s',name))
xlabel('Temperature')
ylabel('Entropy')
grid on

cd(dir_name)
saveas(figure(1),'Specific Heat.jpg')
saveas(figure(2),'Enthalpy.jpg')
saveas(figure(3),'Entropy.jpg')

end
Results :-
1. Screen-shot of the window where all the folders are save.
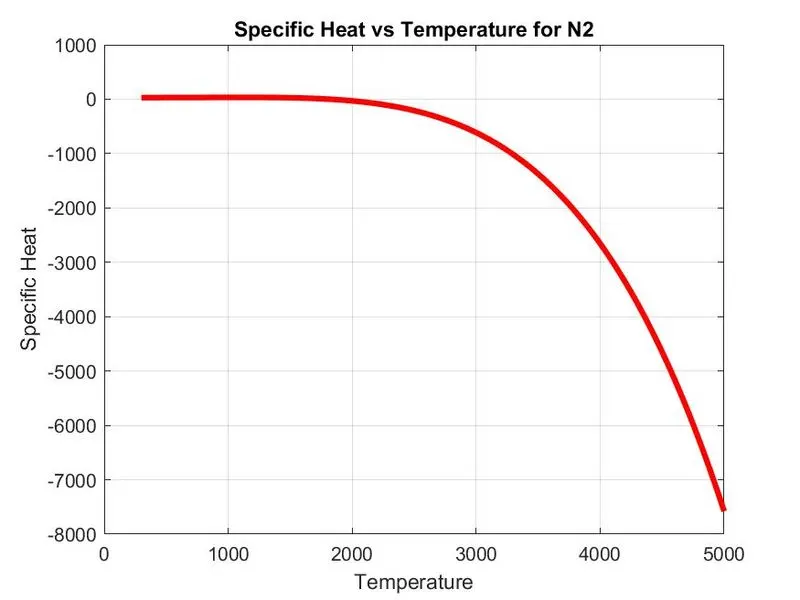
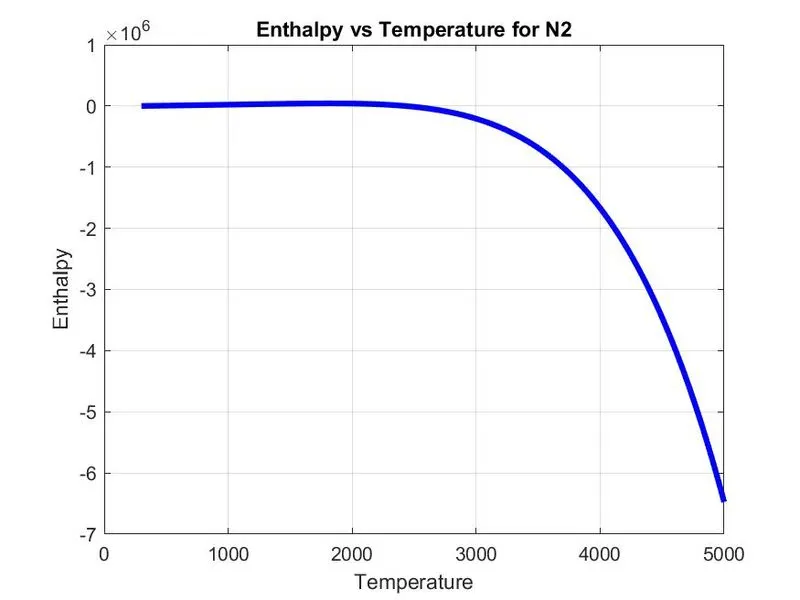
2. Plots for O2, N2, & Co2 species.
a. Plot for O2
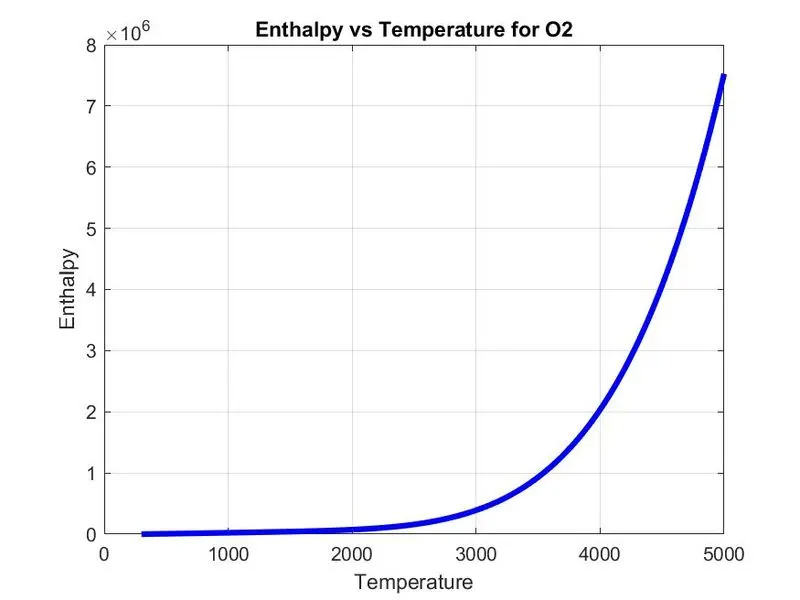
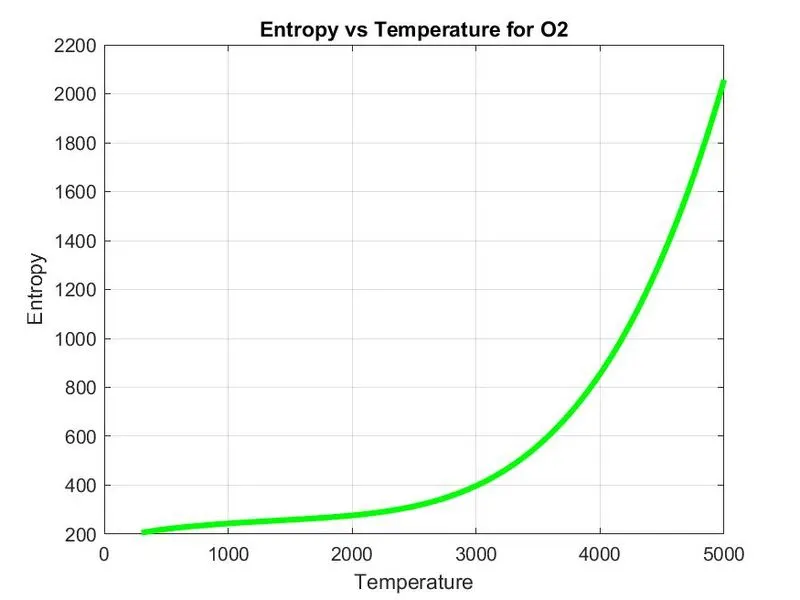
b. Plot for N2
c. Plot for Co2
3. Molecular Weight of each species & screen-shot of it display of it on the command window.