Project 1 - Parsing NASA thermodynamic data
AIM : To calculate specific heat, entropy, enthalpy and molecular weight for all given species given in NASA thermodynamic data file using matlab.
OBJECTIVE :
- To calculate specific heat, entropy, enthalpy and molecular weight for all species given in the data file.
- To create directory and store all species.
- Plot for all species and store in a particular file.
Specific heat vs Temperature
Enthalpy vs Temperature
Entropy vs Temperature
- Plot for ("O2","N2","CO2")
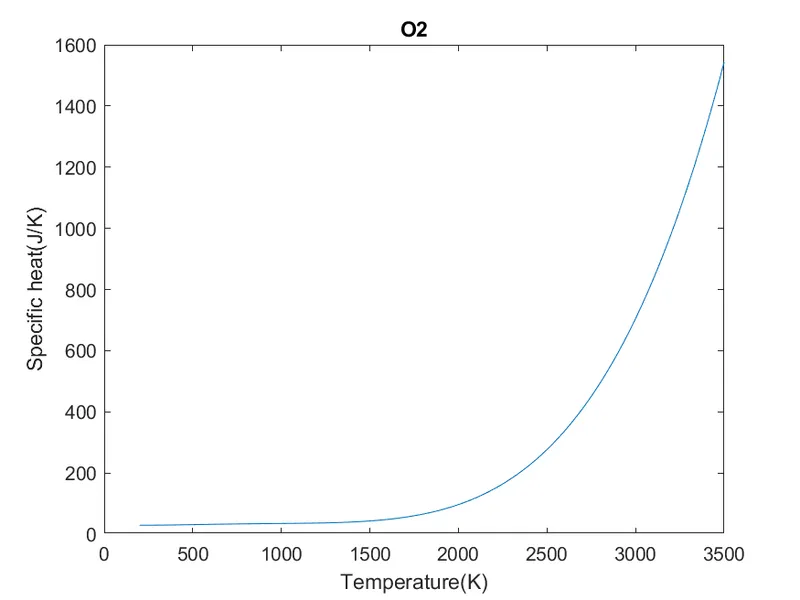
Specific heat vs Temperature
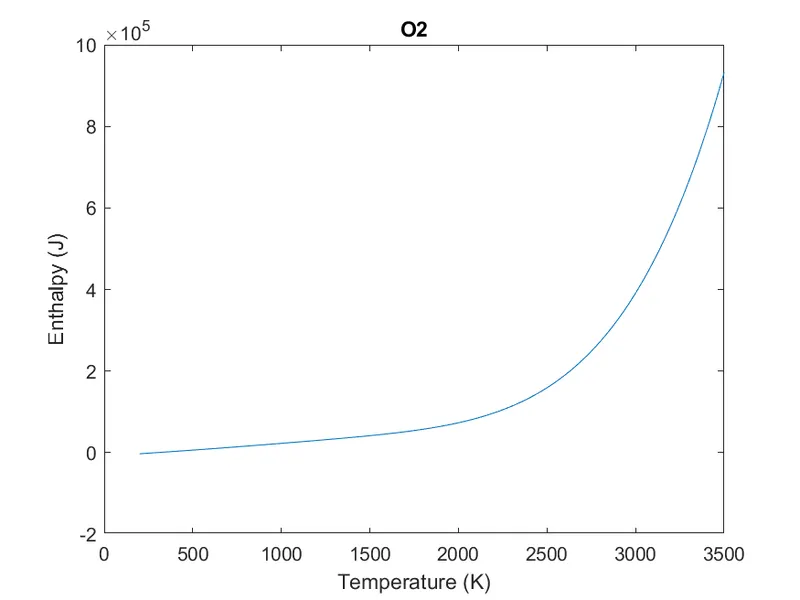
Enthalpy vs Temperature
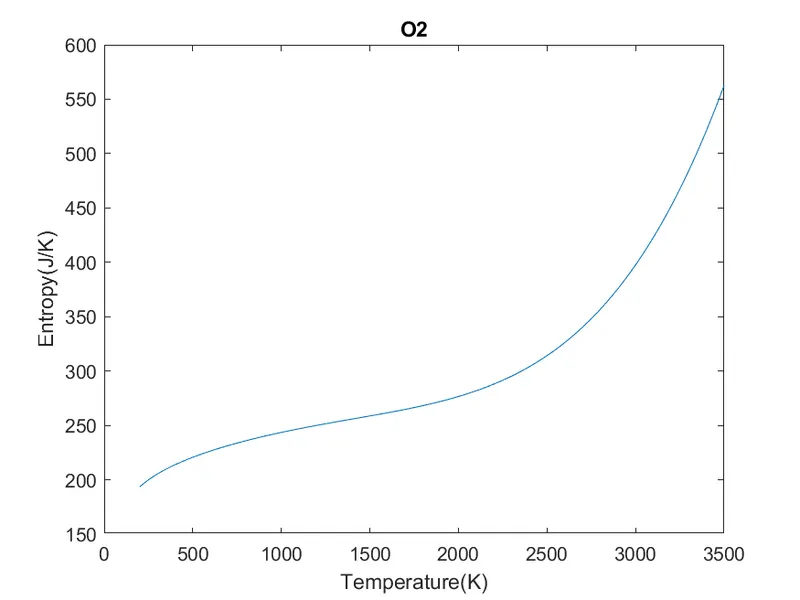
Entropy vs Temperature
INTRODUCTION :
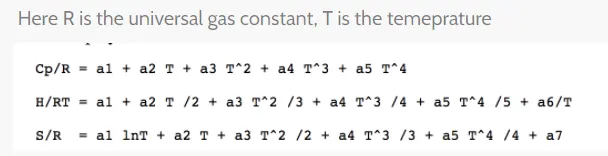
From the given thermodynamic file we need to read the external file and import all species coefficients and temperature values to the program in order to calculate the specific heat,entropy and enthalpy by using formulae. The specific heat is the amount of heat per unit mass required to raise the temperature by one degree celsius. Enthalpy the sum of internal energy and product of the pressure and volume of a thermodynamic system. Entropy the measure of a systems thermal energy per unit temperature that is unavailable for doing useful work.
The formulae for specific heat , enthalpy and entropy are given below
COMMANDS USED :
- (fopen) : By this command we will open the file with it specifies name which is NASA in .dat format and 'r' symbolise to read that file.It means we have a file with some name and we want to open that file in our matlab software to read the data. fopen is the command and with 'r' symbol coding notation. If we want to create any file then we will use 'W' symbol as coding notation which refers to write.
- fgetl(f1) : fgetl command is for taking the line and fgetl(f1) means taking the line from f1 file. once again typing the line refers to taking second line from the file f1.we can use this command so many times as number of lines to take from file. we can use this command to skip the lines which are not necessary in our case line l1 to l5 .
- strsplit : stringsplit refers to string split and ' ' is string splitter. it means that line l6 which is in single format will be splitted by stringsplit command.
- findstr : This refers to the find string at particular location in our case is at point which represents in our coding by ' ' it helps in selecting coeeficients for each species.
- mkdir : To storing the plots for molecular species we will make directory by mkdir command
- str2num : This command refers to converting string to number.
- cd : refer to change directory to save the plots for each species.
UNDERSTANDING THE MAIN CODE :
- Initially the given data file is read with help of fopen command with readind fuction.Then successive lines in the data file is extracted for global temperature range using fgetl command.
- The input through 'fgetl' is stored as string and 'strsplit' command to get all the coefficients.
- Using for loop to repeat the step- 2 for all species to get all coefficients.
- funtions are generated for specific heat , enthalpy,entropy and molecular weight for all species.
- 'mkdir' is used to create new folder and 'cd' is used to save the graph to current directory.
- 'saveas' is used to save the file.
UNDERSTANDING THE FUNCTIONS :
1.) MOLECULAR WEIGHT
- A character array is defined for the atoms and array of atomic weights respective to character array is defined.
- The input string is compared with character array when a match occurs associated atomic weight is taken.
- For molecules having numbers defining the number is first extracted, and calulation is made to store the output value of function.
- A variable is assaigned to store the output value of function.
2.) Enthalpy,Entropy and Specific heat
- Since the coefficcients available in data file is having a temperature constraint an if condition is used
- First 7 coefficients are high temperature coefficients and last 7 are low temperature coefficients to calculate thermodynamic property values , coefficients are selected with reference to temperature range.
MATLAB CODE :
clear all
close all
clc

%% OPENING THE NASA THERMO FILE
f1 = fopen('THERMO.dat','r');
 fgetl(f1);
global_temp_line  = fscanf(f1,'%f',[1,inf]);   %global temperature line

global_low_temp  = global_temp_line(1);           % global low temperature
global_mid_temp  = global_temp_line(2);           % global mid temperature
global_high_temp = global_temp_line(3);           % global high temperature

%% Skipping the lines from nasa data file using for loop

for k = 1:3
fgetl(f1)
end
% repeating for loop for 53 times. There are 53 types of species in the file
for i = 1:53

line = fgetl(f1);
a = strsplit(line,' ');
species_name = a{1};
local_low_temp = str2num(a{end-3});
local_high_temp = str2num(a{end-2});
local_mid_temp = str2num(a{end-1});
 T = linspace(local_low_temp,local_high_temp,100);
 R =8.314;      % universal gas constant
line_1 = fgetl(f1);
b1 = findstr(line_1,'E');
a_1 = str2num(line_1(1:b1(1)+3));                   % a_1 to a_14 are the 14 coefficients of the spiece
a_2 = str2num(line_1(b1(1)+4:b1(2)+3));
a_3 = str2num(line_1(b1(2)+4:b1(3)+3));
a_4 = str2num(line_1(b1(3)+4:b1(4)+3));
a_5 = str2num(line_1(b1(4)+4:b1(5)+3));

line_2 = fgetl(f1);
b2 = findstr(line_2,'E');
a_6 = str2num(line_2(1:b2(1)+3));
a_7 = str2num(line_2(b2(1)+4:b2(2)+3));
a_8 = str2num(line_2(b2(2)+4 :b2(3)+3));
a_9 = str2num(line_2(b2(3)+4 : b2(4)+3));
a_10 = str2num(line_2(b2(4)+4 : b2(5)+3));

line_3 = fgetl(f1);
b3 = findstr(line_3,'E');
a_11 = str2num(line_3(1:b3(1)+3));
a_12 = str2num(line_3(b3(1)+4:b3(2)+3));
a_13 = str2num(line_3(b3(2)+4:b3(3)+3));
a_14 =str2num(line_3(b3(3)+4:b3(4)+3));

% specific heat calculation

c_p =specific_heat_calc(a_1,a_2,a_3,a_4,a_5,a_8,a_9,a_10,a_11,a_12,local_mid_temp,T,R);

% enthalpy calculation

H = enthalpy(a_1,a_2,a_3,a_4,a_5,a_6,a_8,a_9,a_10,a_11,a_12,a_13,local_mid_temp,T,R) ;

%entropy calclation

s = entropy(a_1,a_2,a_3,a_4,a_5,a_7,a_8,a_9,a_10,a_11,a_12,a_14,local_mid_temp,T,R);

 %calculation of molecular weight
 Molecular_wt = molecular_weight(species_name);
 K = sprintf('%s Mol_wt = %f',species_name, Molecular_wt);
 disp(K)


% making directory
mkdir(['E:\matlab files\File_parsing\species_name',species_name]);

%current directory
directory = (['E:\matlab files\File_parsing\species_name',species_name]);
cd(directory)


% plotting temperature Vs specific heat
figure(1)
plot(T,c_p)
title( species_name  )
xlabel('Temperature(K)')
ylabel('Specific heat(J/K)')

%save the graph to particular file
% image = getframe(gcf)
%imwrite(image.cdata,'CpvsT.png')
saveas(1,'specific_heat','png')

%plotting Temperature vs enthalpy
figure(2)
plot(T,H)
title(species_name )
xlabel('Temperature (K)')
ylabel('Enthalpy (J)')
% image = getframe(gcf)
%imwrite(image.cdata,'hvsT.png')
saveas(2,'Enthalpy','png')

%plotting Temperature Vs Entropy
figure(3)
plot(T,s)
title(species_name )
xlabel('Temperature(K)')
ylabel('Entropy(J/K)')
% image = getframe(gcf)
%imwrite(image.cdata,'SvsT.png')
saveas(3,'Entropy','png')
cd ..
 %% Required species for plotting
 req_species = ["O2","N2","CO2"];
 if (species_name==req_species(1))||(species_name==req_species(2))||(species_name==req_species(3))

end
end
FUNCTION FOR SPECIFIC HEAT :
function[c_p] = specific_heat_calc(a_1,a_2,a_3,a_4,a_5,a_8,a_9,a_10,a_11,a_12,local_mid_temp,T,R)

 if (T > local_mid_temp)
    c_p = ((a_1) +(a_2*T)+(a_3*T.^2)+(a_4*T.^3)+(a_5*T.^4))*R ;
else
     c_p = ((a_8) +(a_9*T)+(a_10*T.^2)+(a_11*T.^3)+(a_12*T.^4))*R ;
 end

end
FUNCTION FOR ENTROPY:
function [s] = entropy(a_1,a_2,a_3,a_4,a_5,a_7,a_8,a_9,a_10,a_11,a_12,a_14,local_mid_temp,T,R)

if (T > local_mid_temp)
  s = (((a_1)*log(T) + ((a_2)*(T)) + ((a_3)*(T.^2))/2 + ((a_4)*(T.^3))/3 + ((a_5)*(T.^4))/4 + a_7)*R);
else
s = (((a_8)*log(T) + ((a_9)*(T)) + ((a_10)*(T.^2))/2 + ((a_11)*(T.^3))/3 + ((a_12)*(T.^4))/4 + a_14)*R);
end
end
FUNCTION FOR ENTHALPY:
function[H] = enthalpy(a_1,a_2,a_3,a_4,a_5,a_6,a_8,a_9,a_10,a_11,a_12,a_13,local_mid_temp,T,R)

if (T > local_mid_temp)
    H = (((a_1)*T + (a_2*T.^2)/2 + (a_3*T.^3)/3 + (a_4*T.^4)/4 + (a_5*T.^5)/5 + a_6) *R);
else
    H = (((a_8)*T + (a_9*T.^2)/2 + (a_10*T.^3)/3 + (a_11*T.^4)/4 + (a_12*T.^5)/5 + a_13) *R);
end
end
FUNCTION FOR MOLECULAR WEIGHT :
function [M] = molecular_weight(species_name)

atomic_mass = [15.999,1.008,12.011,14.007,39.948];
elements = ['O','H','C','N','A'];

Mol_wt = 0;
for i = 1:length(species_name)
    for j = 1:length(elements)
        if strcmpi(species_name(i),elements(j))
            Mol_wt = Mol_wt + atomic_mass(j);
            z = j;
        end
    end
    var = str2double(species_name(i));
    if (var>1)
        Mol_wt = Mol_wt + (atomic_mass(z)*(var-1));
    end
end
M = Mol_wt;
end
OUTPUT :
PLOTS - 02
Temperature vs Enthalpy
Temperature vs Entropy
Temperature vs specific heat
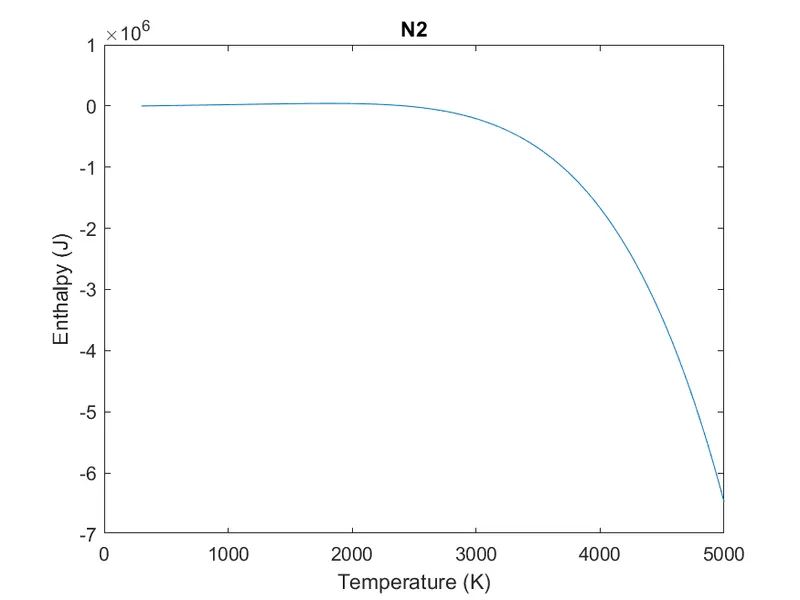
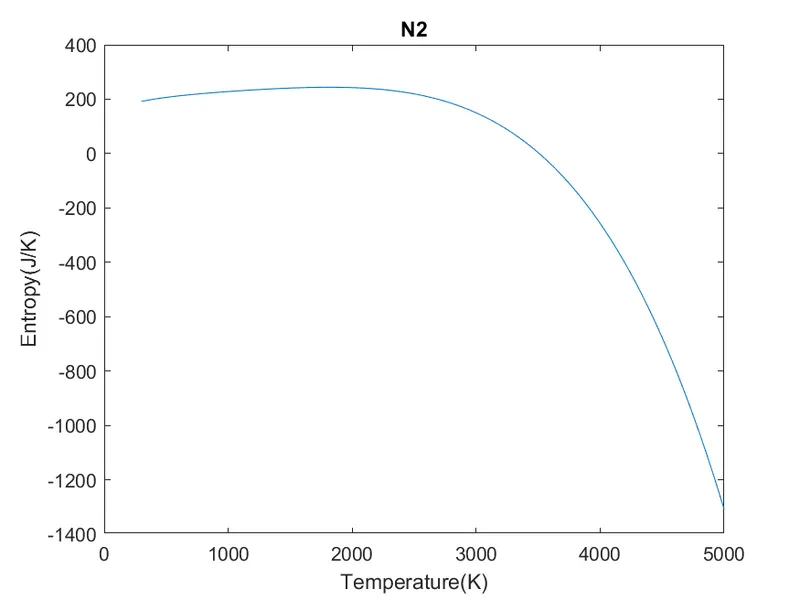
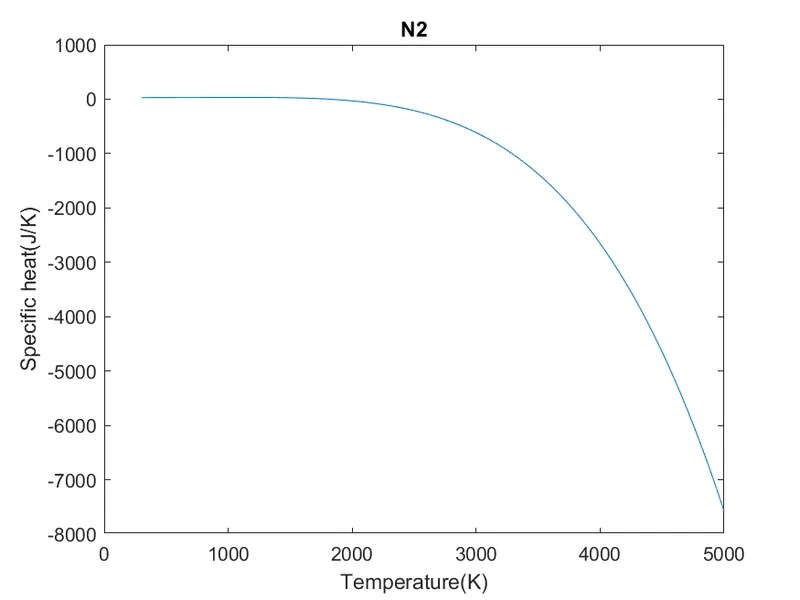
PLOTS - N2
Temperature vs Enthalpy
Temperature vs Entropy
Temperature vs specific heat
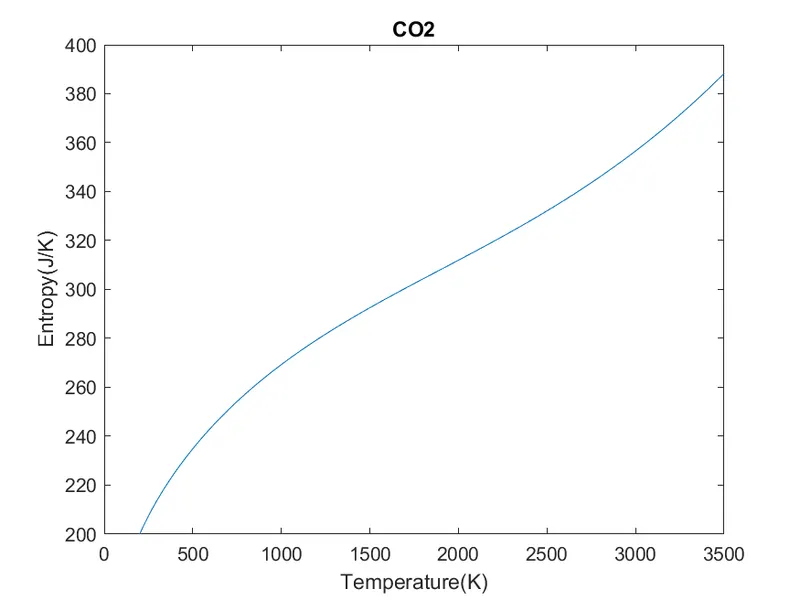
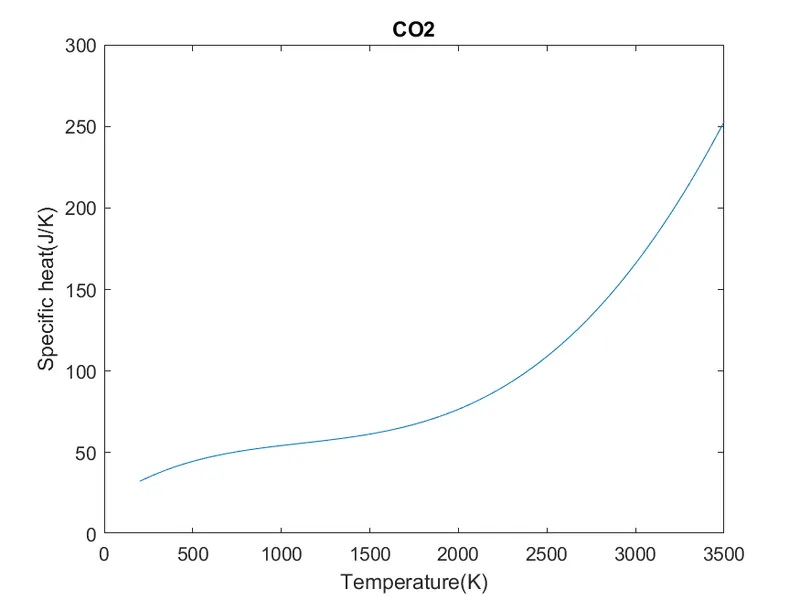
PLOTS - CO2
Temperature vs Entropy
Temperature vs Enthalpy
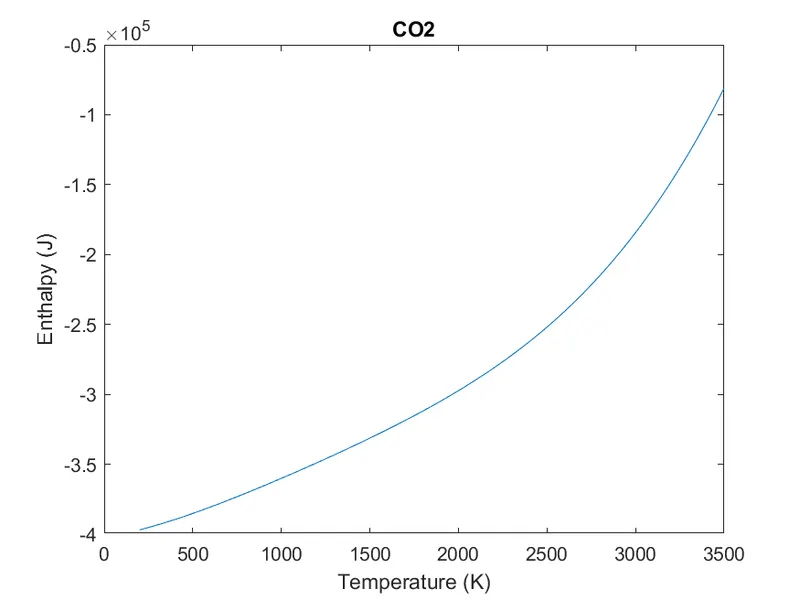
Temperature vs specific heat
All the species in folder is created (53 species)

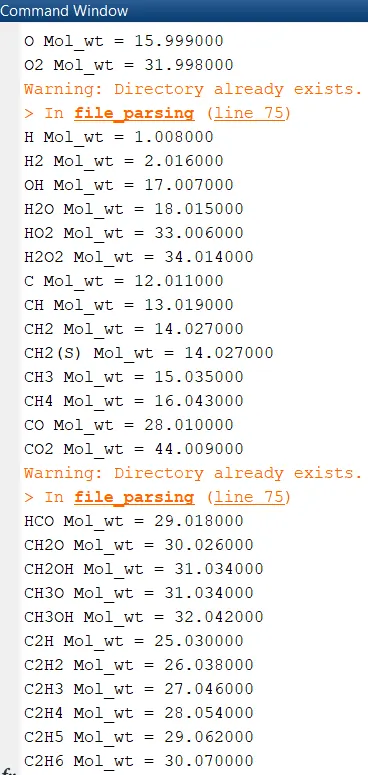
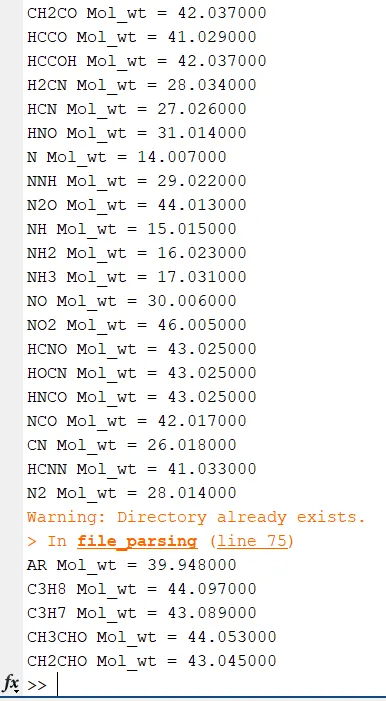
All molecular weight
CONCLUSION :
- Plots are obtained for all species and stored in particular file.
- All species molecular weights are calculated.
- Specific heat,entropy and enthalpy are calculated by using the formula any applied conditions like the first 7 coefficients are high temperature and second 7 coefficents are low temperature.