Project 1 - Parsing NASA thermodynamic data
Aim : To Extract NASA's Polynomial coefficients from thermodynamic data and calculating Specific heat ,Enthalpy ,Entropy.
Objective:
1.Extracting 14 coefficients from thermodynamic data by developing coding logic.
2. Making function for given variables using coefficients and equation.
3. Undertanding NASA's Thermodynamic Data and polynomials.
4. Plotting variation of given properties with temperature ranges and storing in seperate folder.
Theory :
The NASA polynomials have the form:
Cp/R = a1 + a2 T + a3 T^2 + a4 T^3 + a5 T^4
H/RT = a1 + a2 T /2 + a3 T^2 /3 + a4 T^3 /4 + a5 T^4 /5 + a6/T
S/R = a1 lnT + a2 T + a3 T^2 /2 + a4 T^3 /3 + a5 T^4 /4 + a7
where a1, a2, a3, a4, a5, a6, and a7 are the numerical coefficients supplied in NASA thermodynamic files. The first 7 numbers starting on the second line of each species entry (five of the second line and the first two of the third line) are the seven coefficients (a1 through a7, respectively) for the high-temperature range (above 1000 K, the upper boundary is specified on the first line of the species entry). The following seven numbers are the coefficients (a1 through a7, respectively) for the low-temperature range (below 1000 K, the lower boundary is specified on the first line of the species entry).
Matlab Main Programme :
close all
clear all
clc
%% -----------------------------------------------------------------------------------------------------------------------
%% inputs
R = 8.314 % Kj/kgk

%% -----------------------------------------------------------------------------------------------------------------------
%% programme for file parsing
f1 = fopen('THERMO.DAT')
skip_l1 =  fgetl(f1) % skipping first line
skip_l2 =  fgetl(f1) % skipping second line
% convertng to number
global_temp = str2num(skip_l2);
G_temp_low = global_temp(1);
G_temp_mid = global_temp(2);
G_temp_high = global_temp(3);
% skipping next 3 lines
skip_l3 =  fgetl(f1)
skip_l4 =  fgetl(f1)
skip_l5 =  fgetl(f1)

%% -----------------------------------------------------------------------------------------------------------------------%%
%% defining species name and finding coefficients
for i = 1:53
line_6 = fgetl(f1);% getting 6th line
species_name = line_6(1:5); % defining species name
[species_name] = deblank(species_name);% removing spaces

temp_range = line_6(49:75); % getting local temperature range
temp_range = str2num(temp_range); %converting to number and storing in variable
L_low_temp = temp_range(1); % low local temperature
L_mid_temp = temp_range(2); % mid local temperature
L_high_temp = temp_range(3); % high  local temperature
temp_range_local = linspace(L_low_temp,L_high_temp,500); % this temp range used for plotting

% skipping to next line and getting  coefficients
tline = fgetl(f1); % jumping on line 7
    % high temperature coeficients
    a = findstr(tline,'E'); % finding position of E in string
   % extracting coefficients
   % a1:a7 are high temperature range coefficients
   % A:A7 are low temperature range coefficients
    a1 = tline(1:a(1)+3); % defining position of coeff.
    a1 = str2num(a1);

    a2= tline(a(1)+4:a(2)+3);
    a2 = str2num(a2);

    a3= tline(a(2)+4:a(3)+3);
    a3 = str2num(a3);

    a4= tline(a(3)+4:a(4)+3);
    a4 = str2num(a4);

    a5= tline(a(4)+4:a(5)+3);
    a5 = str2num(a5);

    % Next line

    tline2 = fgetl(f1);% jumping on LINE 8
     a6 = tline2(1:a(1)+3);
    a6 = str2num(a6);

    a7 = tline2(a(1)+4:a(2)+3);
    a7 = str2num(a7);
    % low temperature coefficient
    A1 = tline2(a(2)+4:a(3)+3);
    A1 = str2num(A1);

    A2= tline2(a(3)+4:a(4)+3);
    A2 = str2num(A2);

    A3= tline2(a(4)+4:a(5)+3);
    A3 = str2num(A3);
    % next line
  tline3 = fgetl(f1);% jumping on line 9

    A4 = tline3(1:a(1)+3);
    A4 = str2num(A4);

    A5= tline3(a(1)+4:a(2)+3);
    A5 = str2num(A5);

    A6= tline3(a(2)+4:a(3)+3);
    A6 = str2num(A6);

     A7= tline3(a(3)+4:a(4)+3);
    A7 = str2num(A7);
    [T]=  temp_range_local;
   ELEMENT =  species_name
    [mw] = mw_function(species_name);
    molucular_weight = mw % displaying molucular weight in command window
    %% -----------------------------------------------------------------------------------------------------------------------
   %% calculating variables
    % specific heat
    [Cp] = Cp_function(a1,a2,a3,a4,a5,A1,A2,A3,A4,A5,R,T,L_mid_temp,temp_range_local);
    % enthalphy
    [H] = H_function(a1,a2,a3,a4,a5,a6,A1,A2,A3,A4,A5,A6,R,T,L_mid_temp, temp_range_local);
    %entropy
    [E] = E_function(a1,a2,a3,a4,a5,a6,a7,A1,A2,A3,A4,A5,A6,A7,R,T,L_mid_temp, temp_range_local);
  %% -----------------------------------------------------------------------------------------------------------------------
    %% plotting the variabes
    figure(1)
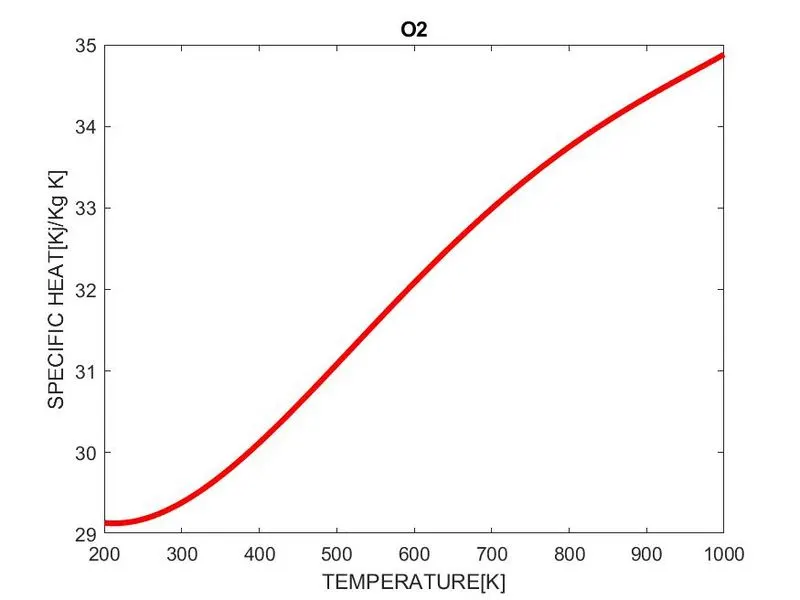
    plot(temp_range_local,Cp,'linewidth',3,'color','r');
    xlabel('TEMPERATURE[K]');
    ylabel('SPECIFIC HEAT[Kj/Kg K]')
    title(species_name)
    figure(2)
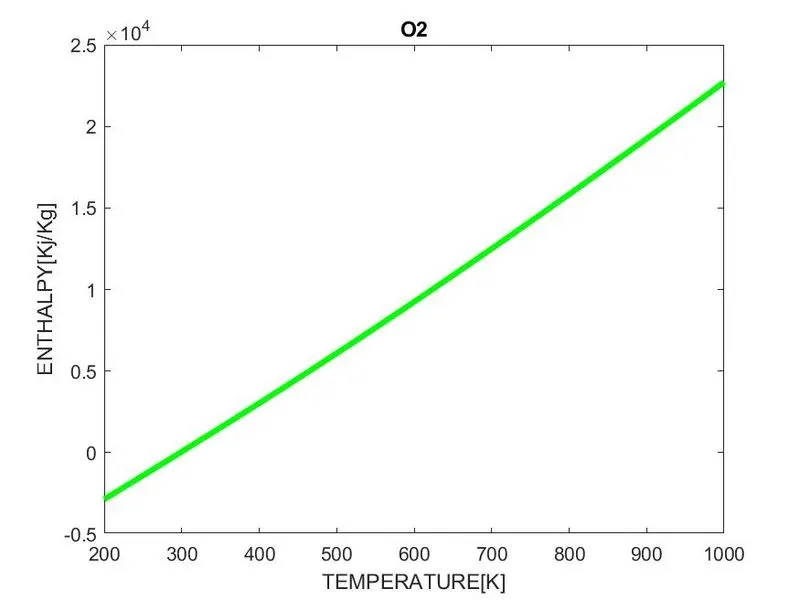
    plot(temp_range_local,H,'linewidth',3,'color','g');
    xlabel('TEMPERATURE[K]');
    ylabel('ENTHALPY[Kj/Kg]')
      title(species_name)
    figure(3)
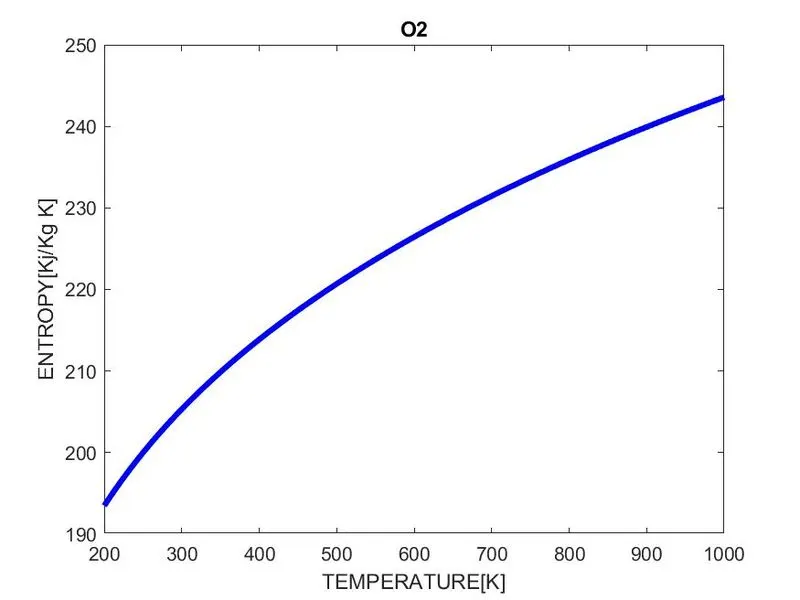
    plot(temp_range_local,E,'linewidth',3,'color','b');
     xlabel('TEMPERATURE[K]');
    ylabel('ENTROPY[Kj/Kg K]')
     title(species_name)
    %% -----------------------------------------------------------------------------------------------------------------------
    %% making directory
    cd('D:\matlab practice')% changes the current folder to old folder
    mkdir(species_name)% makes new folder
    cd(species_name) % displayes the new folder which we created using mkdir command
    % saving plots in species folder  folder
    saveas(figure(1),'Cp vs T.jpg');
    saveas(figure(2),'H vs T.jpg');
    saveas(figure(3),'E vs T.jpg');


   %% -----------------------------------------------------------------------------------------------------------------------
end
%% -----------------------------------------------------------------------------------------------------------------------
Plots Obtained from this programme:
O2
Commands I have used :
fopen = opening file from directory
fgetl = for jumping on lines/rows in data
str2num = converting string to number
deblank = clearing spaces in string
findstr = finding specific character in string ,in this code char is E
cd('D:\matlab practice') = changing current folder to old folder.
mkdir = making directory in current folder
cd(species_name) = displaying species_name folder so we can write in this folder .
saveas = saving plots into required file format.
strcmp = for comparing two string ,when two string matches it returns 1 otherwise 0(logical)
Functions :
1]Specific heat function :
%% defining function for specific heat
function [Cp] = Cp_function(a1,a2,a3,a4,a5,A1,A2,A3,A4,A5,R,T,L_mid_temp, temp_range_local);

for i = 1:length(T);

if T(i) <= L_mid_temp;
 Cp(i) = (A1+ A2.*T(i) +A3.*T(i).^2 + A4.*T(i).^3 +A5.*T(i).^4).*R;
else

Cp(i) = (a1+a2.*T(i) +a3.*T(i).^2 + a4.*T(i).^3 +a5.*T(i).^4).*R;

end
end
2]Enthalphy Function :
%% defining function for enthalphy
function [H] = H_function(a1,a2,a3,a4,a5,a6,A1,A2,A3,A4,A5,A6,R,T,L_mid_temp, temp_range_local);

for i = 1:length(T);

if T(i) >= L_mid_temp;
 H(i) = (a1 + (a2.*T(i))/2 +(a3.*T(i).^2)/3 + (a4.*T(i).^3)/4 +(a5.*T(i).^4)/5 +(a6)./T(i)).*R.*T(i);
else

H(i) = (A1 + (A2.*T(i))/2 +(A3.*T(i).^2)/3 + (A4.*T(i).^3)/4 +(A5.*T(i).^4)/5 +(A6)./T(i)).*R.*T(i);

end
end
3]Entropy Function:
%% defining function for entropy
function [E] = E_function(a1,a2,a3,a4,a5,a6,a7,A1,A2,A3,A4,A5,A6,A7,R,T,L_mid_temp, temp_range_local);

for i = 1:length(T);

if T(i) <= L_mid_temp;
     E(i) = (A1.*log(T(i)) + A2.*T(i) + (A3.*T(i).^2)/2 + (A4.*T(i).^3)/3 + (A5.*T(i).^4)/4 + A7 ).*R;
else

E(i) = (a1.*log(T(i)) + a2.*T(i) + (a3.*T(i).^2)/2 + (a4.*T(i).^3)/3 + (a5.*T(i).^4)/4 + a7 ).*R;

end
end
4]Molucular weight function:
element = {'O','H','N','C','S','Ar'};
Atomic_masses = [16,1,14,12,32,40];
mw = 0;
for i =1:length(species_name);
    for j = 1:length(element);
        if strcmp(species_name(i),element(j));
            mw = mw + Atomic_masses(j);
           k = Atomic_masses(j);
        end
    end
    n = str2num(species_name(i));
    if n>1 ;
        mw = mw + (n-1)*k;
    end
end

end
Folders i have made :

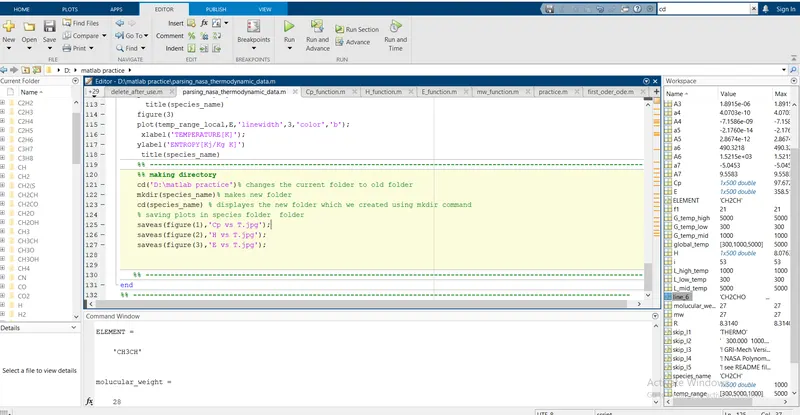
Command Window :
showing molucular weight and all variables :

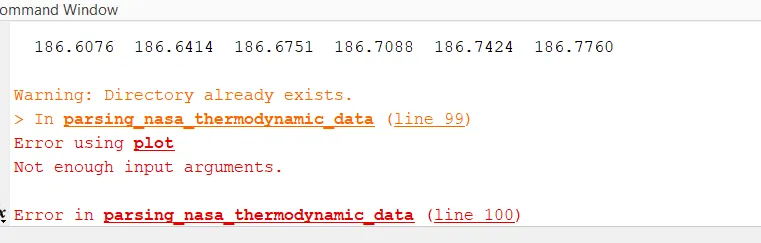
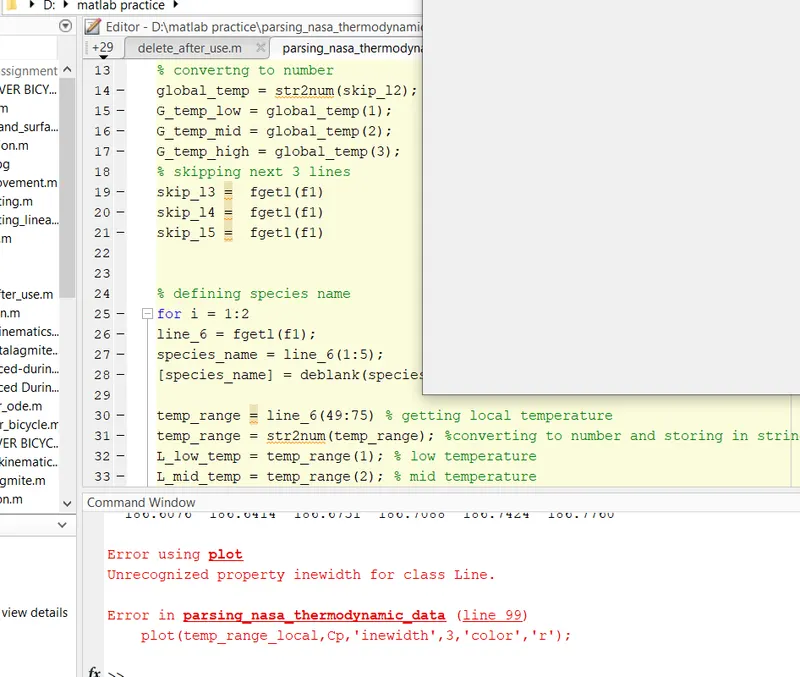
ERRORS:
Error No. 1 :
Error No. 2 :
wrong linewidth spelling
CONCLUSION :
In this project i have parsed NASA's Thermodynamic data file and extracted polynomial coefficients. plotted Specific heat,Enthalpy,Entropy plot with temperature variation.