Project 1 - Parsing NASA thermodynamic data
AIM:
To write a code to evaluate thermodynamic properties of Specific heat (cp), Enthalpy (H),Entropy ( S) for all the species in the data file.
OBJECTIVE:
- To write a function that extracts the 14 co-efficients and calculates the enthalpy, entropy and specific heats for all the species in the data file.
- Calculate the molecular weight of each species
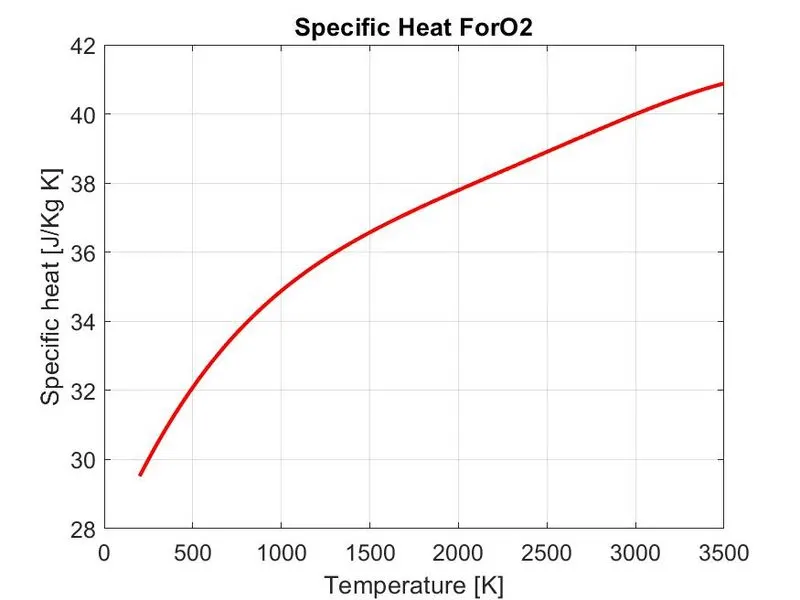
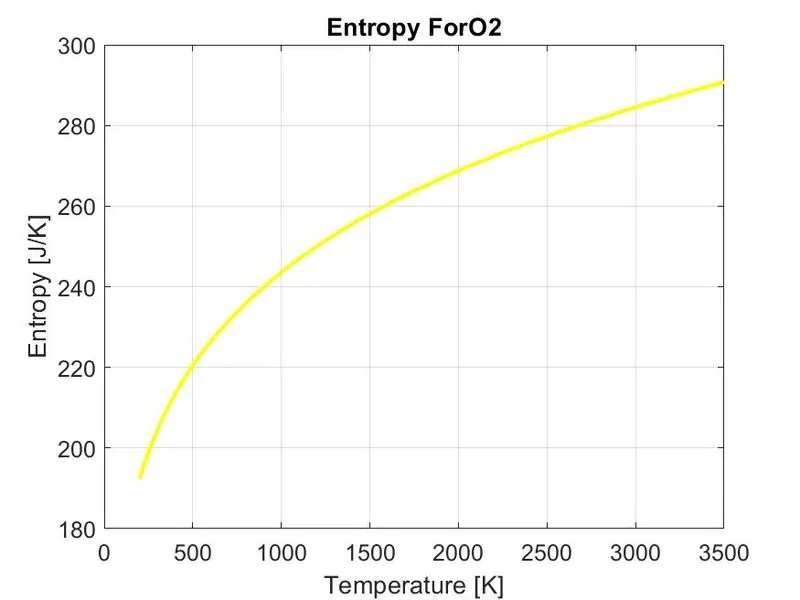
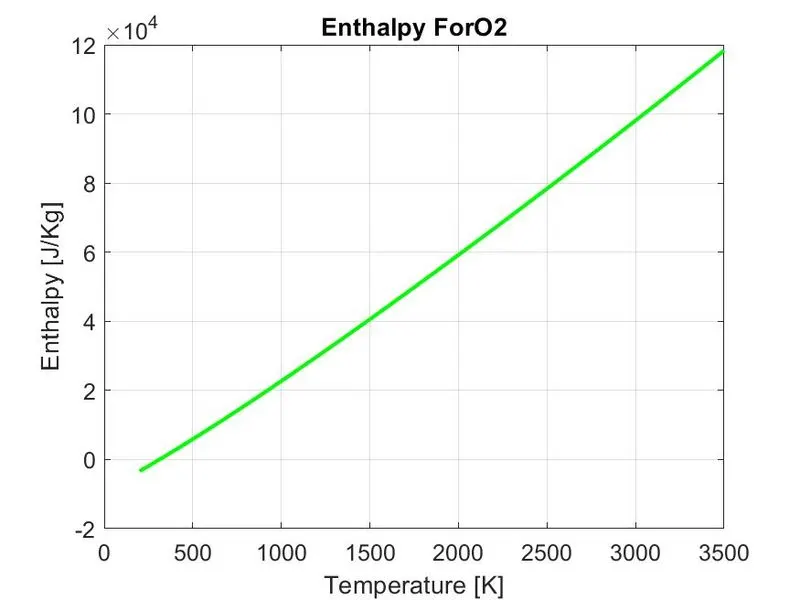
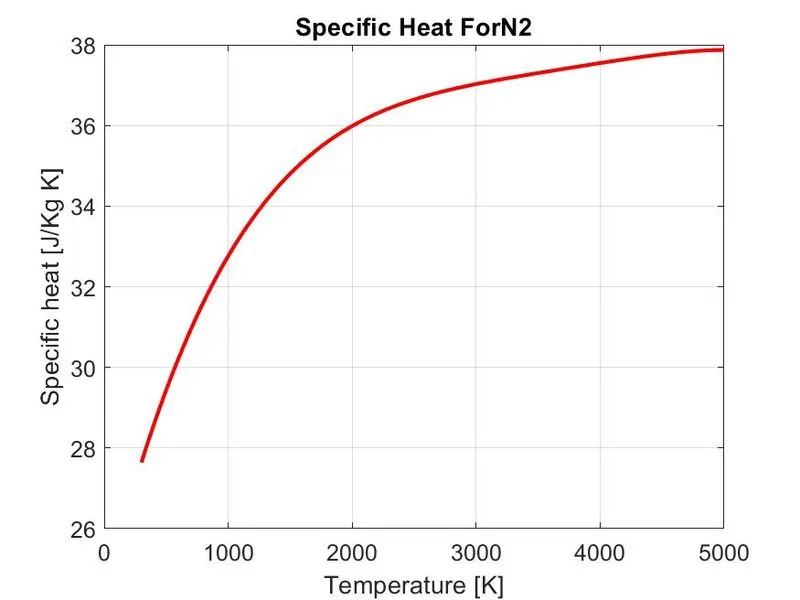
- Plot the Cp, Enthalpy and Entropy for the local temperature range (low temperature : high temperature) for each species
- Save the plots as images in separate folders for each species
- To write a detailed report to describe the logic.
INTRODUCTION:
FILE PARSING:
Parsing a file means reading in a data file of some sort and building an in memory model of the semantic content of that data. Text files include a large amount of information including text and data that need to analyze. Often, need to sort through the file and identify particular spieces of information. It can be used to describe split or separation, In general, this is called file parsing.
SPECIFIC HEAT (CP);
The quantity of the heat required to raise the temperature of the whole substance by one degree. If the mass of the substance is unity then the heat capacity is called specific heat capacity or specific heat.
ENTHALPY (H):
Enthalpy is the measurement of energy in a thermodynamic system. The quantity of enthalpy equals to the total content of heat of a system, equivalent to the system's internal energy(E) plus the product of volume and pressure(P*V).
ENTROPY (S):
Entropy,the measure of a system's thermal energy per unit temperature (ie;) unavailable for doing useful work. Because work is obtained from ordered molecular motion, the amount of entropy is also a measure of the molecular disorder, or randomness, of a system.
GOVERNING EQUATION TO EVALUATE CP, H & S:
To evaluate specific heat, enthalpy and entropy by using the derived formula,
To Evaluate from Mid temperature to high temperature,
Specific heat,Cp = (a1+a2*T+a3*T^2+a4*T^3+a5*T^4)*(R)
Enthalpy, H = (a1+a2*T/2+a3*T^2/3+a4*T^3/4+a5*T^4/5+a6/T)*(R*T)
Entropy,S = (a1*log(T)+a2*T+a3*T^2/2+a4*T^3/3+a5*T^4/4+a7)*(R)
To Evaluate from low temperature to mid temperature,
Specific heat,Cp = (a8+a9*T+a10*T^2+a11*T^3+a12*T^4)*(R)
Enthalpy,H = (a8+a9*T/2+a10*T^2/3+a11*T^3/4+a12*T^4/5+a13/T)*(R*T)
Entropy,S = (a8*log(T)+a9*T+a10*T^2/2+a11*T^3/3+a12*T^4/4+a14)*(R)
Where,
CP=specific heat
H=Enthalpy
S=Entropy
a1-a7=High temperature co_efficients
a8-a14=Low temperature co_efficients
R=universal gas constant(J/K.Mol)
T=temperature (Kelvin)
NOTATIONS USED:
l_temp=Local temperature (in Kelvin)
l1,l2 & l3=Reading co_efficient lines
S=Strings of co_efficients
STEPS INVOLVED IN CODING:
STEP 1: Preparing the thermodynamic data file to read
STEP 2: Reading the data, line by line using fgetl command
STEP 3: Assigning the for loop to skip the header lines which are not significant
STEP 4: Reading the species informations and identifying local temperature ranges.
STEP 5: Extracting the co_efficients of each species.
STEP 6: Creating a diectory to make each species plots in that particular folder
STEP 7: Creating a function to Evaluate specific heat(Cp),enthalpy(H) and entropy(S)
STEP 8: Calling a function of the determined specific heat(Cp),enthalpy(H) and entropy(S)
STEP 9: Plotting can be done for each species
STEP 10: Save the plots in the directory folder for individual species
STEP 11: Calculating the molecular weight of each individual species
STEP 12: Closing the readed file data
LOGIC EXPLANATION:
- To read the data of thermodynamic the file has been opened and read by using fopen command and the data's are stored in a variable to access file efficiently.
- Using for loop:
By, using the for loop the iterations of lines are skipped which are not significant. In the data file the first 5 lines contains header data and global temperature ranges which are not indented in this project, so, the first 5 lines are skipped
- using, [token,remain]=strtok()
The token returns the first leading variables and remain returns the remaining text, if any, in remain. If strtok finds a delimiter, then it is included at the start of remain. If strtok finds no delimiters in str, then it returns the whole of str, except for leading delimiters, in token, and remain has no characters.
- By using the strtok() the species and the local temperature ranges are been identified. Using the specified delimeter the local temperature ranges are founded out.
- Then, using the for loop the total species individual species are determined and the corresponding temperatures are identified for all species
- Also, the co_efficients are extracted from the data file using for loop.By which the co_efficients are been identified.
- From which the co_efficients a1 to a7 are considered as an High temperature co_efficients and from a8 to a14 co_efficients are considered as Low temperature co_efficients.
- Creating functions to evaluate specific heat(Cp),enthalpy(H) and entropy(S) for all species.
- Also, to estimate the molecular weight of each species function are created to evaluate molecular mass of each species.
CODING:
FUNCTION TO EVALUATE SPECIFIC HEAT (CP);
%Creating a function to evaluate specific heat
function specific_heat=eval_cp(a1,a2,a3,a4,a5,a6,a7,a8,a9,a10,a11,a12,a13,a14,T,r,t3)
  for k=1:length(T)
    if T(k)>t3 %Medium temperature t3
      %Considering  co_efficients 1 to 7 as High temperature co_efficients
      specific_heat=(a1+a2.*T+a3*T.^2+a4.*T.^3+a5.*T.^4).*r;
    else
      %Considering  co_efficients 8 to 14 as Low temperature co_efficients
      specific_heat=(a8+a9.*T+a10*T.^2+a11.*T.^3+a12.*T.^4).*r;
    end
  end
end
FUNCTION TO EVALUATE ENTHALPY (H):
%Creating a function for evaluating enthalpy
function enthalpy=eval_h(a1,a2,a3,a4,a5,a6,a7,a8,a9,a10,a11,a12,a13,a14,T,r,t3)
  for l=1:length(T)
    if T(l)>t3 %Medium temperature t3
      %Considering  co_efficients 1 to 7 as High temperature co_efficients
      enthalpy=(a1+(a2.*T)./2+(a3.*T.^2)./3+(a4.*T.^3)./4+(a5.*T.^4)./5+a6./T).*T.*r;
    else
      %Considering  co_efficients 8 to 14 as Low temperature co_efficients
      enthalpy=(a8+(a9.*T)./2+(a10.*T.^2)./3+(a11.*T.^3)./4+(a12.*T.^4)./5+a13./T).*T.*r;
    end
  end
end
FUNCTION TO EVALUATE ENTROPY (S):
%Creating a function for entropy
function entropy=eval_s(a1,a2,a3,a4,a5,a6,a7,a8,a9,a10,a11,a12,a13,a14,T,r,t3)
   for m=1:length(T)
    if T(m)>t3 %Medium temperature t3
      %Considering  co_efficients 1 to 7 as High temperature co_efficients
     entropy=(a1.*log(T)+(a2.*T)+(a3.*T.^2)./2+(a4.*T.^3)./3+(a5.*T.^4)./4+a7).*r;
    else
     %Considering  co_efficients 8 to 14 as Low temperature co_efficients
      entropy=(a8.*log(T)+(a9.*T)+(a10.*T.^2)./2+(a11.*T.^3)./3+(a12.*T.^4)./4+a14).*r;
    end
   end
end
FUNCTION TO EVALUATE MOLECULAR WEIGHT (M_W):
%Calculating molecular weight of each species
function molecular_weight=eval_mw(species)
  elements=['H','C','N','O','R','A'];  %Elements in data file
  aw=[1.00784 12.0096 14.007 15.999 40.000 39.948]; %Corresponding atomic weight
  molecular_weight=0;     %Intial value as 0
%Creating nested for loop to calculate elements with atomic weight
  for i=1:length(species)
    for j=1:length(elements)
      if strcmp(species(i),elements(j)) %Comparing each species with elements in data
        molecular_weight=molecular_weight+aw(j);
        x=j;  %Positioning the elements as x
      end
    end
    n=str2double(species(i)); %Extract number from species name
    if n>1
      molecular_weight=molecular_weight+(aw(x))*(n-1); %Calculates molecular weight with number of atoms present in individual species
    end
  end
end
MAIN CODING:
%Parsing NASA thermodynamic data
%Evaluate specific heat(cp), Enthalpy(H),Entropy(S), and Molecular weight(MW) of species
clear all
close all
clc
%Preapring a file to open
A=fopen('THERMO.dat','r'); %Stored in a variable A
%Reading the header lines
%Header line contains comments and global temperature
%using for loop to skip first 5 header lines which are insignificant
for i=1:5
  fgetl(A);
end
%Reading the species information using for loop to extract
for k=1:53 % There are totally 53 species are founded in a data file
  [species,l_temp]=strtok(fgetl(A));  %Logic used to extract species & local temperature
%Finding the local temperatures ranges
  a=strfind(l_temp,'.');  %To identify local temperature  '.' is used to seek
%Determining local temperatures
  l_low_temp=l_temp(a(1)-3:a(1)+3);
  l_high_temp=l_temp(a(2)-4:a(2)+3);
  l_mid_temp=l_temp(a(3)-4:a(3)+3);
%converting strings into numbers
   t1=str2double(l_low_temp); %low temperature
   t2=str2double(l_high_temp); %High temperature
   t3=str2double(l_mid_temp);% Medium temperature

%Determining the co_efficients of individual species
   l1=fgetl(A);  %Reading the 7 th line
   l2=fgetl(A);  %Reading the 8 th line
   l3=fgetl(A);  %Reading the 9 th line
%Finding the common position  of variable E
   a=strfind(l1,'E'); %Stored in a variable a

%Finding the string of co_efficients then, converted into string to number
%Determining co_efficients of a1
  s1=l1(1:a(1)+3);
  a1=str2double(s1);
%Determining co_efficients of a2
  s2=l1(a(1)+4:a(2)+3);
  a2=str2double(s2);
%Determining co_efficients of a3
  s3=l1(a(2)+4:a(3)+3);
  a3=str2double(s3);
%Determining co_efficients of a4
  s4=l1(a(3)+4:a(4)+3);
  a4=str2double(s4);
%Determining co_efficients of a5
  s5=l1(a(4)+4:a(5)+3);
  a5=str2double(s5);
%Determining the co_efficients from line 2
   a=strfind(l2,'E');
%Determining co_efficients of a6
  s6=l2(1:a(1)+3);
  a6=str2double(s6);
%Determining co_efficients of a7
  s7=l2(a(1)+4:a(2)+3);
  a7=str2double(s7); %dtermined co_efficients of a7
%Determining co_efficients of a8
  s8=l2(a(2)+4:a(3)+3);
  a8=str2double(s8); %dtermined co_efficients of a8
%Determining co_efficients of a9
  s9=l2(a(3)+4:a(4)+3);
  a9=str2double(s9);  %dtermined co_efficients of a9
%Determining co_efficients of a10
  s10=l2(a(4)+4:a(5)+3);
  a10=str2double(s10);  %dtermined co_efficients of a10
%Determining the co_efficients from line 3
   a=strfind(l3,'E');
%Determining co_efficients of a11
  s11=l3(1:a(1)+3);
  a11=str2double(s11);
%Determining co_efficients of a12
  s12=l3(a(1)+4:a(2)+3);
  a12=str2double(s12);
%Determining co_efficients of a13
  s13=l3(a(2)+4:a(3)+3);
  a13=str2double(s13);
%Determining co_efficients of a14
  s14=l3(a(3)+4:a(4)+3);
  a14=str2double(s14);

%Creating local temperature intervels
  T=linspace(t1,t2,500); %creating temperature intervels of Low:High ranges with 500 intervels
  r=8.314; %universal gas constant
%Calling a function for specific heat
  specific_heat=eval_cp(a1,a2,a3,a4,a5,a6,a7,a8,a9,a10,a11,a12,a13,a14,T,r,t3);
%Calling a function for enthalpy
   enthalpy=eval_h(a1,a2,a3,a4,a5,a6,a7,a8,a9,a10,a11,a12,a13,a14,T,r,t3);
%Calling a function for entropy
   entropy=eval_s(a1,a2,a3,a4,a5,a6,a7,a8,a9,a10,a11,a12,a13,a14,T,r,t3);

%Creating a directory to all individual species
  mkdir(['species\ Plot for', species]);

%Plotting
%Temperature vs Specific heat
figure(1)   %Create separate window for figure 1
plot(T,specific_heat,'linewidth',2,'color','r');
title(['Specific Heat For', species]); %creating a tittle
xlabel('Temperature [K]');             %X labelling
ylabel('Specific heat [J/Kg K]');      %Y labelling
set(gca,'fontsize',12)                 %axis fonts modification
grid on

%Temperature vs Enthalpy
figure(2)   % Create spearate windoe for figure 2
plot(T,enthalpy,'linewidth',2,'color','g');
title(['Enthalpy For', species]);     %Creating a tittle
xlabel('Temperature [K]');            %X labelling
ylabel('Enthalpy [J/Kg]');            %Y labelling
set(gca,'fontsize',12)                %axis fonts modification
grid on

%Temperature vs Entropy
figure(3)  %Creates separate window for figure 3
plot(T,entropy,'linewidth',2,'color','y');
title(['Entropy For', species]);     %Create a tittle
xlabel('Temperature [K]');           %X labelling
ylabel('Entropy [J/K]');             %Y labelling
set(gca,'fontsize',12)               %axis fonts modification
grid on

%Creating a directory path
directory=(['C:\Users\VENKATESH\Desktop\file_parsing_NASA\species\ Plot for', species]);
cd(directory);   % Current folder of a directory

%Saving the plots in directory
saveas(1,'specific_heat.jpg');
saveas(2,'entropy.jpg');
saveas(3,'enthalpy.jpg');
cd('C:\Users\VENKATESH\Desktop\file_parsing_NASA');

%Evaluating molecular Weight

molecular_weight=eval_mw(species);
M_W=sprintf('Molecular_weight of %s=%f',species,molecular_weight);
disp(M_W) %Printing the molecular weight of each species in command window
end
fclose(A);
CODING EXPLANATION:
- The THERMO.dat file are opened using fopen command and assigned in a variable A to access the file effictively.
- Using fgetl(A) command to read line by line in the data file
- In the data file, the first five lines contains information regarding setup data and global temperatures
- The global temperature ranges are not taken into account as insisted. Local temperature ranges for each species are only taken into account.
- The data file contains toally 218 lines in which 6 line are insignificant(first five lines and @ end)
- The remaining lines contains informations of polynomials of species and their respective co_efficients
- From the range[6:4:eof] inbetween every range of intervel it contains species names and local temperature range.
- The each poynomial species contains 14 co_efficients. In which the co_efficients 1 to 7 are considered as an High temperature co_efficients and from 8 to 14 co_efficients are considered as Low temperature co_efficients.
- The co_efficients of each species and local temperature ranges are identified using the logic as below,
- Using the logic [species,l_temp]=strtok(fgetl(A)) to identify the individual species and local temperature ranges.
- The species returns the first leading variables and by using the idenfied delimeter ('.') the local low,midium and high temperatures are founded as t1,t2 & t3 respectively.
- The determined local temperature are converted from strings to numbrers using str2double command.
- By using the temperatures ranges temperature limits from high:low are determined by using linspace command and stored in variable T.
- Then, from individual species the corresponding co_efficients are extracted using for loop. There are totally 53 species are founded in which each as 14 co_efficients
- All the co_efficients are extracted using for loop
- The co_efficients are founded using the common letter 'E' from which the values of co_efficients are determined.
- Creating the functions to Evaluate specific heat(Cp),enthalpy(H) and entropy(S) for all species.
- By the derived formula functions are created.
- In the functions if condition is used to assign the medium temperature to high temperature range and low to medium temperature ranges.
- If loop evaluates if temperature range is more than mid temperature means it evaluates high temperature co_efficients or else it evaluates low temperature co_efficients
- By, calling a function the specific heat(Cp),enthalpy(H) and entropy(S) for all species are determined.
- Then, Creating a directory using mkdir command to create a folder to save the each species plots
- By, using mkdir command to create folders in remote locations. To write to a remote location, folder name must contain the full path of the file specified as a uniform resource locator (URL).
- cd displays the current folder directory and changes from current folder to new folder.
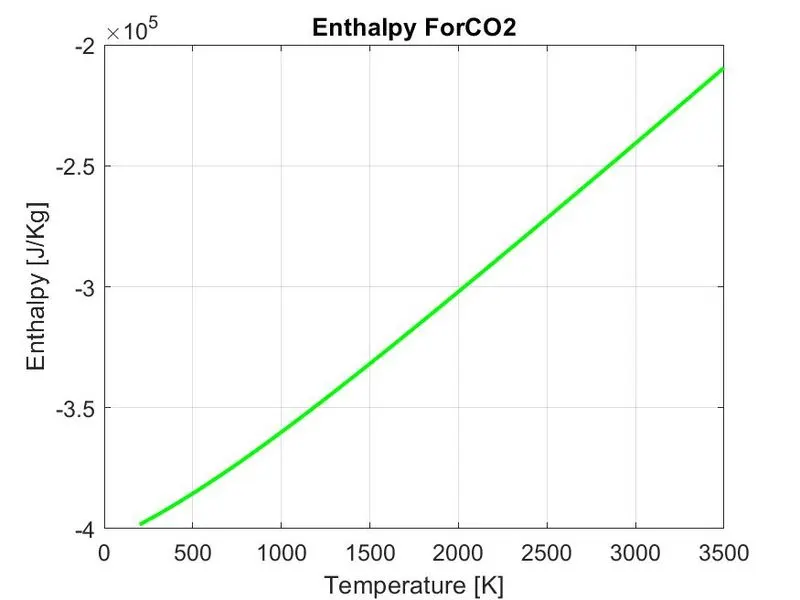
- The plotting has been done using the evaluated temperature and all species thermodynamic property values.
- Separate figures are created to plot cp,h,s for all individual species.
- The plots for each species are saved using saveas command.
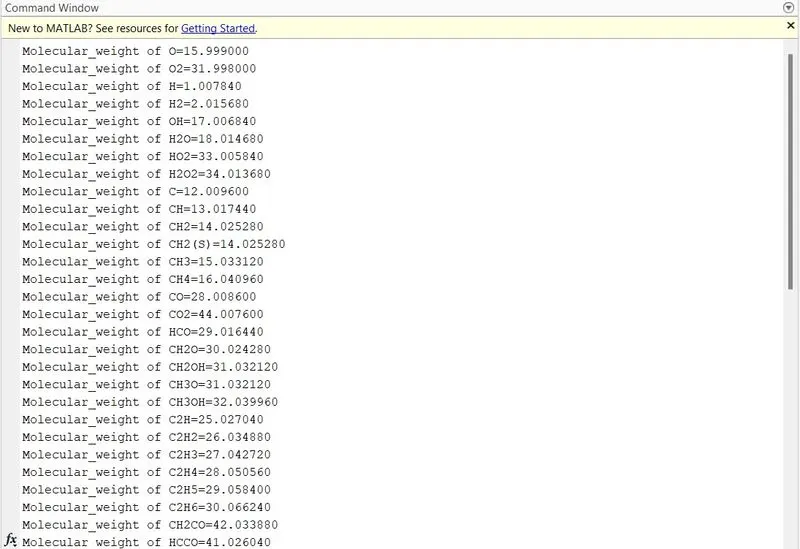
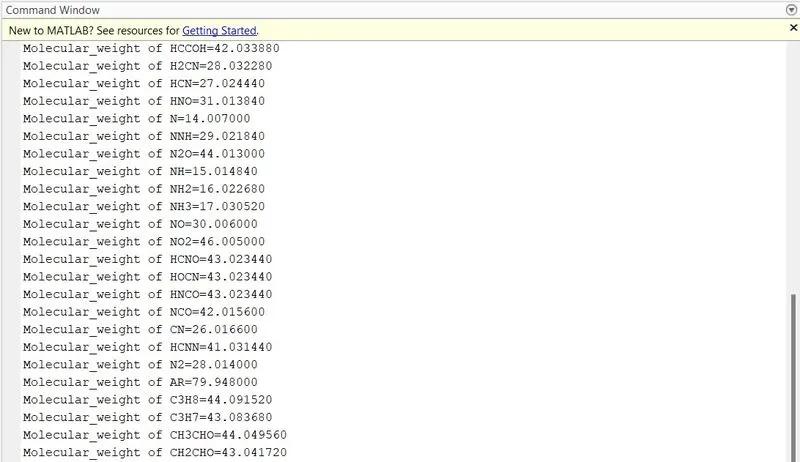
- Molecular weight for each species are founded by calling a function which was created to evaluate molecular weight.
- The function for molecular weight take species as an input and molecular weight as an output.
- For all species which contains elements the atomic weights are defined.
- Nested for loop is created and the species and elements of species are extracted.
- Using strcmp command the species and elements are compared
- If species and elements are mathes the atomic weight of the species is calculated
- By using sprintf command to execute molecular weight are been displayed in the command window.
SCREENSHOT OF SPECIES FOLDER:

PLOTTINGS FOR SPECIES:
PLOT FOR O2 SPECIES:
PLOT FOR N2 SPECIES:
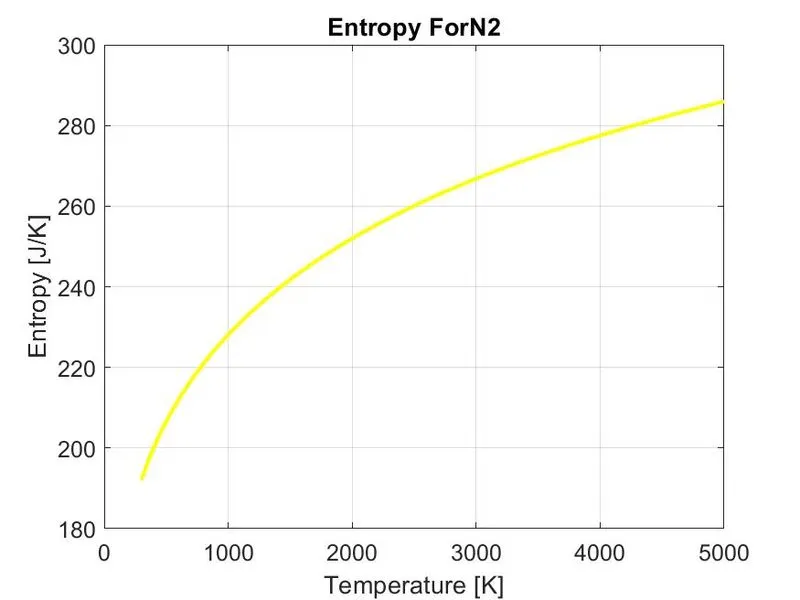
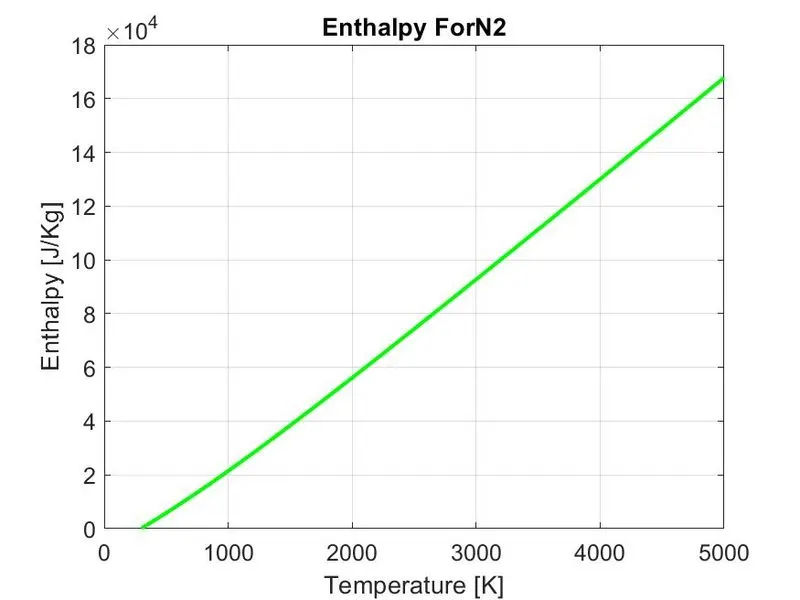
PLOT FOR CO2 SPECIES:
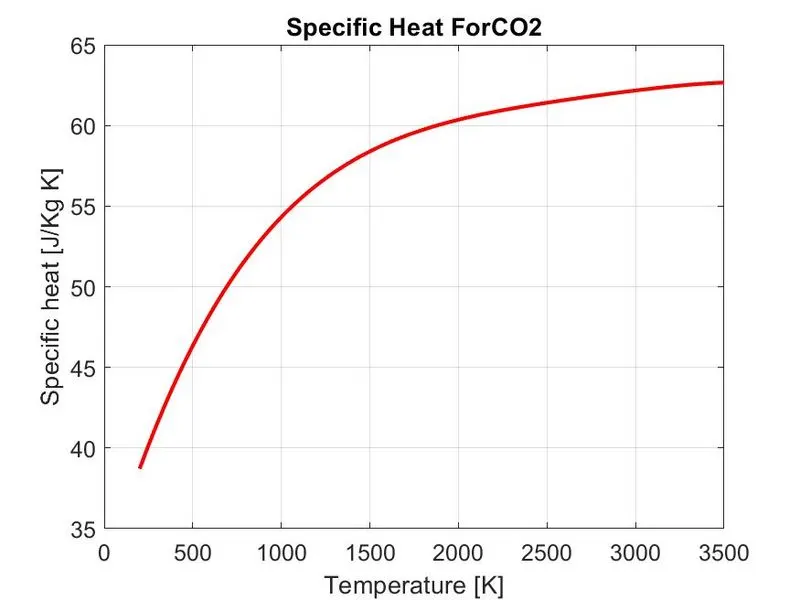
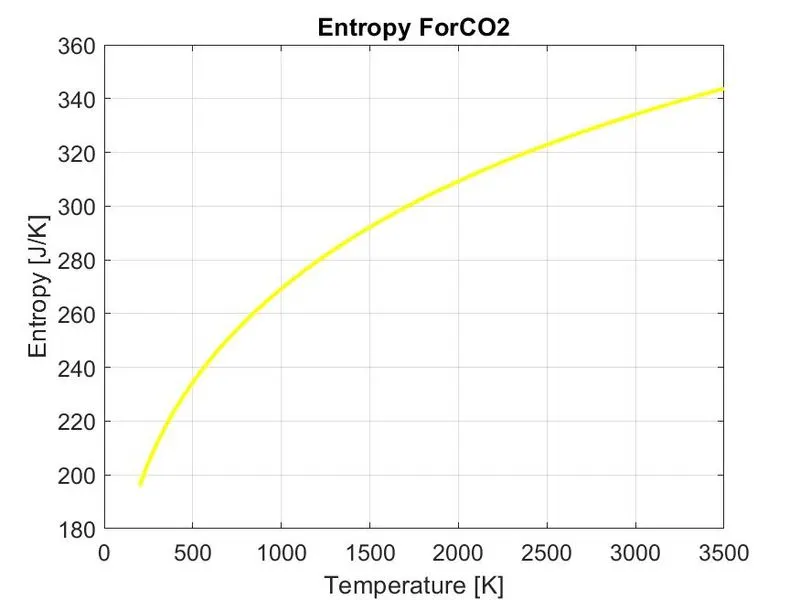
MOLECULAR WEIGHT OF SPECIES:
ERRORS FACED WHILE PROGRAMMING:
- While plotting of X and y data temperature and specified data's are taken. In which plotting the specified colos are not mentioned as 'color'.
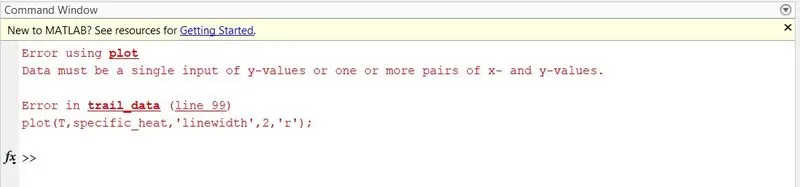
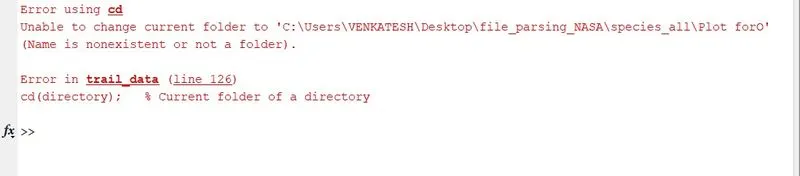
- Directory error founded. In making a new directory the folder name are provided and also the name of directory are differently assigned.
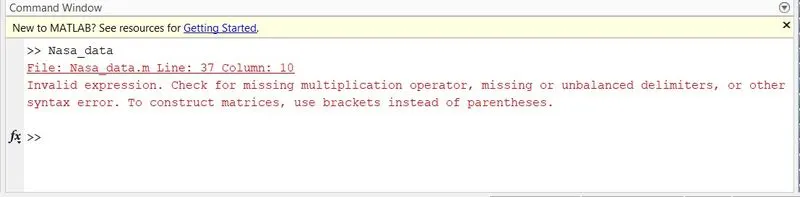
- During extracting the strings in the species the proper assignments are not assigned
STEPS TO OVERCOME THOSE ERRORS:
- In the plot the proper assignments are indednted in order to overcome error. 'Color' are provided separetely in the plotting.
- The directory name and folder path name are properly assigned.
- The expression for strings ranges are assigned properly.
CONCLUSION:
- The function that extracts the 14 co-efficients and determination of the enthalpy, entropy and specific heats for all the species in the data file are founded using matlab
- The molecular weight of each species ate displayed in the command window
- Plot the Cp, Enthalpy and Entropy for the local temperature range (low temperature : high temperature) for each species are been plotted and individual folders are created to dump the plots.
- A detailed report of logics are explained
- Thus, by using matlab the thermodynamic data of NASA are parsed and executed.
REFERENCE: