Project 1 - Parsing NASA thermodynamic data
Aim – Write a function that extracts the 14 co-efficient and calculates the enthalpy, entropy and specific heats for all the species given in data file.
- Calculate the molecular weight of each species and display it in the command window.
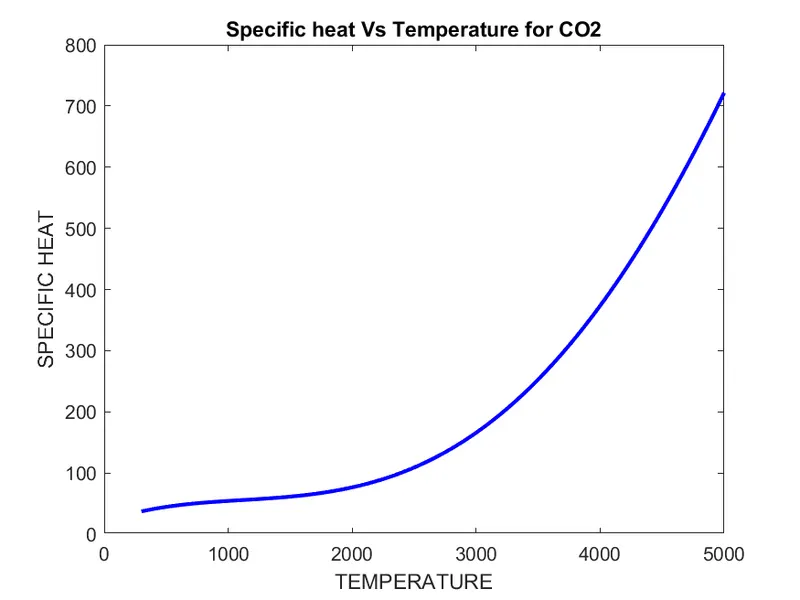
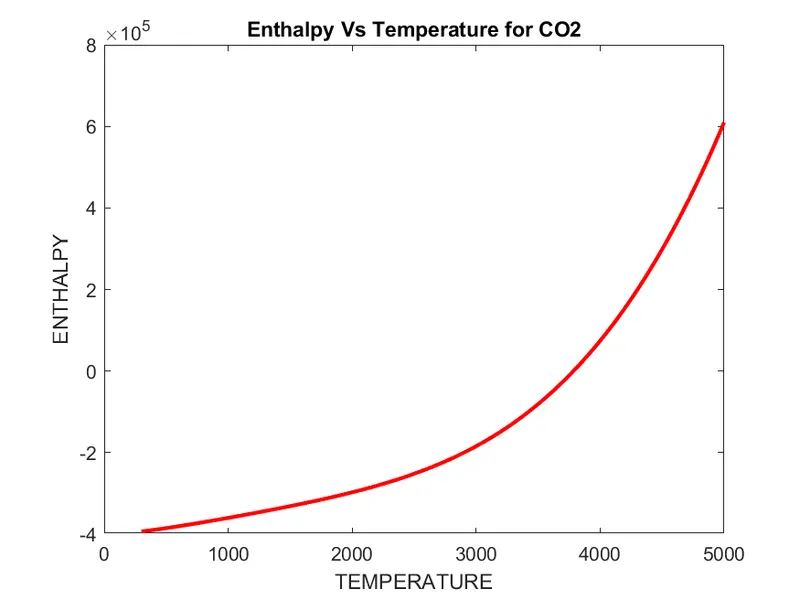
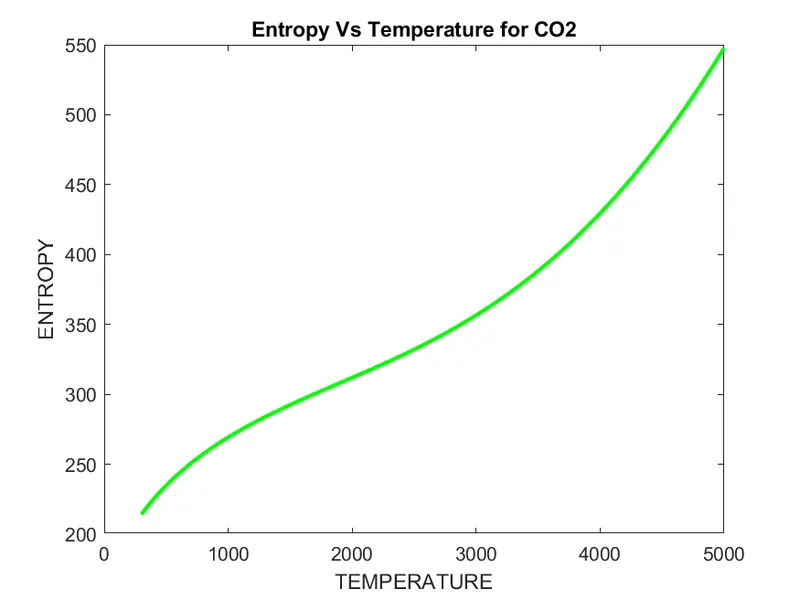
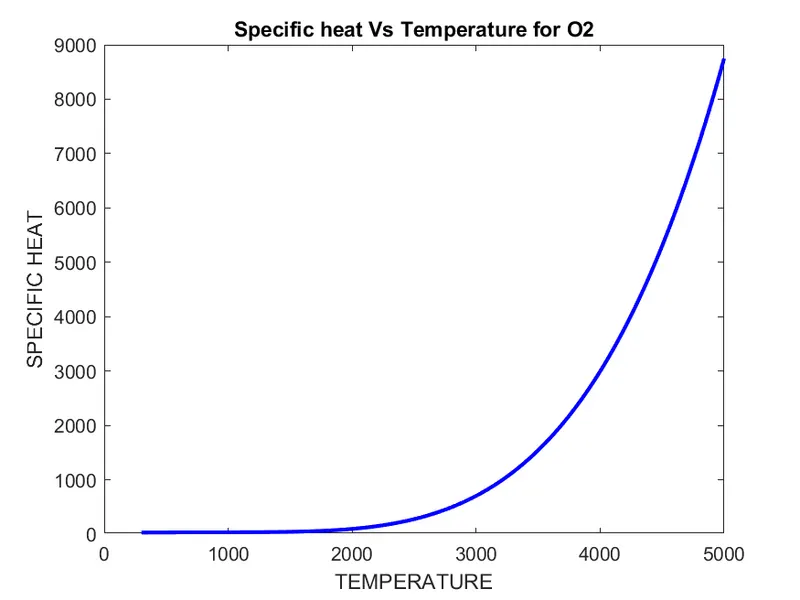
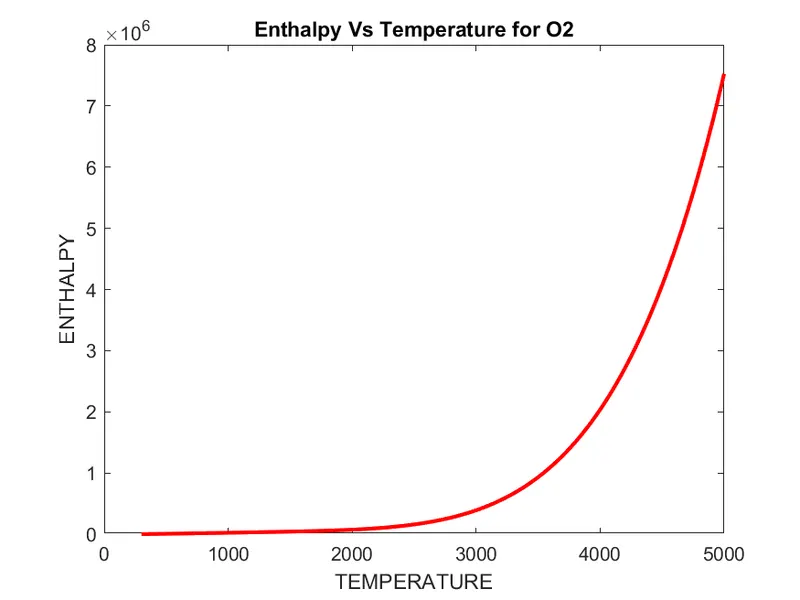
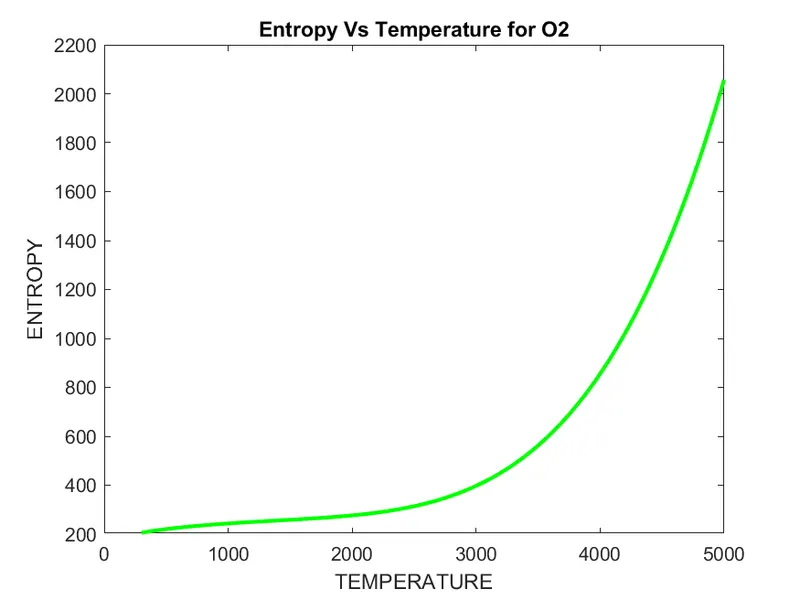
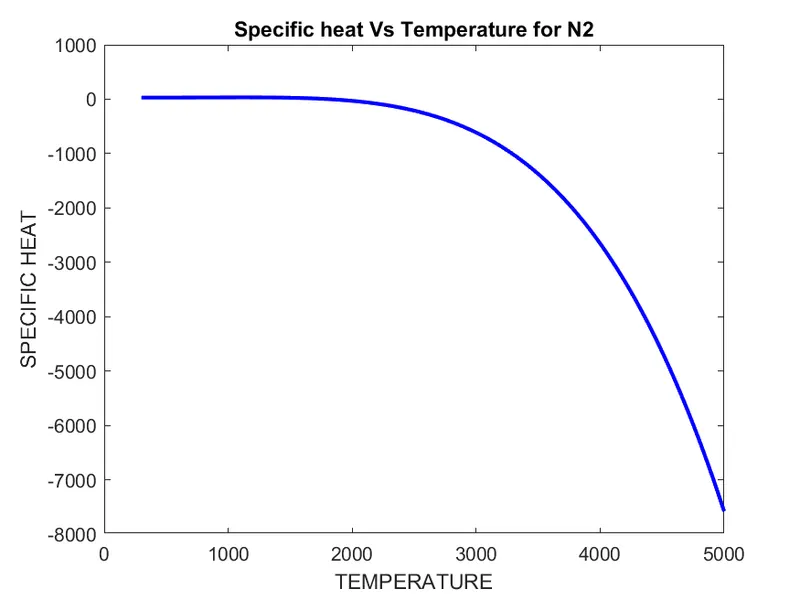
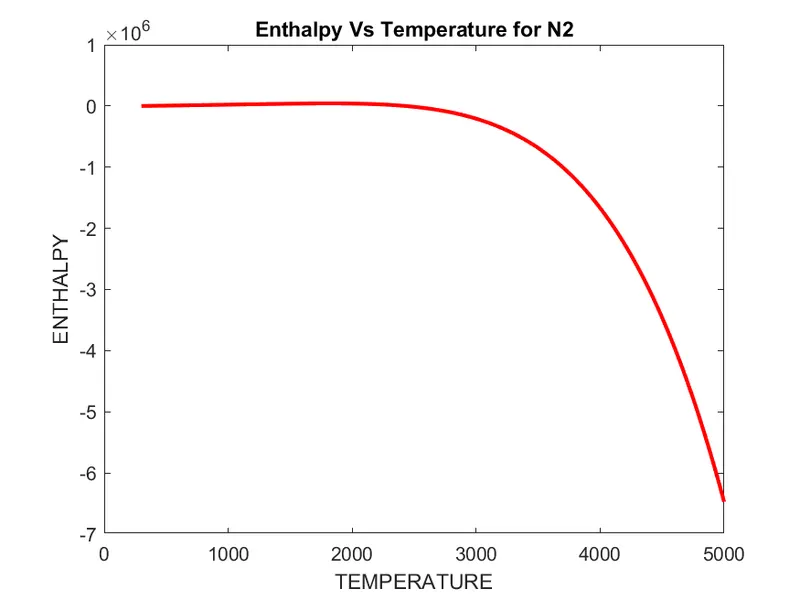
- Plot the Cp, Enthalpy and Entropy for the local temperature range (low temperature : high temperature) specific for each species.
Theory –
File parsing is a process to analyze string of words into its constitutions. the purpose of file parsing is to transform data into a useful data, which is easy to store and manipulate.
In this project we are going to parse NASA’ thermodynamic data which has coefficient of the polynomial to calculate specific heat, entropy, enthalpy. There are 14 polynomial coefficient for the each 53 species. these polynomial will be used in below written formula for global temperature and local temperature as well.
Formulas, we are going to use in program, are –
`C_p`/R = a1+a2 T + a3 T^2 +a4 T^3 +a5 T^4`
H/RT = a1 + a2 T / 2 + a3 T^2 / 3 + a4 T^3 /4 + a5 T^4 /5 + a6/T
S/R = a1 InT + a2 T + a3 T^2 / 2 + a4 T^3 /3 + a5 T^4 / 4 +a7
R = Universal gas constant (J/mol.K)
T = Temperature (K)
Cp = Specific heat (J/Kg.K)
H = Enthalpy (J)
S = Entropy (J/K)
Steps for choosing the logic of code and file parsing -
1: - We open the file and parse the file ,'fopen' is used to open a file.
2: - To navigate throughout the file and using 'fgetl' command to get the line of the file and read the file line by line to get to the desired result.
3: - Reading the text from the header file and read the file line by line
4: - String split command is used 'strsplit' then cell array is generated. A cell array is a special data structure to store data of the different type and perform the desired task ,'str2num' command is used to convert number.
5:- Now read the next three linw by 'fgetl' . we don't need it because it is genenal information of data.
6:- Assing the value for R gas constant.
7:- Define the temperature range by using 'linspace' command.
8:-Start a for loop which will run from 1:53 times . there are 53 element in data.
9:- Then 'strfind' command is used, we will get index of E.
10:- From (a1 - a7) are High temperature coefficient and (b1-b7) are low temperature coefficient.
11: - The function for Cp, H, S is created to calculate them by taking the values from the file data
12: - Molecular weight is calculated using the molecular weight function and is printed on the command window
13: - The plots for Cp, H, S are created for each species and saved in a folder in jpg format to access the species with different images
14: - Creating folders for different molecules and save the plots for specific heat, enthalpy, and entropy in that folder and display the molecular weight of different species in the command window.
MAIN CODE
clear all
close all
clc


 f1 = fopen('THERMO (1).dat','r')
get_1 = fgetl(f1);
%calling for temperature
temp = fgetl(f1);
%spliting the string
string_spit = strsplit(temp);
%converinting cell array to number
templow = str2num(string_spit{2});
tempmid = str2num(string_spit{3});
temphigh =str2num(string_spit{4});

T = linspace(templow,temphigh,1000);
R = 8.314; %Gas ocnstant

%To skip the lines
for i =1:3
    get_1 = fgetl(f1);
end

%Reading the specise
for j =1:53
tline = fgetl(f1);
 M = strsplit(tline,' ');
    species = M{1};
%extracting the coefficient from first line
line2 = fgetl(f1);
line3 = fgetl(f1);
line4 = fgetl(f1);

A = findstr(line2,'E');
B = findstr(line3,'E');
C = findstr(line4,'E');

%Extracting higher temperature coeffs
a1 = str2num(line2(1:A(1)+3));
a2 = str2num(line2(A(1)+4:A(2)+3));
a3 = str2num(line2(A(2)+4:A(3)+3));
a4 = str2num(line2(A(3)+4:A(4)+3));
a5 = str2num(line2(A(4)+4:A(5)+3));
a6 = str2num(line3(1:B(1)+3));
a7 = str2num(line3(B(1)+4:B(2)+3));

% Extracting lower temperature coeffs
b1 = str2num(line3(B(2)+4:B(3)+3));
b2 = str2num(line3(B(3)+4:B(4)+3));
b3 = str2num(line3(B(4)+4:B(5)+3));
b4 = str2num(line4(1:C(1)+3));
b5 = str2num(line4(C(1)+4:C(2)+3));
b6 = str2num(line4(C(2)+4:C(3)+3));
b7 = str2num(line4(C(3)+4:C(4)+3));

%Specific heat calculation
cp = specificheat(a1,a2,a3,a4,a5,b1,b2,b3,b4,b5,T,R,tempmid)

%Enthalpy calculation
h = enthalpy(a1,a2,a3,a4,a5,a6,b1,b2,b3,b4,b5,b6,T,R,tempmid)

%Entropy calculation
s = entropy_calc(a1,a2,a3,a4,a5,a7,b1,b2,b3,b4,b5,b7,T,R,tempmid)

%Calculating molecular weight of species
MW = molecular_weight(species)

%writing molecular weight of the species
MW_1 = fopen('name.txt','W')
fprintf(MW_1,'Molecular weigth of %s is %d',species,MW)
fclose(MW_1);

%Creating individual folder for each species and plotting
plotting(cp,h,s,T,species)

MW = molecular_weight(species)

end
sub codes use for main program-
molecular weight:-
%Function to calculate molecular weight
function MW = molecular_weight(species)
atoms = ['H','C','O','N','A'];

    atomic_weight = [1 12 16 14 40];
    MW = 0;
    for i = 1:length(species)
        for j = 1:length(atoms)
            if strcmp(species(i),atoms(j))
                MW = MW +atomic_weight(j);
                position = j;
            end
        end
        n = str2num(species);
        if n>1
            MW = MW + atomic_weight(position)*(n-1);
        end
    end
    fprintf('Molecular Weight of %s:- ',species);

    fprintf('%f',MW);
    disp(' ')
    end
Explanation of code –
- Create a function with name molecular_weight and pass ‘species’ as an argument.
- Define a column array with name atom which has various atoms.
- Now define a row array which has atomic weight of atoms.
- Now apply a nested for loop. First loop will run from 1 to length of species and second will run from 1 to length of atom(column vector, earlier defined)
- Apply a if statement and apply strcmp command to compare elements of ‘species’ and ‘atoms’.
Assign value to ‘MW’ which was 0. - End the if statement and use str2num command to convert string elements into numeric element and store it into a variable ’n’.
- Apply a if statement which will calculate value of MW.
- End the function and for loop with end command.
Entropy: -
Entropy is a scientific concept, as well as a measurable physical property that is most commonly associated with a state of disorder, randomness, or uncertainty.
%Calculation of entropy
function s = entropy_calc(a1,a2,a3,a4,a5,a7,b1,b2,b3,b4,b5,b7,T,R,tempmid)
if T<=tempmid
    s =  R*(a1.*log(T)+(a2*T)+(a3*(T).^2)/2+(a4*(T).^3)/3+(a5*(T).^4)/4+a7);
else
    s = R*(b1.*log(T)+b2*T+(b3*(T).^2)/2+(b4*(T).^3)/3+(b5*(T).^4)/4+b7);
end
- Create a function with name entropy_calc and pass ‘(a1,a2,a3,a4,a5,a7,b1,b2,b3,b4,b5,b7,T,R,tempmid)
’ as an argument - %The FIRST 7 coefficients are HIGH-temperature coefficients and the SECOND 7 coefficients are LOW-temperature coefficients - comments
- if(T<=tempmid) - comparing matrix values of the temperature generated from the linspace command with the global medium temperature
- s = R*(a1.*log(T)+(a2*T)+(a3*(T).^2)/2+(a4*(T).^3)/3+(a5*(T).^4)/4+a7);; - calculation of the entropy wrt to the equations
- else - else statement to perform the task if the if statements fail
- s = R*(b1.*log(T)+b2*T+(b3*(T).^2)/2+(b4*(T).^3)/3+(b5*(T).^4)/4+b7);- calculation of the entropy wrt to the equations
- end - to end or terminate the function.
Enthalpy: -
is a property of a thermodynamic system, defined as the sum of the system's internal energy and the product of its pressure and volume.It is a convenient state function standardly used in many measurements in chemical, biological, and physical systems at a constant pressure.
%Calculation of enthalpy
function h = enthalpy(a1,a2,a3,a4,a5,a6,b1,b2,b3,b4,b5,b6,T,R,tempmid)
if T > tempmid
    h = R.*(a1.*T+(a2.*T.^2)./2+(a3.*T.^3)./3+(a4.*T.^4)./4+(a5.*T.^5)./5+a6);
else
    h = R.*(b1.*T+(b2.*T.^2)./2+(b3.*T.^3)./3+(b4.*T.^4)./4+(b5.*T.^5)./5+b6);

end
- Create a function with name enthalpy and pass ‘(a1,a2,a3,a4,a5,a6,b1,b2,b3,b4,b5,b6,T,R,tempmid)
’ as an argument - %The FIRST 7 coefficients are HIGH-temperature coefficients and the SECOND 7 coefficients are LOW-temperature coefficients - comments
- if(T>tempmid) - comparing matrix values of the temperature generated from the linspace command with the global medium temperature
- h = R.*(a1.*T+(a2.*T.^2)./2+(a3.*T.^3)./3+(a4.*T.^4)./4+(a5.*T.^5)./5+a6); - calculation of the entropy wrt to the equations
- else - else statement to perform the task if the if statements fail
- h = R.*(b1.*T+(b2.*T.^2)./2+(b3.*T.^3)./3+(b4.*T.^4)./4+(b5.*T.^5)./5+b6)- calculation of the entropy wrt to the equations
- end - to end or terminate the function.
Specific Heat(Cp): -
In thermodynamics, the specific heat capacity (Cp) of a substance is the heat capacity of a sample of the substance divided by the mass of the sample.
%Calculation of specific heat
function cp = specificheat(a1,a2,a3,a4,a5,b1,b2,b3,b4,b5,T,R,tempmid)
% Comparing with global temp
% If less than global it will take min coeffs
if T > tempmid
    cp = R.*(a1+a2.*T+a3.*T.^2+a4.*T.^3+a5.*T.^4);
%If temp is more it will take max coeffs
else
    cp = R.*(b1+b2.*T+b3.*T.^2+b4.*T.^3+b5.*T.^4);
end
- Create a function with name specifichead and pass ‘(a1,a2,a3,a4,a5,,b1,b2,b3,b4,b5,,T,R,tempmid)
’ as an argument - %The FIRST 7 coefficients are HIGH-temperature coefficients and the SECOND 7 coefficients are LOW-temperature coefficients - comments
- if(T>tempmid) - comparing matrix values of the temperature generated from the linspace command with the global medium temperature
- cp = R.*(a1+a2.*T+a3.*T.^2+a4.*T.^3+a5.*T.^4);- calculation of the entropy wrt to the equations
- else - else statement to perform the task if the if statements fail
- cp = R.*(b1+b2.*T+b3.*T.^2+b4.*T.^3+b5.*T.^4);- calculation of the entropy wrt to the equations
- end - to end or terminate the function.
for plot of graph between cp, h , s , T , species
%Create plotting function
function plotting(cp,h,s,T,species)
mkdir('C:\Users\MAHENDRA MAYWDE\OneDrive\Desktop\tempo program',species)
cd(species)
figure(1)
plot(T,cp,'linewidth',2,'color','b')
title(sprintf('Specific heat Vs Temperature for %s',species))
xlabel('TEMPERATURE')
ylabel('SPECIFIC HEAT')

figure(2)
plot(T,h,'linewidth',2,'color','r')
title(sprintf('Enthalpy Vs Temperature for %s',species))
xlabel('TEMPERATURE')
ylabel('ENTHALPY')

figure(3)
plot(T,s,'linewidth',2,'color','g')
title(sprintf('Entropy Vs Temperature for %s',species))
xlabel('TEMPERATURE')
ylabel('ENTROPY')


    saveas(1,'cp_vs_t.png')
    saveas(2,'h_vs_t.png')
    saveas(3,'s_vs_t.png')
  cd('C:\Users\MAHENDRA MAYWDE\OneDrive\Desktop\tempo program')
end
result: showing for folder of species

plot of O2
plot for N2
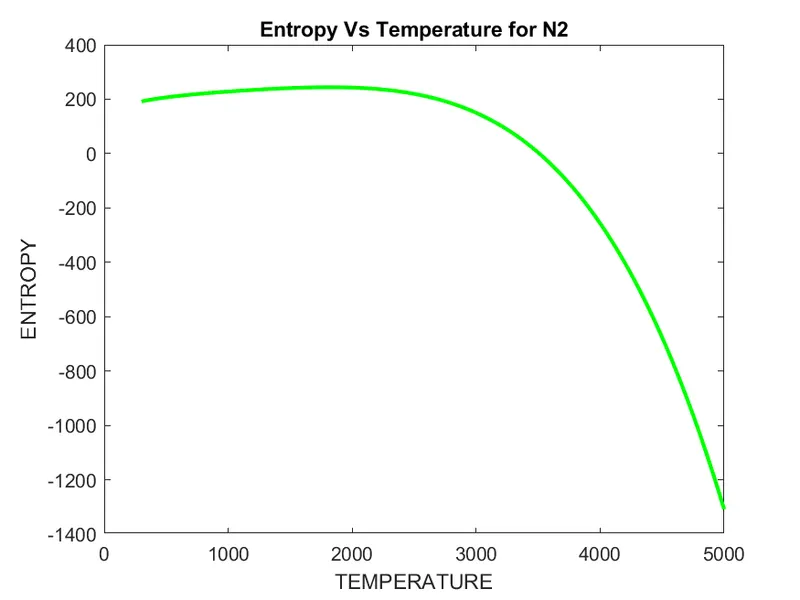
plot for CO2