Project 1 - Parsing NASA thermodynamic data
1. AIM: -
To write a code in MATLAB to parse the NASA thermodynamic data file and calculate thermodynamic properties of various gas species.
2. OBJECTIVE: -
- Write a function that extracts the 14 co-efficient and calculates the enthalpy, entropy and specific heats for all the species in the data file. You will be reading this file NASA thermodynamic data
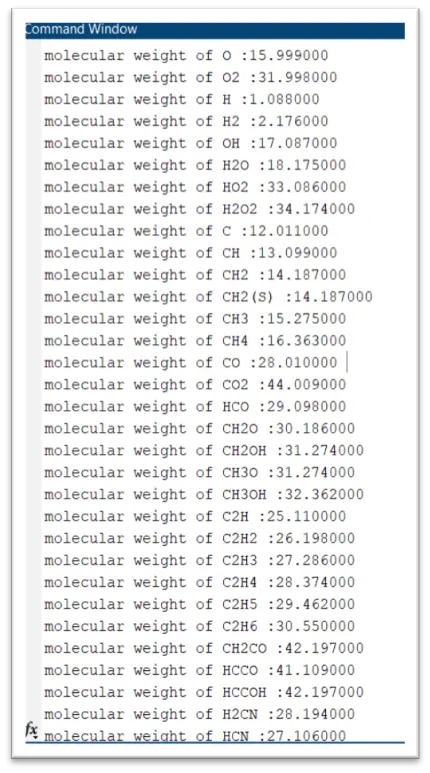
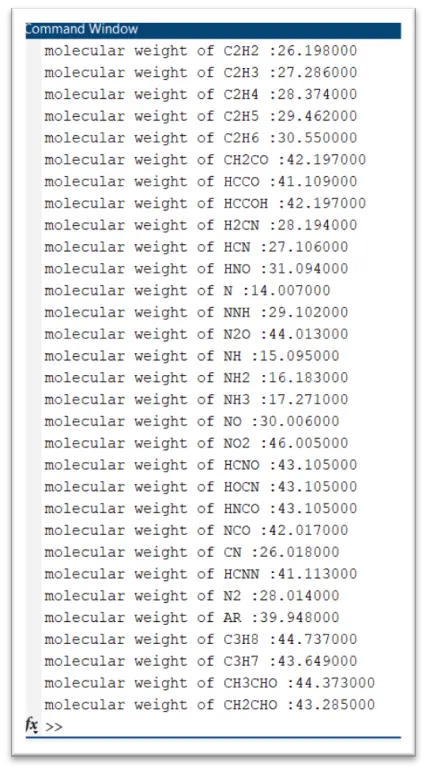
- Calculate the molecular weight of each species and display it in the command window.
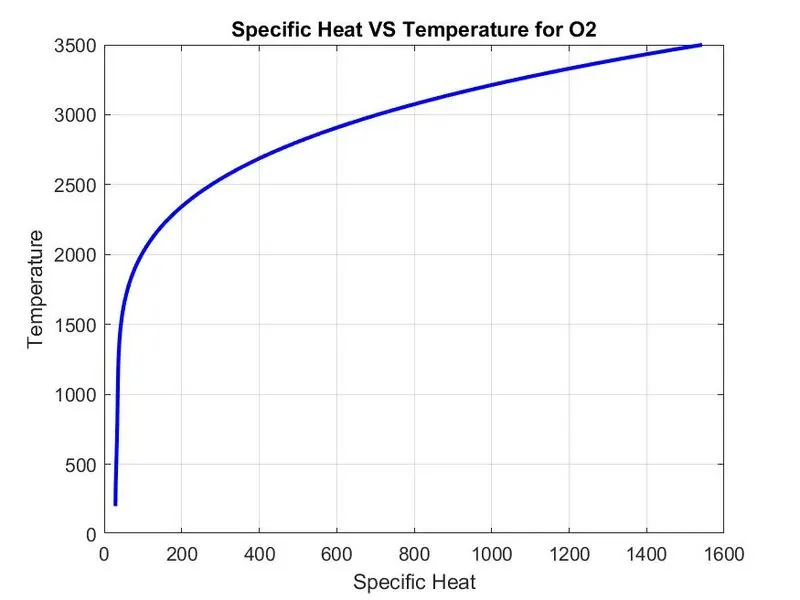
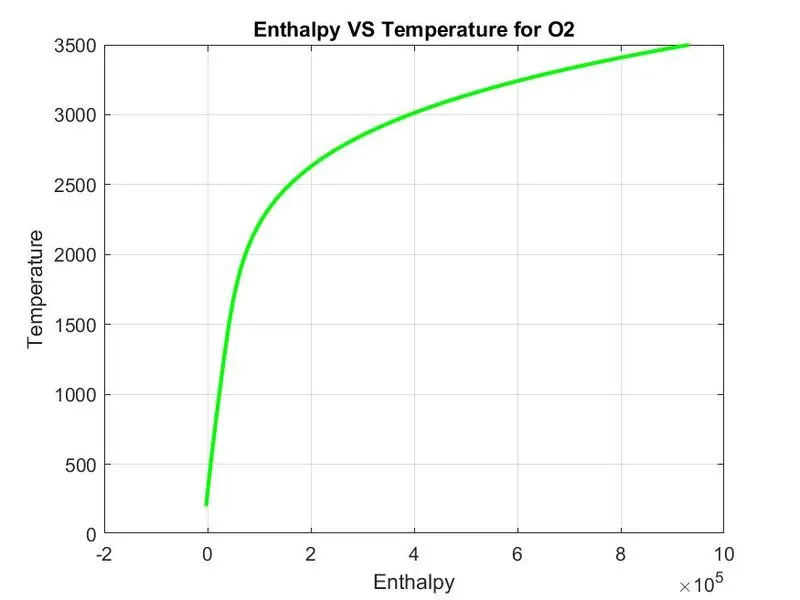
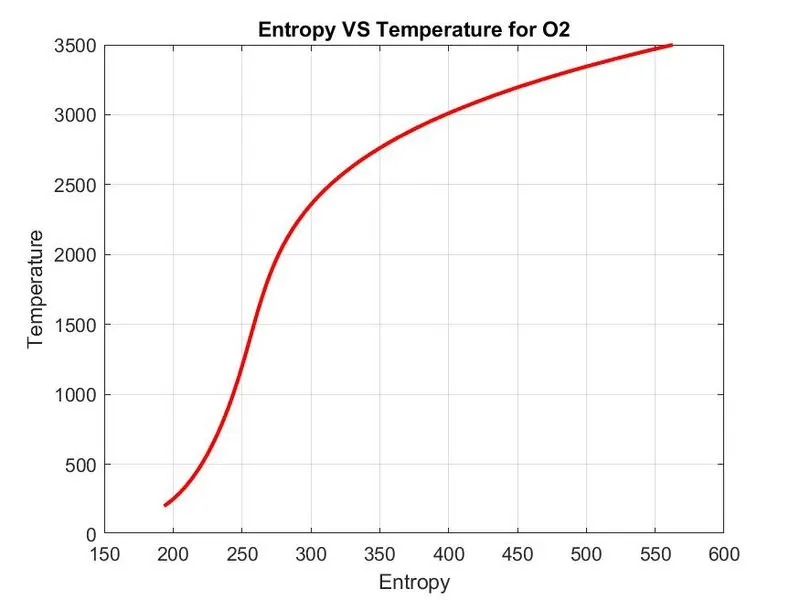
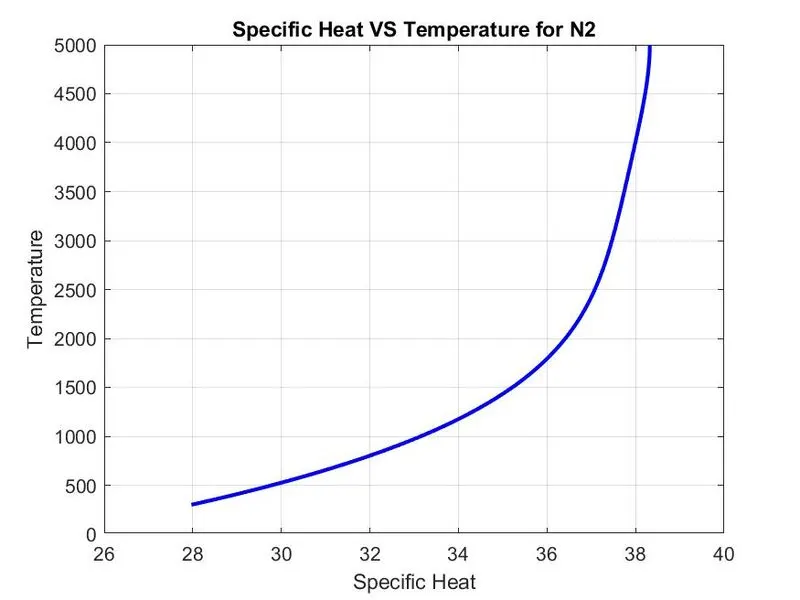
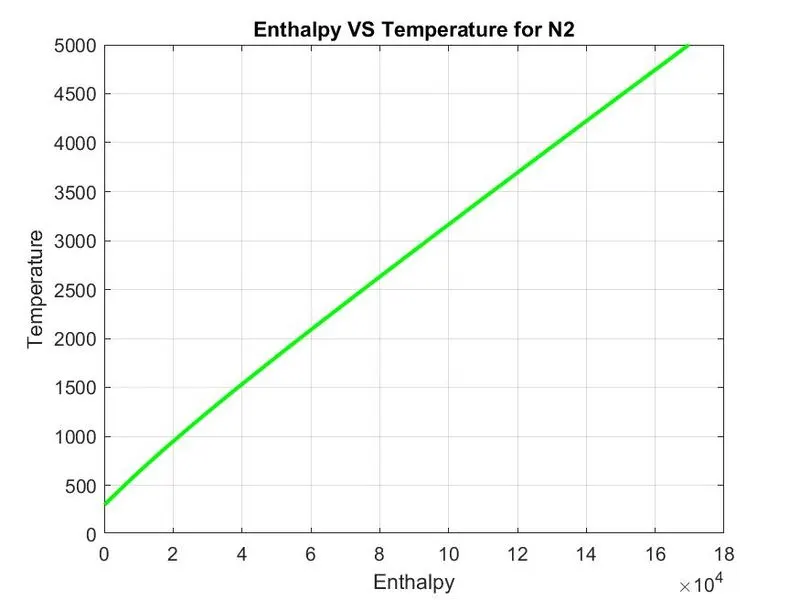
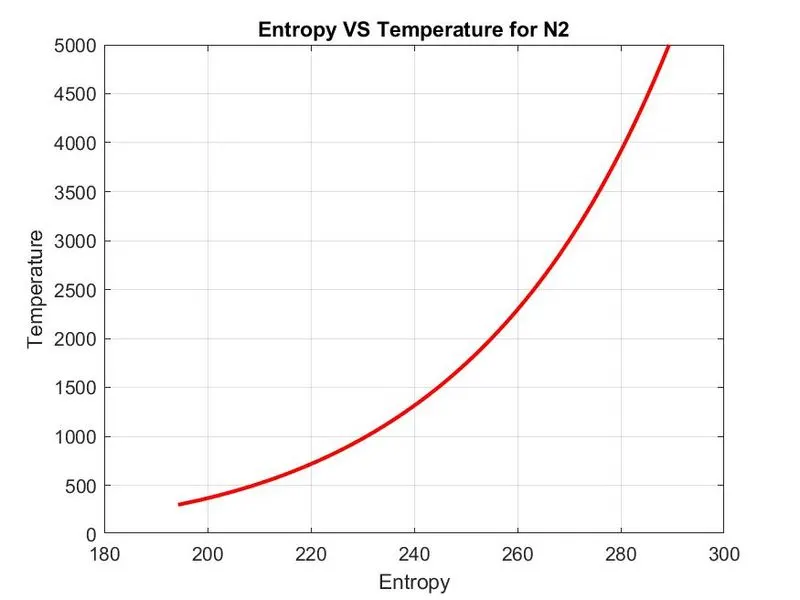
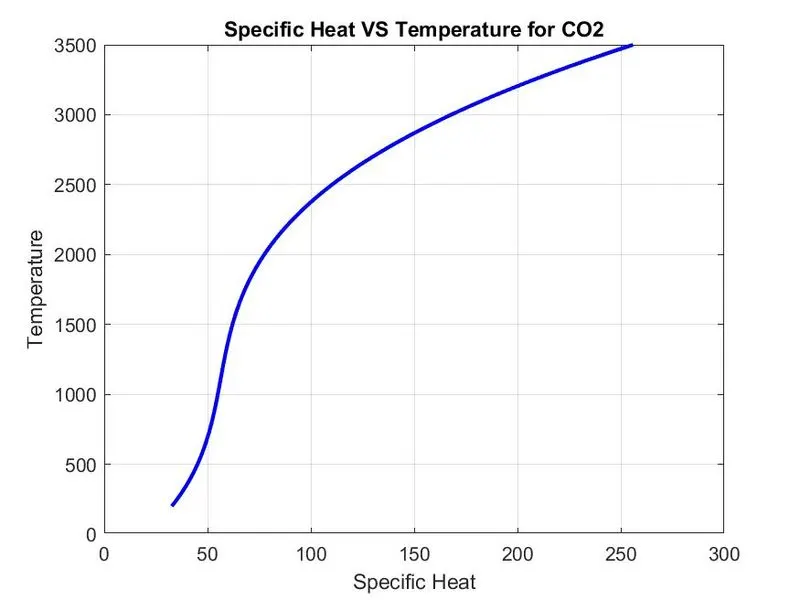
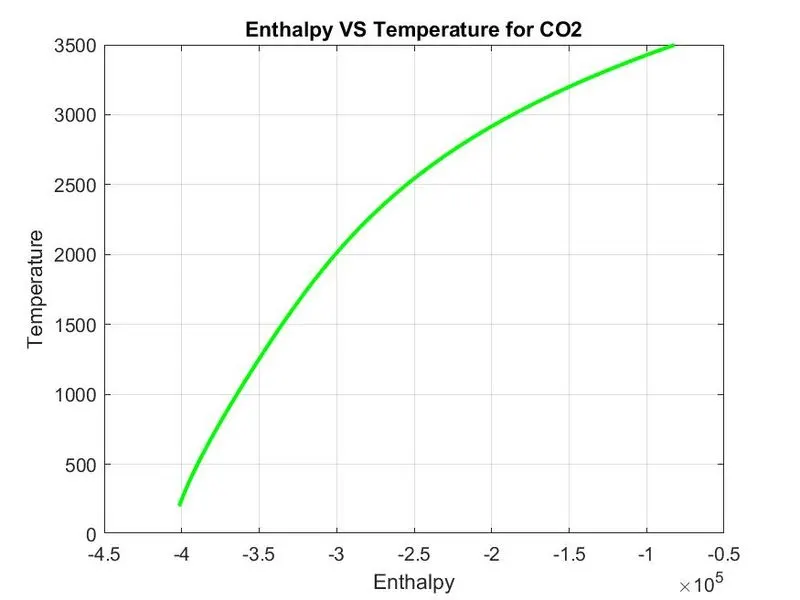
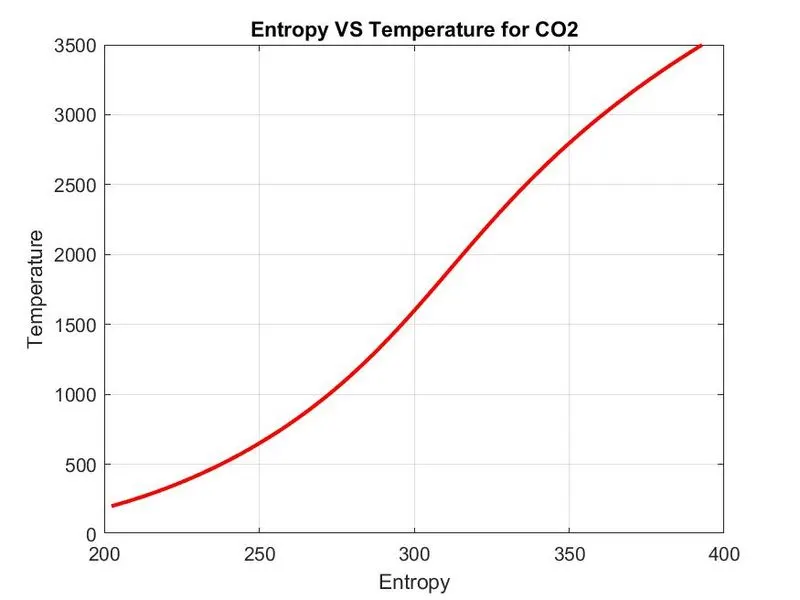
- Plot the Cp, Enthalpy and Entropy for the local temperature range (low temperature: high temperature) specific for each species.
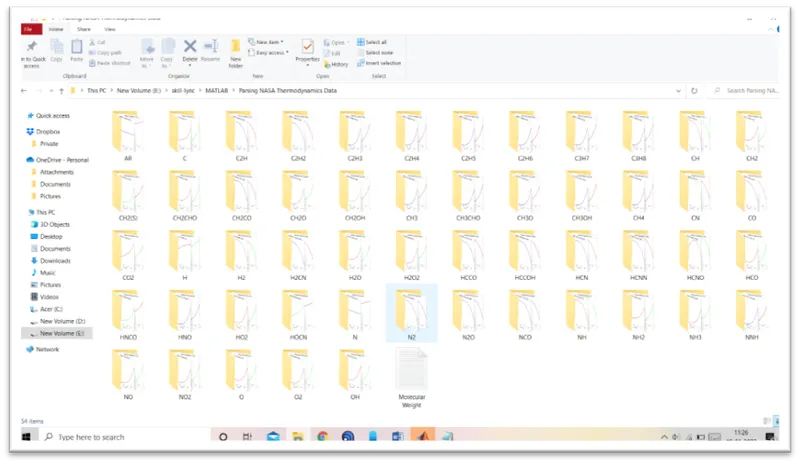
- Save the plots as images with appropriate names and dump them in separate folders for each species with suitable name. All these should be generated automatically.
3. DESCRIPTION: -
Specific Heat, the quantity of heat required to raise the temperature of one gram of a substance by one Celsius degree. The units of specific heat are usually calories or joules per gram per Celsius degree. For example, the specific heat of water is 1 calorie (or 4.186 joules) per gram per Celsius degree.
`(CP)/R = a1 + a2* T + a3 *T^2 + a4* T^3 + a5 *T^4`
Enthalpy, the sum of the internal energy and the product of the pressure and volume of a thermodynamic system. Enthalpy is an energy-like property or state function. it has the dimensions of energy (and is thus measured in units of joules or ergs), and its value is determined entirely by the temperature, pressure, and composition of the system and not by its history. In symbols, the enthalpy, H, equals the sum of the internal energy, E, and the product of the pressure, P, and volume, V, of the system: H = E + PV. According to the law of energy conservation, the change in internal energy is equal to the heat transferred to, less the work done by, the system. If the only work done is a change of volume at constant pressure, the enthalpy change is exactly equal to the heat transferred to the system. When energy needs to be added to a material to change its phase from a liquid to a gas, that amount of energy is called the enthalpy (or latent heat) of vaporization and is expressed in units of joules per mole.
`H/(RT) = a1 + a2 T /2 + a3 T^2 /3 + a4 T^3 /4 + a5 T^4 /5 + a6/T`
Entropy, a thermodynamic quantity representing the unavailability of a system's thermal energy for conversion into mechanical work, often interpreted as the degree of disorder or randomness in the system. The second law of thermodynamics says that entropy always increases with time.
`S/R = a1 lnT + a2 T + a3 T^2 /2 + a4 T^3 /3 + a5 T^4 /4 + a7`
In above three equation, where a1, a2, a3, a4, a5, a6, and a7 are the numerical coefficients supplied in NASA thermodynamic files. The first 7 numbers starting on the second line of each species entry (five of the second line and the first two of the third line) are the seven coefficients (a1 through a7, respectively) for the high-temperature range (above 1000 K, the upper boundary is specified on the first line of the species entry). The remaining seven numbers are the coefficients (b1 through b7, respectively) for the low-temperature range (below 1000 K, the lower boundary is specified on the first line of the species entry).
4. FILE PARSING: -
Parsing in computer languages refers to syntactic analysis of the input code into its components parts in order to facilitate the writing of compilers and interpreters. It can be used to describe split or separation.
Parsing a file means reading in a data stream of some sort and building an in-memory model of the semantic content of that data. This aims at facilitating performing some kind of transformation on the data.
5. PROGRAM
5.1 Main Program
clearvars
close all
clc

% Gas constant in J/mol·K
R = 8.413;

% open the given file for reading
f1 = fopen("THERMO.dat","r");

% skipping comments in file
for i = 1:5
    comments = fgetl(f1);
end

% open the given file for writing
MW = fopen('Molecular Weight.txt','w');
fprintf(MW,'%s\t %s\n','Gas Species','Molecular Weight');

% getting the coefficient of species
for i = 1:53
    tline1 = fgetl(f1);
    split =strsplit(tline1,' ');
    species = split{1};

    % find local temp
    find_dot = strfind(tline1,'.');

    % converting strings cells into numbers
    local_low_temp = str2double(tline1(find_dot(1)-3:find_dot(1)));
    local_high_temp = str2double(tline1(find_dot(2)-4:find_dot(2)));
    local_medium_temp = str2double(tline1(find_dot(3)-4:find_dot(3)));

    % temperature range
    T_local = linspace(local_low_temp,local_high_temp,100);

    % extracting higher and lower coefficient
    line2 = fgetl(f1);
    line3 = fgetl(f1);
    line4 = fgetl(f1);

    A = strfind(line2,'E');
    B = strfind(line3,'E');
    C = strfind(line4,'E');

    % extracting higher temp coefficient
    a1 = str2num(line2(1:A(1)+3));
    a2 = str2num(line2(A(1)+4:A(2)+3));
    a3 = str2num(line2(A(2)+4:A(3)+3));
    a4 = str2num(line2(A(3)+4:A(4)+3));
    a5 = str2num(line2(A(4)+4:A(5)+3));
    a6 = str2num(line3(1:B(1)+3));
    a7 = str2num(line3(B(1)+4:B(2)+3));

    % extracting lower temp coefficient
    b1 = str2num(line3(B(2)+4:B(3)+3));
    b2 = str2num(line3(B(3)+4:B(4)+3));
    b3 = str2num(line3(B(4)+4:B(5)+3));
    b4 = str2num(line4(1:C(1)+3));
    b5 = str2num(line4(C(1)+4:C(2)+3));
    b6 = str2num(line4(C(2)+4:C(3)+3));
    b7 = str2num(line4(C(3)+4:C(4)+3));

    % Make directory
    mkdir(['E:\skill-lync\MATLAB\sample\',species]);
    cd(['E:\skill-lync\MATLAB\sample\',species]);

    % Specific heat calculation
    % if local temp is greater than local medium temp then minimum coefficient taken
    if T_local(i)> local_medium_temp
        CP = R.* (a1+a2.*T_local+a3.*(T_local.^2)+a4.*(T_local.^3)+a5.*(T_local.^4));
        % else maximum coefficient taken
    else
        CP = R.* (b1+b2.*T_local+b3.*(T_local.^2)+b4.*(T_local.^3)+b5.*(T_local.^4));
    end

    % Enthalpy Calculation
    % if local temp is greater than local medium temp then minimum coefficient taken
    if T_local(i)> local_medium_temp
        H = R.*(a1.*T_local+a2.*(T_local.^2)./2+a3.*(T_local.^3)./3+a4.*(T_local.^4)./4+a5.*(T_local.^5)./5+a6);
        % else maximum coefficient taken
    else
        H = R.*(b1.*T_local+b2.*(T_local.^2)./2+b3.*(T_local.^3)./3+b4.*(T_local.^4)./4+b5.*(T_local.^5)./5+b6);
    end

    % Entropy Calculation
    % if local temp is greater than local medium temp then minimum coefficient taken
    if T_local(i)> local_medium_temp
        S = R.*(a1.*log(T_local)+a2.*T_local+a3.*(T_local.^2)./2+a4.*(T_local.^3)./3+a5.*(T_local.^4)./4+a7);
        % else maximum coefficient taken
    else
        S = R.*(b1.*log(T_local)+b2.*T_local+b3.*(T_local.^2)./2+b4.*(T_local.^3)./3+b5.*(T_local.^4)./4+b7);
    end

    %Molecular Weight calculation
    molecularweight = molecular_weight(species);
    fprintf(MW,' %5s\t\t%14f \n',species,molecularweight);

    % Plot of Specific Heat VS Temperature
    figure (1)
    plot(CP,T_local,'linewidth',2,'Color','b')
    title(sprintf('Specific Heat VS Temperature for %s',species))
    xlabel('Specific Heat')
    ylabel('Temperature')
    grid on
    saveas(1,'CP_vs_T.jpg')

    % Plot of Enthalpy VS Temperature
    figure (2)
    plot(H,T_local,'linewidth',2,'Color','g')
    title(sprintf('Enthalpy VS Temperature for %s',species))
    xlabel('Enthalpy')
    ylabel('Temperature')
    grid on
    saveas(2,'H_vs_T.jpg')

    % Plot of Entropy VS Temperature
    figure (3)
    plot(S,T_local,'linewidth',2,'Color','r')
    title(sprintf('Entropy VS Temperature for %s',species))
    xlabel('Entropy')
    ylabel('Temperature')
    grid on
    saveas(3,'S_vs_T.jpg')
end
fclose(MW);
fclose(f1);
5.2 Explanation
Step1: - Open file and read data
Commands used (fopen, fgetl, strsplit, linspace, str2num)
We opened the given file for reading by using fopen( ) command and assigned variable called f1. Then we used fgetl (f1) command to read the new line in documents every time.
After reading second line we had used strsplit command to split the temp string into number of cells and indicates as a (s). Then the string value are converted into number by using str2num or str2double command in this line. In this line, s(1) is blank space and other three positions are global temp value. We consider here global minimum, medium and maximum value for gas species.
To consider local temp with reference to global temp we used linspace command and got local temp in between low to high global temp.
The line with (!) are comments for file, for calculation we didn’t need this. With the help of for loop command we skip this part of data file.
Step2: - Extracting the whole species
Commands used (fgetl, strtok)
In this step we are extracted the species data, with the help of for loop and stored in variable called line 1. This was going to extract all the data in the single line. To extract only species names which are located in the first in all the rows. For this operation we used strtok command. This command parses string from left to right, using whitespace characters as delimiters, and returns part or all of the text in row.
Step3: - Extracting the all-species coefficient
Command used (fgetl, strfind, str2num)
In this step we are extracted the species coefficient with the help of fgetl command and stored in variable line1, line2 and line3. Then we are used strfind command to extract the coefficient data and stored in variables A, B and C using exponential notation (‘E’) so we can get location of exponential value.
After finding location of E, for first coefficient we are saying that (line2(1:A(1)+3)) this means that from line2 we were got our first coefficient. Here A(1)said that the location till Exponential notation and adding +3 it gives whole value of coefficient. Then for second coefficient we said that (line2(A(1)+4:A(2)+3)), here A(1) +4 said that starting point of second coefficient and A(2
) Said that the location till second exponential by adding +3we were reached the end of second coefficient. But the coefficient is still in the form of string. we were going to extract the 14 coefficient of gas species with the help of str2num command and same process as mention above.
These operations were done inside for loop so we can extract all 53 species data. So here we said that a1 to a7 are high temp coefficient and b1 to b2 were low temp coefficient. Also store this in variable as mention above.
Step4: - Calculation of properties of gas
In this step, we were calculated the specific heat, enthalpy, entropy and molecular weight. We were used if else command here to calculate all properties. Also compared the local temp with local medium temp as if local temp is greater than local medium temp then minimum coefficient taken, else maximum coefficient taken.
5.6 Molecular Weight Calculation
The species atomic names were created in the form of cell array included [H, C, O, N, A] as the whole element consist from all of this atom also created cell array for their atomic weight of all above atoms. The initially molecular weight considered equal to 0. Then we were used for loop so we can get molecular weight for all the gas species.
Now, I had used strcmp command to compare atom with species. Also, set position in loop. If atom is greater than 1 then molecular weight is again calculated by having the atomic weight for current species with (n-1) here n is elements of molecules of elements present in the species.
% Calculation of molecular weight
function molecularweight = molecular_weight(species)

% The atom which are used in our gas species.
atomic_name = ['H','C','O','N','A'];

% respective atomic weight
Atomic_weight = [1.088 12.011 15.999 14.007 39.948];
molecularweight = 0;
% add Atomic number to get respective molecular weight
for i = 1:length(species)
    for j =1:length (atomic_name)
        if strcmpi(species(i),atomic_name(j))
            molecularweight = molecularweight+Atomic_weight(j);
            posotion = (j);
        end
    end
    n = str2num(species(i));

    if n>1
        molecularweight = molecularweight +Atomic_weight(posotion)*(n-1);
    end
end
fprintf('molecular weight of %s :',species);
fprintf('%f',molecularweight);
disp(' ');
end
Step5: - Plotting
Command used (plot, xlabel, ylabel, grid on, title,saveas)
Plotting is done in this step for specific heat vs temperature, enthalpy vs temperature, entropy vs temperature. saveas command is used to save plot in folder.
Step6: - Make separate folder
Commands used (mkdir, cd, fopen, fprintf, fclose( )
The plots were saved in separate directory for every species and also for molecular weight file. The mkdir line say that created a new directory or folder with name called and the specific folders name inside directory for every species.
Cd says current directly was selected for all files to be saved. Then in same directory a new .txt file is open name as Molecular Weight. Here we were used fopen command with write phrase to create new file for molecular weight. Then format specifier %s, %f is used to mention string and values in file. Lastly used fclose command close all files.
6. Error occurred
6.1 Empty folder
Folder was created but they are empty because of misalignment of program we have to program in alignment because we are using for loop in program.
6.2 Empty .txt file
File was created but they are content only one species because of misalignment of program we have to program in alignment because we are using for loop in program.
6.3 Cd error
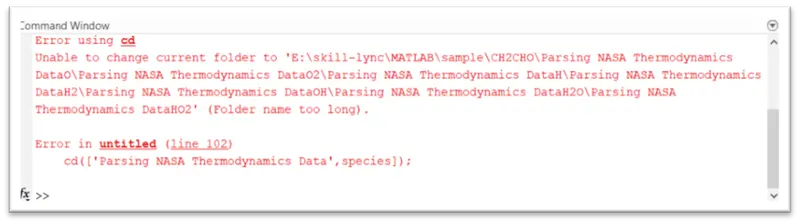
This error is occurred in cd command because we didn’t used proper syntax for cd. To overcome this error, I had use proper syntax for cd as follow,
mkdir(['E:skill-lyncMATLABParsing NASA Thermodynamics Data',species]);
cd(['E:skill-lyncMATLABParsing NASA Thermodynamics Data',species]);
7. PLOT FOR O2, N2, C2O
7.1 Plot for O2
7.3 Plot for N2
7.2 Plot for CO2
8. FILE SCREENSHOT
9. COMMAND WINDOW RESULT
10. CONCLUSON
Hence, we conclude that using above MATLAB code. The require data extracted from NASA thermodynamics data file. Used this data for calculation of specific heat, enthalpy and entropy. also plot the graph for above properties vs local temperature. molecular weight was also calculated. New folder created for save all data.
11. REFFERENCE
- https://in.mathworks.com/help/matlab/matlab_prog/formatting-strings.html
- https://in.mathworks.com/help/matlab/ref/fopen.html
- https://in.mathworks.com/help/matlab/ref/mkdir.html?s_tid=doc_ta
- https://in.mathworks.com/help/matlab/ref/cd.html?s_tid=doc_ta
- https://in.mathworks.com/help/matlab/ref/sprintf.html?s_tid=doc_ta
- https://in.mathworks.com/help/matlab/ref/fgetl.html?s_tid=doc_ta
- https://in.mathworks.com/help/matlab/ref/fprintf.html?s_tid=doc_ta
- https://in.mathworks.com/help/matlab/ref/strcmp.html?s_tid=doc_ta
- https://in.mathworks.com/help/matlab/ref/str2num.html?s_tid=doc_ta
12. Google drive link of created folder
https://drive.google.com/drive/folders/12MjEEHm0Vqob3bVurk8SaAjgJNlgg64i?usp=sharing